Scottish Fire and Rescue Service (SFRS) - wildfire: incident reporting system - data analyses
This report examines Incident Reporting System (IRS) data on wildland fire incidents and uses these to improve the understanding of how upland wildfires start, investigate if wildfire occurrence differs between geographical areas; and describe how wildfires exhibit seasonal and temporal trends.
5 Investigation of patterns in the IRS wildfires dataset
5.1 Overview
We used the information recorded in the filtered IRS wildfire dataset to identify patterns of wildfire occurrence related to a) time and seasonality; b) vegetation and fuel types; c) size of burnt areas; d) motives of ignition along with causes of ignition, ignition source and items causing ignition and spreading fire (where available) and e) accessibility and proximity to urban areas. For the latter we used the Scottish Government Urban Rural Classification (downloaded in ESRI shapefile format from https://spatialdata.gov.scot) which provides a consistent way of defining urban and rural areas across Scotland and is based upon two main criteria: a) population as defined by National Records of Scotland (NRS), and b) accessibility based on drive time analysis to differentiate between accessible and remote areas in Scotland.
For this analysis, we used the full dataset of identified wildfires (n=9,725) and a subset of wildfire incidents with damage area greater than 1,000 m2 (n=1,325); we used this threshold in consultation with the SFRS to select fire incidents most likely to be bigger wildfires with significant impacts on seminatural habitats and filter out those wildfires that are more likely to be small incidents driven mainly by anti-social behaviour or relatively trivial cases of negligence with fire. Results of this analysis are presented in a consistent way at a) National level and b) Local Authority (LA) level to enable project results to be communicated to local staff in the SFRS and NatureScot. To facilitate an easier comparison of wildfire occurrence patterns in different LAs, we used cluster analysis to group LAs based on similar wildfire characteristics and presented respective patterns for the LA groupings identified by the analysis. More details on this are given in Section 5.4.
5.2 Patterns at National Level
5.2.1 Temporal – Seasonality
5.2.1.1 Annual
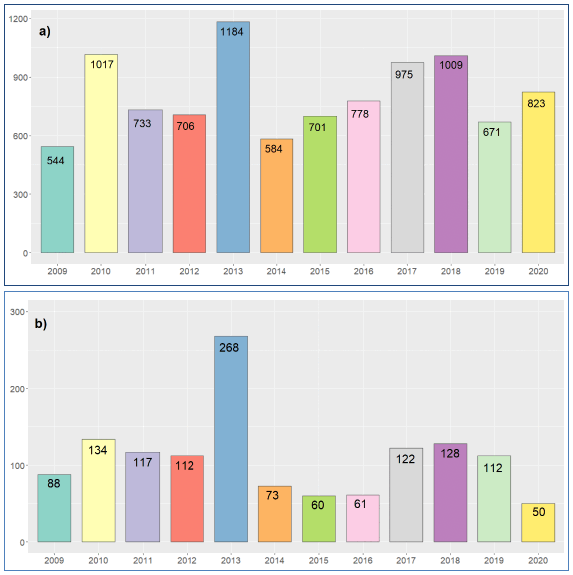
The number of yearly wildfire incidents (with complete records) in the full dataset ranged from 584 incidents in 2014 to 1,184 incidents in 2013 (Figure 5.1a). Overall, there are no indications of the presence of an increasing or decreasing trend over time in the number of wildfires occurring in Scotland based on the IRS records.
Regarding the subset of bigger wildfires, yearly fire incidents ranged from 50 incidents in 2020 to 134 incidents in 2010 (Figure 5.1b), with the exception of 2013 (Figure 5.1b) when 268 wildfires were recorded, most in the Highland and Na h-Eileanan Siar areas (125 and 83 fire incidents, respectively). This spike of wildfire activity was followed by three years of lower wildfire frequency up to 2016, while wildfire numbers increased again between 2017 to 2019 before dipping again in 2020 to just 50 big wildfires.
5.2.1.2 Monthly
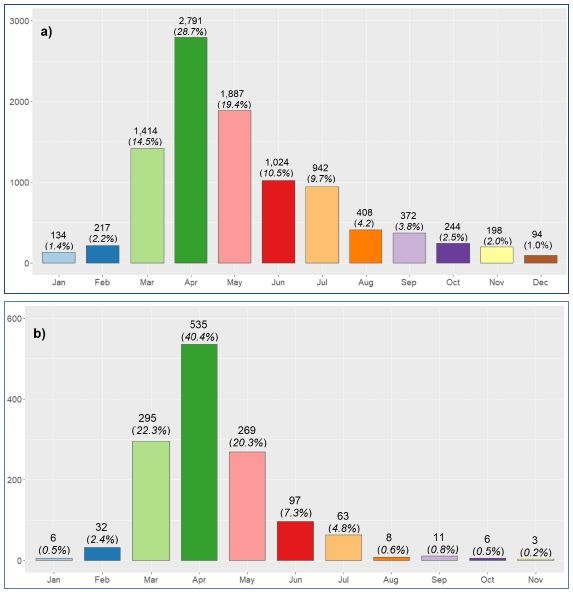
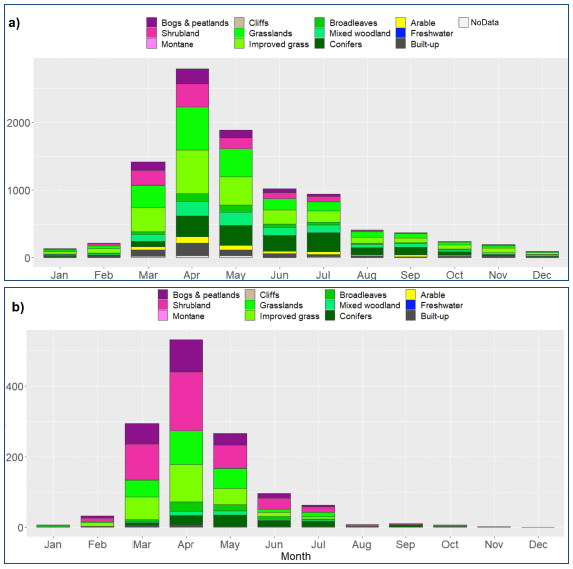
Looking at seasonality at a monthly basis for all years, it is evident that most wildfires occur during the spring season: almost 29% of all wildfires occur in April, followed by 20% of wildfires in May and 15% in March (Figure 5.2a). A further 28% of wildfires occur in the summer season and in September, with small numbers occurring in late autumn and in the winter season. Occurrence of spring wildfires is much more dominant in the subset of bigger wildfires with around 81% of wildfires occurring in April (40.4%), March (22.3%) and May (20.3%) (Figure 5.2a). Moreover, a smaller proportion of bigger wildfires was recorded in summer months, especially in July and August when only 4.8% and 0.6%, respectively, of all bigger wildfires occurred compared to 9.7% in July and 4.2% in August of wildfires from the full dataset.
The same seasonal patterns emerge for the wildfires from the full dataset when looking at each year individually (Table 5.1). Most wildfires occur in the spring season, either in April or May. The only exception is year 2018 where most fires occurred in July and the second most fires in May; this could be explained by the prolonged period of above average temperature and below average precipitation that Scotland experienced from late spring to mid-summer that year, which could have caused an increased number of ignitions during this period.
Similarly for the subset of bigger wildfires, most wildfires occurred in April followed by wildfires occurring in May (Table 5.2). Looking at bigger wildfires occurring in the summer months, these accounted for just 2% of bigger fire incidents recorded in 2017 to 27% of fire incidents recorded in 2014.
| Year | Sum | Jan | Feb | Mar | Apr | May | Jun | Jul | Aug | Sep | Oct | Nov | Dec |
|---|---|---|---|---|---|---|---|---|---|---|---|---|---|
| 2009 | 544 | 0 | 0 | 0 | 39 | 16 | 16 | 11 | 6 | 4 | 4 | 3 | 1 |
| 2010 | 1017 | 1 | 2 | 12 | 33 | 21 | 17 | 6 | 3 | 3 | 1 | 2 | 0 |
| 2011 | 733 | 1 | 1 | 18 | 35 | 21 | 6 | 8 | 2 | 1 | 2 | 3 | 1 |
| 2012 | 706 | 1 | 2 | 42 | 11 | 20 | 11 | 3 | 4 | 3 | 1 | 2 | 1 |
| 2013 | 1184 | 1 | 3 | 21 | 35 | 8 | 8 | 14 | 4 | 4 | 1 | 1 | 1 |
| 2014 | 584 | 3 | 1 | 12 | 28 | 10 | 10 | 14 | 5 | 9 | 5 | 3 | 1 |
| 2015 | 701 | 1 | 4 | 11 | 39 | 11 | 10 | 4 | 5 | 7 | 5 | 2 | 0 |
| 2016 | 778 | 0 | 1 | 17 | 21 | 28 | 15 | 3 | 4 | 2 | 4 | 2 | 1 |
| 2017 | 975 | 2 | 3 | 14 | 25 | 38 | 6 | 3 | 3 | 2 | 2 | 2 | 1 |
| 2018 | 1009 | 1 | 2 | 10 | 9 | 19 | 11 | 29 | 6 | 4 | 3 | 2 | 2 |
| 2019 | 671 | 4 | 6 | 7 | 47 | 14 | 5 | 6 | 3 | 3 | 3 | 1 | 1 |
| 2020 | 823 | 2 | 1 | 7 | 29 | 22 | 13 | 8 | 6 | 6 | 2 | 2 | 1 |
| Year | Sum | Jan | Feb | Mar | Apr | May | Jun | Jul | Aug | Sep | Oct | Nov | Dec |
|---|---|---|---|---|---|---|---|---|---|---|---|---|---|
| 2009 | 88 | 0 | 0 | 0 | 58 | 16 | 19 | 5 | 2 | 0 | 0 | 0 | 0 |
| 2010 | 134 | 0 | 4 | 13 | 51 | 21 | 7 | 1 | 1 | 1 | 1 | 0 | 0 |
| 2011 | 117 | 0 | 0 | 15 | 50 | 28 | 3 | 4 | 0 | 0 | 0 | 0 | 0 |
| 2012 | 112 | 0 | 1 | 52 | 7 | 21 | 14 | 3 | 1 | 1 | 0 | 0 | 0 |
| 2013 | 268 | 0 | 2 | 36 | 43 | 4 | 7 | 6 | 1 | 1 | 0 | 0 | 0 |
| 2014 | 73 | 0 | 0 | 16 | 42 | 11 | 8 | 18 | 1 | 0 | 0 | 3 | 0 |
| 2015 | 60 | 0 | 0 | 15 | 60 | 12 | 8 | 0 | 0 | 0 | 5 | 0 | 0 |
| 2016 | 61 | 0 | 0 | 16 | 39 | 30 | 11 | 0 | 2 | 0 | 2 | 0 | 0 |
| 2017 | 122 | 0 | 10 | 22 | 12 | 53 | 2 | 0 | 0 | 0 | 0 | 0 | 0 |
| 2018 | 128 | 0 | 2 | 30 | 21 | 22 | 6 | 16 | 0 | 2 | 1 | 1 | 0 |
| 2019 | 112 | 4 | 6 | 4 | 73 | 10 | 1 | 1 | 0 | 0 | 0 | 0 | 0 |
| 2020 | 50 | 0 | 0 | 8 | 38 | 42 | 6 | 0 | 0 | 6 | 0 | 0 | 0 |
5.2.2 Fuel types
5.2.2.1 Annual
Tables 5.3 and 5.4 give fire incident counts at Broad Habitat (BH) level classified from Level 3 Property Types for the full wildfire dataset and the subset of bigger fires, respectively, for years 2009 to 2020, while Tables 5.5 and 5.6 provide the same information for BHs classified from LCS88 classes. In addition, Figures 5.3 and 5.4 give the stacked proportions of individual BHs classified from Level 3 Property Types and LCS88 classes, for each year and wildfire dataset.
Investigation of Table 5.3 and Figure 5.3a. shows that there is limited inter-annual variability in the fuel time composition based on BHs classified from Level 3 Property Types. Wildfires burning grasslands are the most frequent for most years, followed by wildfires burning heathlands/shrubland. On the other hand, bigger wildfires burning heathland and grassland, based on Level 3 Property types, are the most frequent for all years and the proportion of fires on shrubland in relation to all recorded wildfires is greater than fires on grassland for all years (Table 5.4 and Figure 5.3b).
| Year | Shrub land | Grass lands | Broad leaves | Conifers | Arable | Fresh water | Linear features | Built- up | Refuse | Other | None |
|---|---|---|---|---|---|---|---|---|---|---|---|
| 2009 | 138 | 214 | 71 | 14 | 5 | 2 | 22 | 1 | 55 | 22 | 0 |
| 2010 | 275 | 377 | 135 | 50 | 11 | 1 | 52 | 11 | 75 | 30 | 0 |
| 2011 | 202 | 231 | 121 | 36 | 8 | 1 | 27 | 3 | 70 | 34 | 0 |
| 2012 | 222 | 239 | 76 | 25 | 11 | 0 | 33 | 5 | 57 | 38 | 0 |
| 2013 | 383 | 498 | 88 | 30 | 7 | 2 | 49 | 11 | 79 | 37 | 0 |
| 2014 | 164 | 194 | 64 | 35 | 6 | 1 | 22 | 2 | 61 | 35 | 0 |
| 2015 | 168 | 296 | 68 | 31 | 8 | 2 | 32 | 7 | 53 | 36 | 0 |
| 2016 | 200 | 340 | 76 | 30 | 14 | 0 | 34 | 11 | 51 | 22 | 0 |
| 2017 | 254 | 354 | 134 | 66 | 4 | 3 | 52 | 8 | 65 | 35 | 0 |
| 2018 | 284 | 351 | 119 | 74 | 8 | 0 | 40 | 6 | 75 | 52 | 0 |
| 2019 | 243 | 195 | 76 | 26 | 10 | 0 | 26 | 1 | 60 | 34 | 0 |
| 2020 | 157 | 273 | 138 | 76 | 11 | 2 | 36 | 4 | 86 | 39 | 1 |
| Sum | 2,690 | 3,562 | 1,166 | 493 | 103 | 14 | 425 | 70 | 787 | 414 | 1 |
| Year | Shrubland | Grasslands | Broadleaves | Conifers | Arable | Linear features | Refuse | Other |
|---|---|---|---|---|---|---|---|---|
| 2009 | 41 | 35 | 6 | 5 | 0 | 0 | 0 | 1 |
| 2010 | 86 | 32 | 3 | 10 | 0 | 2 | 0 | 1 |
| 2011 | 76 | 22 | 7 | 7 | 1 | 0 | 2 | 2 |
| 2012 | 75 | 22 | 4 | 8 | 0 | 2 | 0 | 1 |
| 2013 | 169 | 71 | 10 | 10 | 2 | 3 | 2 | 1 |
| 2014 | 50 | 17 | 1 | 5 | 0 | 0 | 0 | 0 |
| 2015 | 35 | 19 | 3 | 3 | 0 | 0 | 0 | 0 |
| 2016 | 37 | 19 | 1 | 3 | 0 | 1 | 0 | 0 |
| 2017 | 78 | 29 | 7 | 7 | 0 | 1 | 0 | 0 |
| 2018 | 87 | 26 | 2 | 11 | 0 | 0 | 1 | 1 |
| 2019 | 93 | 13 | 0 | 6 | 0 | 0 | 0 | 0 |
| 2020 | 26 | 12 | 4 | 8 | 0 | 0 | 0 | 0 |
| Sum | 853 | 317 | 48 | 83 | 3 | 9 | 5 | 7 |
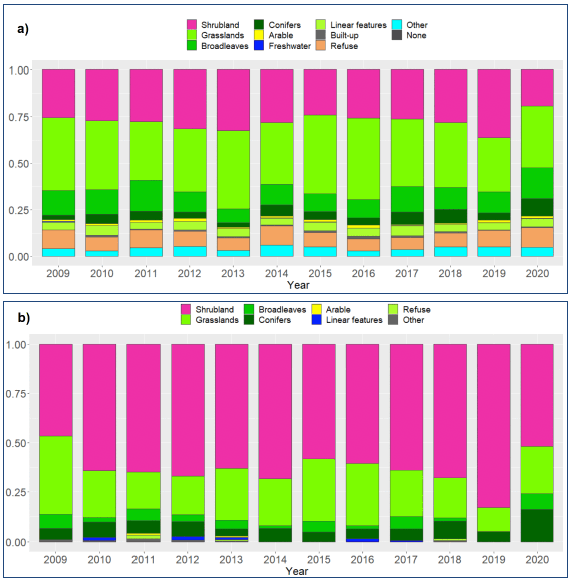
The picture is similar for fuel type composition when LCS88 classes are used to classify BHs (Table 5.5 and Figure 5.4a, full dataset), with grassland fires being the most frequent. But there is slightly more variability in fuel type composition regarding wildfires burning peatlands and bogs and heathland/shrubland in some years compared to BHs classified from Level 3 Property Types. Nevertheless, there is no evident trend in fuel type composition over the 2009 to 2020 period for the full wildfire dataset.
Regarding the subset of bigger wildfires, fires on shrubland are the most frequent for all years based on LCS88 classes (Table 5.6 and Figure 5.4b), but to a lesser degree than when BHs classified from Level 3 Property Types were used. When combined, wildfires on bogs and peatland and on shrubland outnumbered all grassland fires (on both seminatural and improved grass) from 2010 to 2014 and from 2017 to 2020, the opposite was observed in 2015, 2016 and 2020, while the same number of fires on bogs/peatlands and shrubland and on grasslands was recorded in 2009.
| Year | Bogs & peatlands | Shrub land | Monta ne | Cliffs | Grass lands | Impr grass | Broad leaves | Mixed wood | Conifers | Arable | Fresh water | Built- up | No Data |
|---|---|---|---|---|---|---|---|---|---|---|---|---|---|
| 2009 | 35 | 46 | 0 | 0 | 103 | 120 | 33 | 42 | 92 | 32 | 1 | 31 | 9 |
| 2010 | 74 | 92 | 1 | 0 | 198 | 239 | 38 | 84 | 149 | 52 | 2 | 76 | 12 |
| 2011 | 43 | 80 | 0 | 0 | 179 | 161 | 30 | 67 | 97 | 31 | 5 | 28 | 12 |
| 2012 | 67 | 89 | 0 | 2 | 143 | 173 | 42 | 66 | 75 | 14 | 1 | 28 | 6 |
| 2013 | 95 | 159 | 0 | 0 | 240 | 289 | 41 | 101 | 152 | 28 | 5 | 63 | 11 |
| 2014 | 40 | 76 | 0 | 2 | 101 | 137 | 18 | 42 | 107 | 23 | 1 | 31 | 6 |
| 2015 | 24 | 47 | 0 | 0 | 181 | 157 | 22 | 66 | 120 | 35 | 2 | 41 | 6 |
| 2016 | 41 | 52 | 0 | 0 | 190 | 193 | 26 | 79 | 104 | 23 | 2 | 55 | 13 |
| 2017 | 50 | 87 | 1 | 0 | 228 | 163 | 50 | 127 | 166 | 39 | 1 | 49 | 14 |
| 2018 | 47 | 113 | 0 | 1 | 187 | 217 | 48 | 92 | 211 | 39 | 2 | 42 | 10 |
| 2019 | 54 | 85 | 1 | 0 | 120 | 156 | 34 | 79 | 83 | 22 | 0 | 30 | 7 |
| 2020 | 34 | 47 | 0 | 1 | 136 | 183 | 35 | 105 | 193 | 30 | 2 | 39 | 18 |
| Sum | 604 | 973 | 3 | 6 | 2,006 | 2188 | 417 | 950 | 1,549 | 368 | 24 | 513 | 124 |
| Year | Bogs & peatlands | Shrub land | Monta ne | Cliffs | Grass lands | Impr grass | Broad leaves | Mixed wood | Conifers | Arable | Fresh water | Built- up | No Data |
|---|---|---|---|---|---|---|---|---|---|---|---|---|---|
| 2009 | 12 | 23 | 0 | 0 | 12 | 23 | 10 | 2 | 4 | 0 | 0 | 0 | 2 |
| 2010 | 22 | 40 | 0 | 0 | 29 | 18 | 8 | 2 | 10 | 0 | 0 | 2 | 3 |
| 2011 | 14 | 36 | 0 | 0 | 28 | 20 | 7 | 3 | 7 | 0 | 0 | 2 | 0 |
| 2012 | 22 | 40 | 0 | 1 | 11 | 20 | 8 | 2 | 7 | 1 | 0 | 0 | 0 |
| 2013 | 46 | 88 | 0 | 0 | 47 | 53 | 6 | 8 | 14 | 0 | 2 | 2 | 2 |
| 2014 | 15 | 26 | 0 | 0 | 14 | 8 | 2 | 1 | 6 | 0 | 0 | 0 | 1 |
| 2015 | 10 | 13 | 0 | 0 | 18 | 13 | 0 | 1 | 5 | 0 | 0 | 0 | 0 |
| 2016 | 12 | 10 | 0 | 0 | 9 | 21 | 3 | 0 | 3 | 0 | 0 | 3 | 0 |
| 2017 | 20 | 32 | 0 | 0 | 25 | 15 | 8 | 7 | 14 | 1 | 0 | 0 | 0 |
| 2018 | 16 | 40 | 0 | 0 | 16 | 27 | 3 | 3 | 18 | 1 | 0 | 3 | 1 |
| 2019 | 20 | 39 | 1 | 0 | 15 | 21 | 5 | 3 | 7 | 0 | 0 | 1 | 0 |
| 2020 | 4 | 10 | 0 | 0 | 9 | 8 | 2 | 2 | 14 | 0 | 0 | 0 | 1 |
| Sum | 213 | 397 | 1 | 1 | 233 | 247 | 62 | 34 | 109 | 3 | 2 | 13 | 10 |
5.2.2.2 Monthly
Regarding fuel type composition at a monthly basis for the whole 2009-2020 period and based on BHs classified from IRS Level 3 Property Types (Table 5.7 and Figure 5.5a), most wildfires burning heathlands/shrubland and grasslands (both managed and seminatural) occurred in April (36% and 33% respectively), while most wildfires on broadleaves and conifers occurred in May (21% and 24%, respectively). Overall, 70-80% of all wildfires on shrubland and grasslands occurred in the spring season, while around 80% of wildfires on woodlands (broadleaves and conifers) occurred from late spring to the end of the summer season. On the other hand, wildfires from loose refuse and on wasteland show smaller seasonal variability with monthly proportions ranging from 7.5% to 15% for almost all months in the spring, summer, and autumn seasons.
| BH | Jan | Feb | Mar | Apr | May | Jun | Jul | Aug | Sep | Oct | Nov | Dec |
|---|---|---|---|---|---|---|---|---|---|---|---|---|
| Shrubland | 0.8 | 2.4 | 19.7 | 36.3 | 19.7 | 8.4 | 6.8 | 1.4 | 1.9 | 1.4 | 1.0 | 0.2 |
| Grasslands | 1.0 | 1.6 | 17.0 | 33.4 | 19.3 | 9.3 | 8.5 | 3.7 | 2.9 | 1.6 | 1.1 | 0.5 |
| Broadleaves | 1.1 | 1.8 | 6.9 | 18.8 | 21.3 | 16.6 | 14.6 | 7.1 | 6.3 | 3.0 | 1.8 | 0.8 |
| Conifers | 0.8 | 1.6 | 4.3 | 18.3 | 23.9 | 13.8 | 19.5 | 6.7 | 6.5 | 2.8 | 0.8 | 1.0 |
| Arable | 2.9 | 1.9 | 10.7 | 20.4 | 16.5 | 7.8 | 10.7 | 5.8 | 9.7 | 7.8 | 4.9 | 1.0 |
| Freshwater | 0.0 | 7.1 | 7.1 | 14.3 | 21.4 | 14.3 | 7.1 | 0.0 | 14.3 | 7.1 | 7.1 | 0.0 |
| Linear features | 1.2 | 4.0 | 11.8 | 24.2 | 20.5 | 12.9 | 8.2 | 5.2 | 4.0 | 4.0 | 1.9 | 2.1 |
| Built-up | 2.9 | 2.9 | 10.0 | 14.3 | 20.0 | 11.4 | 10.0 | 10.0 | 10.0 | 5.7 | 2.9 | 0.0 |
| Refuse | 4.4 | 3.4 | 9.5 | 15.1 | 15.2 | 10.2 | 10.3 | 7.9 | 7.5 | 5.3 | 7.4 | 3.7 |
| Other | 3.6 | 4.6 | 7.5 | 15.0 | 14.7 | 12.3 | 13.5 | 5.3 | 4.3 | 7.0 | 8.0 | 4.1 |
| None | 0.0 | 0.0 | 0.0 | 0.0 | 0.0 | 0.0 | 0.0 | 100.0 | 0.0 | 0.0 | 0.0 | 0.0 |
| BH | Jan | Feb | Mar | Apr | May | Jun | Jul | Aug | Sep | Oct | Nov | Dec |
|---|---|---|---|---|---|---|---|---|---|---|---|---|
| Shrubland | 0.7 | 2.6 | 25.1 | 41.6 | 18.9 | 6.0 | 3.3 | 0.5 | 0.6 | 0.5 | 0.4 | 0.0 |
| Grasslands | 0.0 | 2.5 | 21.5 | 41.3 | 20.8 | 7.9 | 4.1 | 0.9 | 0.3 | 0.6 | 0.0 | 0.0 |
| Broadleaves | 0.0 | 0.0 | 14.6 | 29.2 | 25.0 | 16.7 | 12.5 | 2.1 | 0.0 | 0.0 | 0.0 | 0.0 |
| Conifers | 0.0 | 2.4 | 4.8 | 30.1 | 28.9 | 12.0 | 15.7 | 0.0 | 6.0 | 0.0 | 0.0 | 0.0 |
| Arable | 0.0 | 0.0 | 0.0 | 33.3 | 33.3 | 0.0 | 33.3 | 0.0 | 0.0 | 0.0 | 0.0 | 0.0 |
| Linear features | 0.0 | 0.0 | 22.2 | 11.1 | 33.3 | 22.2 | 11.1 | 0.0 | 0.0 | 0.0 | 0.0 | 0.0 |
| Refuse | 0.0 | 0.0 | 0.0 | 60.0 | 20.0 | 0.0 | 20.0 | 0.0 | 0.0 | 0.0 | 0.0 | 0.0 |
| Other | 0.0 | 0.0 | 0.0 | 71.4 | 14.3 | 14.3 | 0.0 | 0.0 | 0.0 | 0.0 | 0.0 | 0.0 |
Regarding fuel type composition at a monthly basis for the subset of bigger wildfires and based on BHs classified from IRS Level 3 Property Types (Table 5.8 and Figure 5.5b), again most wildfires burning heathlands/shrubland and grasslands occurred in April (42% and 41% respectively), but this was also the case for woodland/forest fires as most wildfires on broadleaves and conifers also occurred in April (29% and 30%, respectively). Overall, around 85% of all wildfires on shrubland and grasslands occurred in the spring season, while around 65% to 70% of wildfires on woodlands (broadleaves and conifers) occurred in the spring season and around 30% during summer months. There were only 24 bigger incidents with BHs other than shrubland, grasslands and woodlands, with most also occurring in the spring season.

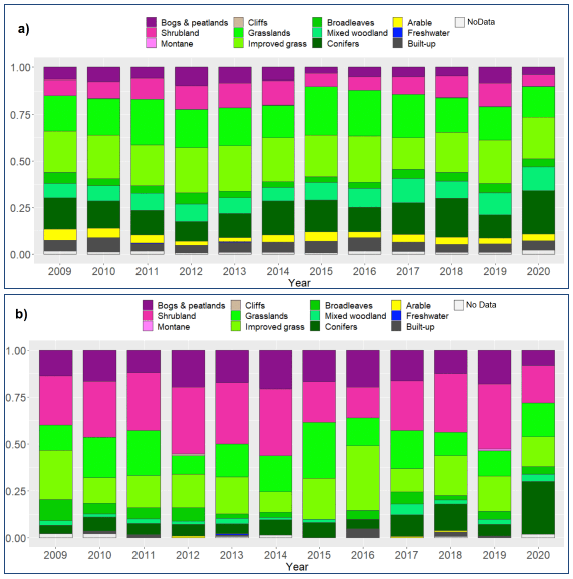
Similar to BHs based on Level 3 Property Type, most wildfires burning on bogs and peatlands, heathlands/shrubland and seminatural grasslands for the 2009-2020 period, based on BHs classified from LCS88 classes, occurred in April and around 70%-75% of all wildfires for those fuel types occurred in the spring season (Table 5.9 and Figure 5.6a). The picture is also similar for wildfires on improved grasslands. For wildfires on woodlands (broadleaves, conifers and mixed), most wildfires (67%-75%) occurred from April to end of July. Looking at the subset of bigger wildfire incidents (Table 5.10 and Figure 5.6b), most wildfires burning on bogs and peatlands, heathlands/shrubland, seminatural and improved grasslands, broadleaves and mixed woodland occurred in April and around 76%-87% of all wildfires for those fuel types occurred in the spring season. Most conifer wildfires were recorded in May and a greater number of bigger wildfires on conifers occurred during the summer season (30% of all conifer fires) compared to wildfires on mixed woodland (24%) and on broadleaves (16%), indicating that there might be a greater risk of conifer forest fires in the summer compared to other woodland types.
| BH | Jan | Feb | Mar | Apr | May | Jun | Jul | Aug | Sep | Oct | Nov | Dec |
|---|---|---|---|---|---|---|---|---|---|---|---|---|
| Bogs & peatlands | 1.0 | 1.8 | 20.5 | 36.8 | 19.4 | 10.6 | 6.0 | 1.0 | 1.0 | 0.7 | 1.0 | 0.3 |
| Shrubland | 1.0 | 2.9 | 22.1 | 35.1 | 15.9 | 8.6 | 7.9 | 2.1 | 1.2 | 1.3 | 1.5 | 0.2 |
| Montane | 0.0 | 0.0 | 33.3 | 33.3 | 33.3 | 0.0 | 0.0 | 0.0 | 0.0 | 0.0 | 0.0 | 0.0 |
| Cliffs | 0.0 | 16.7 | 50.0 | 0.0 | 0.0 | 0.0 | 33.3 | 0.0 | 0.0 | 0.0 | 0.0 | 0.0 |
| Grasslands | 1.5 | 2.1 | 16.7 | 31.7 | 20.8 | 8.6 | 6.8 | 4.0 | 3.2 | 2.0 | 1.8 | 0.8 |
| Improved grass | 1.6 | 3.1 | 16.2 | 29.4 | 19.1 | 9.4 | 7.5 | 3.9 | 3.1 | 2.7 | 3.0 | 1.2 |
| Broadleaves | 1.0 | 1.4 | 9.8 | 27.8 | 25.2 | 12.2 | 9.4 | 4.3 | 3.1 | 3.6 | 0.7 | 1.4 |
| Mixed woodland | 1.7 | 1.9 | 10.4 | 22.0 | 20.7 | 12.3 | 12.4 | 5.4 | 5.7 | 2.9 | 2.7 | 1.8 |
| Conifers | 1.2 | 1.4 | 5.0 | 19.9 | 19.1 | 15.2 | 17.9 | 6.9 | 7.5 | 3.3 | 1.7 | 0.8 |
| Arable | 2.4 | 2.7 | 14.1 | 25.5 | 18.2 | 8.7 | 11.7 | 2.7 | 6.3 | 3.8 | 2.4 | 1.4 |
| Freshwater | 0.0 | 0.0 | 8.3 | 33.3 | 12.5 | 12.5 | 8.3 | 12.5 | 0.0 | 8.3 | 4.2 | 0.0 |
| Built-up | 0.8 | 1.9 | 17.3 | 35.1 | 16.4 | 9.6 | 6.6 | 4.3 | 2.7 | 2.3 | 1.8 | 1.2 |
| NoData | 0.8 | 2.4 | 17.7 | 24.2 | 22.6 | 8.9 | 9.7 | 4.8 | 1.6 | 5.6 | 1.6 | 0.0 |
| BH | Jan | Feb | Mar | Apr | May | Jun | Jul | Aug | Sep | Oct | Nov | Dec |
|---|---|---|---|---|---|---|---|---|---|---|---|---|
| Bogs & peatlands | 0.5 | 2.8 | 27.7 | 43.2 | 15.5 | 6.6 | 2.3 | 0.9 | 0.5 | 0.0 | 0.0 | 0.0 |
| Shrubland | 0.0 | 2.3 | 25.4 | 41.8 | 16.6 | 7.8 | 4.0 | 0.8 | 0.5 | 0.3 | 0.5 | 0.0 |
| Montane | 0.0 | 0.0 | 0.0 | 0.0 | 100.0 | 0.0 | 0.0 | 0.0 | 0.0 | 0.0 | 0.0 | 0.0 |
| Cliffs | 0.0 | 0.0 | 100.0 | 0.0 | 0.0 | 0.0 | 0.0 | 0.0 | 0.0 | 0.0 | 0.0 | 0.0 |
| Grasslands | 1.7 | 1.7 | 20.2 | 40.8 | 24.0 | 3.9 | 5.2 | 0.9 | 0.9 | 0.9 | 0.0 | 0.0 |
| Improved grass | 0.4 | 4.0 | 25.9 | 42.9 | 18.6 | 4.5 | 2.8 | 0.0 | 0.0 | 0.8 | 0.0 | 0.0 |
| Broadleaves | 0.0 | 1.6 | 9.7 | 43.5 | 29.0 | 12.9 | 3.2 | 0.0 | 0.0 | 0.0 | 0.0 | 0.0 |
| Mixed woodland | 0.0 | 0.0 | 8.8 | 35.3 | 32.4 | 8.8 | 11.8 | 2.9 | 0.0 | 0.0 | 0.0 | 0.0 |
| Conifers | 0.0 | 1.8 | 7.3 | 24.8 | 30.3 | 16.5 | 13.8 | 0.0 | 5.5 | 0.0 | 0.0 | 0.0 |
| Arable | 0.0 | 0.0 | 33.3 | 0.0 | 33.3 | 0.0 | 33.3 | 0.0 | 0.0 | 0.0 | 0.0 | 0.0 |
| Freshwater | 0.0 | 0.0 | 50.0 | 50.0 | 0.0 | 0.0 | 0.0 | 0.0 | 0.0 | 0.0 | 0.0 | 0.0 |
| Built-up | 0.0 | 0.0 | 23.1 | 38.5 | 7.7 | 15.4 | 7.7 | 0.0 | 0.0 | 7.7 | 0.0 | 0.0 |
| No Data | 0.0 | 0.0 | 10.0 | 40.0 | 30.0 | 10.0 | 0.0 | 0.0 | 0.0 | 0.0 | 10.0 | 0.0 |
5.2.2.3 Daily
Tables 5.11 and 5.12 give the daily total counts for the 2009-2020 period of wildfires from the full dataset per Broad Habitats (BH) classified from Level 3 Property Types and LCS88 classes, respectively, while Tables 5.12 and 5.13 give the same information as above for bigger wildfires with damage area greater than 1,000 m2 per. Data for the full wildfire dataset show that more wildfires occurred during weekends (1,641 on Saturdays and 1,517 on Sundays) and on Mondays (1,472), compared to the rest of the weekdays which had a similar number of recorded wildfires (1,256 – 1,311). However, there does not seem to be a strong pattern regarding fuel type composition in relation to the day of wildfire occurrence. Using both BH classifications for wildfires from the full dataset, there is an indication that wildfires on woodlands are generally more frequent during weekends, and this also applies for bogs and peatlands, shrublands and grasslands, but to a smaller extent. But overall, 60% to 70% of wildfires for the main fuel types (bogs, shrublands, grasslands and woodlands) occurred during weekdays, so there is no strong indication of an increased ignition risk during weekends due to, for example, recreational effects.
| BH | Monday | Tuesday | Wednesday | Thursday | Friday | Saturday | Sunday |
|---|---|---|---|---|---|---|---|
| Shrubland | 428 | 375 | 366 | 359 | 349 | 430 | 383 |
| Grasslands | 552 | 477 | 470 | 449 | 468 | 585 | 561 |
| Broadleaves | 165 | 134 | 157 | 153 | 176 | 189 | 192 |
| Conifers | 68 | 62 | 50 | 48 | 80 | 90 | 95 |
| Arable | 19 | 9 | 16 | 11 | 14 | 12 | 22 |
| Freshwater | 1 | 1 | 2 | 2 | 2 | 5 | 1 |
| Linear features | 69 | 48 | 43 | 53 | 53 | 84 | 75 |
| Built-up | 15 | 7 | 6 | 12 | 4 | 13 | 13 |
| Refuse | 108 | 99 | 103 | 106 | 107 | 151 | 113 |
| Other | 47 | 44 | 56 | 66 | 58 | 81 | 62 |
| None | 0 | 0 | 0 | 0 | 0 | 1 | 0 |
| Sum | 1,472 | 1,256 | 1,269 | 1,259 | 1,311 | 1,641 | 1,517 |
| BH | Monday | Tuesday | Wednesday | Thursday | Friday | Saturday | Sunday |
|---|---|---|---|---|---|---|---|
| Bogs & peatlands | 115 | 87 | 76 | 64 | 66 | 104 | 92 |
| Shrubland | 165 | 141 | 130 | 129 | 144 | 149 | 115 |
| Montane | 0 | 1 | 1 | 0 | 0 | 0 | 1 |
| Cliffs | 1 | 0 | 0 | 0 | 4 | 1 | 0 |
| Grasslands | 297 | 288 | 252 | 259 | 250 | 329 | 331 |
| Improved grass | 361 | 271 | 283 | 312 | 289 | 388 | 284 |
| Broadleaves | 53 | 45 | 68 | 51 | 56 | 67 | 77 |
| Mixed woodland | 143 | 112 | 128 | 131 | 116 | 175 | 145 |
| Conifers | 206 | 179 | 189 | 184 | 240 | 267 | 284 |
| Arable | 41 | 40 | 59 | 42 | 66 | 65 | 55 |
| Freshwater | 0 | 7 | 4 | 4 | 4 | 1 | 4 |
| Built-up | 76 | 66 | 63 | 66 | 61 | 81 | 100 |
| NoData | 14 | 19 | 16 | 17 | 15 | 14 | 29 |
| Count | 1,472 | 1,256 | 1,269 | 1,259 | 1,311 | 1,641 | 1,517 |
Results from the subset of bigger wildfires show a different picture than those from the full dataset, as more bigger wildfires occurred on Mondays (248) compared to weekends (205 on Saturdays and 153 on Sundays), while fire incident numbers ranged from 168 to 203 for the rest of the weekdays (Tables 5.13 and 5.14). Looking at results using BHs based on Level 3 Property types (Table 5.13), there does not seem to be a strong pattern regarding fuel type composition in relation to the day of wildfire occurrence. Using BHs classified using LCS88 classes, there is an indication that wildfires on bogs and peatlands and on conifer forests are slightly more frequent during weekends than compared to wildfires on heath and on grass, but overall and for both BH classifications 63% to 77% of bigger wildfires for the main fuel types (bogs, shrublands, grasslands and woodlands) occurred during weekdays.
| BH | Monday | Tuesday | Wednesday | Thursday | Friday | Saturday | Sunday |
|---|---|---|---|---|---|---|---|
| Shrubland | 172 | 135 | 127 | 111 | 99 | 120 | 89 |
| Grasslands | 49 | 53 | 34 | 38 | 43 | 58 | 42 |
| Broadleaves | 12 | 3 | 3 | 6 | 10 | 8 | 6 |
| Conifers | 12 | 8 | 9 | 12 | 11 | 17 | 14 |
| Arable | 1 | 1 | 0 | 0 | 0 | 0 | 1 |
| Linear features | 1 | 2 | 1 | 3 | 1 | 1 | 0 |
| Refuse | 0 | 1 | 0 | 1 | 2 | 1 | 0 |
| Other | 1 | 0 | 0 | 3 | 2 | 0 | 1 |
| Sum | 248 | 203 | 174 | 174 | 168 | 205 | 153 |
| BH | Monday | Tuesday | Wednesday | Thursday | Friday | Saturday | Sunday |
|---|---|---|---|---|---|---|---|
| Bogs & peatlands | 33 | 37 | 26 | 20 | 23 | 42 | 32 |
| Shrubland | 81 | 57 | 56 | 55 | 58 | 53 | 37 |
| Montane | 0 | 0 | 1 | 0 | 0 | 0 | 0 |
| Cliffs | 0 | 0 | 0 | 0 | 0 | 1 | 0 |
| Grasslands | 46 | 37 | 24 | 37 | 21 | 43 | 25 |
| Improved grass | 50 | 45 | 37 | 30 | 26 | 39 | 20 |
| Broadleaves | 8 | 8 | 14 | 7 | 9 | 6 | 10 |
| Mixed woodland | 11 | 0 | 4 | 8 | 5 | 1 | 5 |
| Conifers | 18 | 13 | 11 | 14 | 19 | 17 | 17 |
| Arable | 0 | 1 | 1 | 0 | 1 | 0 | 0 |
| Freshwater | 0 | 2 | 0 | 0 | 0 | 0 | 0 |
| Built-up | 1 | 1 | 0 | 3 | 2 | 3 | 3 |
| No Data | 0 | 2 | 0 | 0 | 4 | 0 | 4 |
| Sum | 248 | 203 | 174 | 174 | 168 | 205 | 153 |
5.2.3 Ignition motives
Based on IRS recorded information on ignition motives, most wildfires in the full dataset were caused by a deliberate ignition (n=5,560) compared to an accidental ignition (n=2,506) and unknown motive (n=1,659). On the other hand, most of the bigger wildfires were caused by accidental ignitions (n=615), followed by an unknown ignition motive (n=441) and deliberate ignitions (n=269).
Regarding temporal patterns, the proportions of wildfires for each ignition motive type recorded in the IRS (accidental, deliberate, and not known) appear to be quite similar for each day for both the full wildfire dataset (Table 5.15) and the subset of bigger wildfires (Table 5.16). Accidental wildfires from the full dataset accounted for 23% to 29% of daily fire incidents, while deliberate wildfires accounted for 55% to 60% of daily wildfires.
On the other hand, for bigger wildfires, accidental fire incidents were the most frequent for all days and accounted for 42% to 51% of daily fire incidents, while deliberate wildfires accounted for 17% to 24% of daily wildfires. Therefore, there does not seem to be a clear indication of an emerging daily pattern regarding the different motive types for wildfire ignition for both the full wildfire dataset and the subset of bigger wildfires.
| Motive | Monday | Tuesday | Wednesday | Thursday | Friday | Saturday | Sunday |
|---|---|---|---|---|---|---|---|
| Accidental | 387 (26%) | 353 (28%) | 329 (26%) | 312 (25%) | 374 (29%) | 396 (24%) | 355 (23%) |
| Deliberate | 823 (56%) | 685 (55%) | 741 (58%) | 731 (58%) | 723 (55%) | 950 (58%) | 907 (60%) |
| Not known | 262 (18%) | 218 (17%) | 199 (16%) | 216 (17%) | 214 (16%) | 295 (18%) | 255 (17%) |
| Sum | 1,472 | 1,256 | 1,269 | 1,259 | 1,311 | 1,641 | 1,517 |
| Motive | Monday | Tuesday | Wednesday | Thursday | Friday | Saturday | Sunday |
|---|---|---|---|---|---|---|---|
| Accidental | 113 (46%) | 99 (49%) | 85 (49%) | 73 (42%) | 86 (51%) | 89 (43%) | 70 (46%) |
| Deliberate | 54 (22%) | 35 (17%) | 31 (18%) | 41 (24%) | 31 (18%) | 46 (22%) | 31 (20%) |
| Not known | 81 (33%) | 69 (34%) | 58 (33%) | 60 (34%) | 51 (30%) | 70 (34%) | 52 (34%) |
| Sum | 248 | 203 | 174 | 174 | 168 | 205 | 153 |
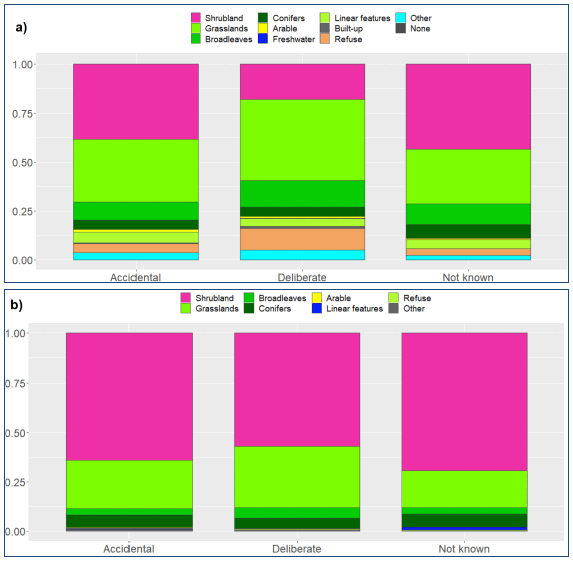
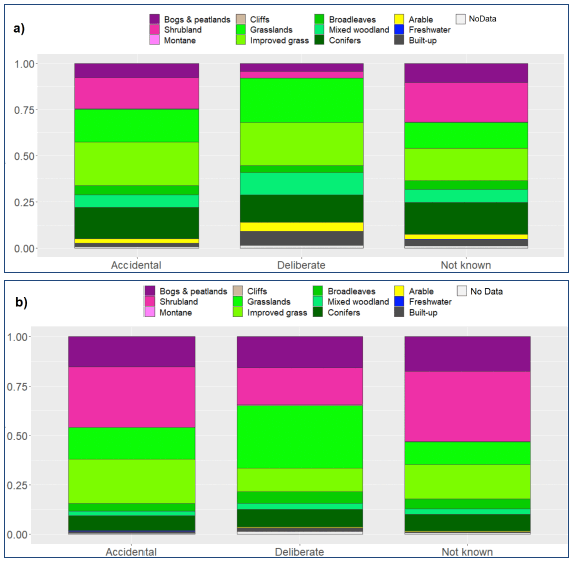
However, there are indications of patterns related to fuel type composition and ignition motive types. In particular, a greater proportion of wildfires from the full dataset on bogs and peatlands and shrublands was caused by accidental ignitions compared to deliberate ignitions (Tables 5.7a and 5.8a). On the other hand, deliberate ignitions were more frequent for seminatural and improved grasslands than accidental ones. At the same time, most of the wildfires with an unknown motive of ignition occurred on shrublands based on BHs classified using the Level 3 Property Types (Figure 5.7a). However, looking at BHs classified using the LCS88 classes (Figure 5.7b) shows that roughly the same numbers of fires on bogs and peatlands and shrublands and fires on grasslands (seminatural and improved) had an unknown ignition motive. In addition, most wildfires on loose refuse and wasteland had a deliberate ignition motive.
Similarly, looking at BHs of bigger wildfires based on Level 3 Property types, a greater proportion of shrubland fires had an accidental ignition motive than a deliberate one, while most of the wildfires with an unknown motive of ignition occurred on shrublands (Figure 5.7b). A clearer pattern emerges when looking at BHs based on LCS88 classes (Figure 5.8b); it is evident that more bigger wildfires on bogs and peatlands and on heathland/shrubland were caused by accidental than deliberate ignitions, while wildfires on grassland accounted for most fire incidents with deliberate ignitions.
Overall, these results indicate that wildfires on more remote or less accessible seminatural habitats, such as peatlands and heathlands, are more likely to be caused by accidental ignitions, compared to wildfires occurring in more accessible and/or managed land where they are more likely to be caused by deliberate ignitions.
In addition, we investigated patterns of causes of ignition, ignition sources, first items ignited and items causing spread in relation to ignition motive (Tables 5.17-5.24). This information was available for 919 wildfire incidents from the full dataset and 232 fire incidents from the subset of bigger wildfires. Regarding the cause of ignition, bringing together a heat source and combustibles was almost exclusively the cause of deliberate ignitions (>90%), for all fire incidents irrespective of damage area size (Tables 5.17 and 5.18). On the other hand, most accidental wildfires were caused by bonfires or some other form of intentional burn that got out of control; 24% and 27% of wildfires from the full dataset and 26% and 33% of the bigger wildfires, respectively. Regarding wildfires of unknown motive, most had an ignition cause of "Other", followed by overheating of unknown cause and some form of intentional burn that got out of control (Tables 5.17
and 5.18).
There was limited information to extract regarding ignition sources, since an unknown ignition source was recorded for most fire incidents from the full dataset and the subset of bigger wildfires, regardless of ignition motive (Tables 5.19 and 5.20). Other recorded ignition sources included match and candles, naked flame and smoking-related ignitions, that each accounted from 12%-24% of wildfires from the full dataset and 9% to 19% of the bigger wildfires. Interestingly, 3%-4% of wildfires (from the subset and full dataset, respectively) were attributed to natural occurrence; however no further information was provided for those fire incidents.
Vegetation was recorded as the item or material first ignited for 709 of the 919 wildfires from the full dataset and 204 of the 232 bigger wildfires (Tables 5.21 and 5.22). Looking at the main types of vegetation recorded (given in field "ItemFirstIgnitedSubtype") for the wildfires from the full dataset, there were 383 records for grassland, heath and scrub, 199 records for trees, 49 records for leaves and 34 records for straw/stubble, while grassland, heath and scrub dominated the subset of bigger wildfires (178 records), followed by 20 records for trees. More wildfires from the full dataset with grass, heath or scrub as the recorded vegetation type of ignition were caused by an accident (153 records) than by deliberate action (125 records) or unknown motive (105 records), whilst most wildfires with trees and straw/stubble as recorded ignition materials were caused by deliberate action (118 and 21 records, respectively) than by accident (35 and 9 records, respectively). On the other hand for bigger wildfires, accidental ignitions greatly outnumbered deliberate ignitions for fire incidents with grass, heath or scrub as the recorded vegetation type of ignition (94 records for accidental ignitions compared to 23 records for deliberate ignitions).
Vegetation was also recorded as the most frequent item or material causing fire spread for 731 of the 919 wildfires from the full dataset and 222 of the 232 bigger wildfires (Tables 5.23 and 5.24). Again, investigating the main types of vegetation recorded (given in field "ItemCausingSpreadSubtype") for the wildfires from the full dataset showed that there were 404 records for grassland, heath and scrub, 209 records for trees and 33 records for straw/stubble, while grassland, heath and scrub dominated the subset of bigger wildfires (192 records), followed by 25 records for trees. Looking different vegetation types causing spread in relation to ignition motives revealed the same patters as in the case of items causing ignition. More wildfires from the full dataset with grass, heath or scrub as the recorded vegetation type causing spread had an accidental ignition motive (162 records) compared to a deliberate motive (127 records) or unknown motive (115 records), whilst most wildfires with trees and straw/stubble as recorded materials responsible for fire spread were caused by deliberate action (127 and 23 records, respectively) than by accident (37 and 7 records, respectively). As expected for bigger wildfires, accidental ignitions greatly outnumbered deliberate ignitions for fire incidents with grass, heath or scrub as the recorded vegetation type of ignition (101 records for accidental ignitions compared to 64 records for deliberate ignitions).
Although results given in Tables 5.17 to 5.24 are based on the analysis of a limited number of wildfire incidents, they give a clear indication that types of seminatural vegetation (grass, heath, scrub) are more likely to be responsible for ignition and fire spread in fires caused by accident, especially in the bigger wildfires where almost all records had grass, heath, and scrub as the vegetation types responsible for ignition and fire spread. On the other hand, trees and to a lesser degree straw/stubble are more likely to be the most frequent vegetation type responsible for ignition and fire spread in, mainly smaller and less trivial, fires caused by deliberate ignitions.
| Motive | Sum | Accumulation flammable material | Bonfire out of control | Careless handling- careless disposal | Combustible articles close to heat source | Coo king | Faulty fuel supplies- Gas/ Electricity/ Petrol | Heat source + combustibles brought together | Natural occurrence | Negligent use of equipment | Other | Other intentional burn, out of control | Over heating, unknown cause | Playing with fire (or heat source) |
|---|---|---|---|---|---|---|---|---|---|---|---|---|---|---|
| Accidental | 248 | 2 | 24 | 13 | 3 | 1 | 0 | 0 | 6 | 3 | 14 | 27 | 5 | 2 |
| Deliberate | 454 | 0 | 0 | 0 | 0 | 0 | 0 | 96 | 0 | 0 | 4 | 0 | 0 | 0 |
| Not known | 217 | 3 | 7 | 2 | 6 | 1 | 0 | 0 | 11 | 0 | 35 | 15 | 17 | 3 |
| Motive | Sum | Accumulation flammable material | Bonfire out of control | Careless handling- careless disposal | Combustible articles close to heat source | Coo king | Faulty fuel supplies- Gas/ Electricity/ Petrol | Heat source + combustibles brought together | Natural occurrence | Negligent use of equipment | Other | Other intentional burn, out of control | Over heating unknown cause | Playing with fire (or heat source) |
|---|---|---|---|---|---|---|---|---|---|---|---|---|---|---|
| Accidental | 117 | 1 | 26 | 11 | 3 | 1 | 1 | 0 | 4 | 1 | 15 | 33 | 4 | 0 |
| Deliberate | 37 | 0 | 0 | 0 | 0 | 0 | 0 | 92 | 0 | 0 | 8 | 0 | 0 | 0 |
| Not known | 78 | 0 | 4 | 1 | 5 | 3 | 0 | 0 | 9 | 0 | 41 | 15 | 21 | 1 |
| Motive | Sum | Bombs and explosives | Cooking appliance | Electricity supply | Fuel/ chemical related | Industrial Equipment | Matches and candles | Naked flame | Natural Occurrence | Not known | Other | Smoking Related | Spread from secondary fire | Vehicles only | Wet hay |
|---|---|---|---|---|---|---|---|---|---|---|---|---|---|---|---|
| Accidental | 250 | 2 | 5 | 1 | 0 | 0 | 14 | 12 | 4 | 29 | 8 | 12 | 10 | 2 | 1 |
| Deliberate | 456 | 0 | 0 | 0 | 2 | 0 | 26 | 18 | 0 | 40 | 0 | 14 | 0 | 0 | 0 |
| Not known | 221 | 0 | 1 | 0 | 0 | 0 | 8 | 2 | 5 | 77 | 4 | 3 | 0 | 0 | 0 |
| Motive | Sum | Bombs and explosives | Cooking appliance | Electricity supply | Industrial equipment | Matches and candles | Naked flame | Natural occurrence | Not known | Other | Smoking Related | Spread from secondary fire | Vehicles only |
|---|---|---|---|---|---|---|---|---|---|---|---|---|---|
| Accidental | 118 | 4 | 2 | 1 | 2 | 19 | 13 | 3 | 32 | 10 | 9 | 5 | 0 |
| Deliberate | 38 | 0 | 0 | 0 | 0 | 29 | 26 | 0 | 42 | 0 | 3 | 0 | 0 |
| Not known | 78 | 0 | 4 | 0 | 0 | 5 | 1 | 3 | 79 | 3 | 4 | 0 | 1 |
| Motive | Sum | None | Not known | Other | Paper/Cardboard | Rubbish/Waste/Recycling | Vegetation | Wood |
|---|---|---|---|---|---|---|---|---|
| Accidental | 250 | 2 | 7 | 1 | 0 | 2 | 86 | 2 |
| Deliberate | 456 | 3 | 14 | 0 | 5 | 4 | 70 | 4 |
| Not known | 221 | 1 | 16 | 0 | 0 | 0 | 79 | 4 |
| Motive | Sum | Not known | Other | Paper/Cardboard | Rubbish/Waste/Recycling | Vegetation | Wood |
|---|---|---|---|---|---|---|---|
| Accidental | 118 | 8 | 1 | 0 | 3 | 87 | 1 |
| Deliberate | 38 | 11 | 0 | 3 | 0 | 86 | 0 |
| Not known | 78 | 13 | 0 | 0 | 1 | 86 | 0 |
| Motive | Sum | Foam, rubber, plastic | None | Not known | Other | Paper/ Cardboard | Rubbish/ Waste/Recycling | Vegetation | Wood |
|---|---|---|---|---|---|---|---|---|---|
| Accidental | 250 | 0 | 6 | 2 | 2 | 0 | 0 | 89 | 1 |
| Deliberate | 456 | 1 | 12 | 6 | 0 | 1 | 2 | 72 | 6 |
| Not known | 221 | 0 | 9 | 6 | 0 | 0 | 0 | 83 | 2 |
| Motive | Sum | None | Not known | Vegetation |
|---|---|---|---|---|
| Accidental | 118 | 2 | 3 | 95 |
| Deliberate | 38 | 3 | 5 | 92 |
| Not known | 78 | 1 | 3 | 96 |
5.2.4 Burnt area size
The purpose of this analysis was to investigate patterns of burnt area size related to fuel type composition, i.e., investigate whether certain fuel types cause more burnt areas and greater wildfires than others. For this reason, we aggregated the thirteen (13) classes of the Outdoor Damage Area field recorded in the IRS (see Section 2) into four (4) classes:
a) None: Wildfires with no burn area estimates
b) DA0_100: Wildfires with burnt areas of 0-100 m2;
c) DA0100_1000: Wildfires with burnt areas of 100-1,000 m2; and
d) DA>1000: Wildfires with burnt areas >1,000 m2 (this is the same as the subset of bigger wildfires described in previous Sections).
Overall, most wildfires (67%) were small wildfires with estimated burnt areas less than 100 m2, while wildfires of moderate size (100 – 1,000 m2) and bigger wildfires (>1,000 m2) accounted for 15% and 14% of all wildfires, respectively. Regarding fuel types, wildfires in almost all Broad Habitats (BH) are small with estimated burnt areas less than 100 m2, with the clear exception of bogs and peatlands and shrubland. Based on Broad Habitats BHs classified from IRS Level 3 Property Types, small wildfires with less than 100 m2 burnt areas accounted for around 60% to 90% of all wildfires for each BH, with small wildfires being the most frequent for shrubland (43%) but to a smaller extent compared to the other BHs, while bigger wildfires accounted for 32% of shrubland wildfires (Table 5.25 and Figure 5.9a).
| BH | None | DA0_100 | DA100_1000 | DA>1000 |
|---|---|---|---|---|
| Shrubland | 57 | 1158 | 622 | 853 |
| Grasslands | 145 | 2522 | 578 | 317 |
| Broadleaves | 49 | 971 | 98 | 48 |
| Conifers | 11 | 329 | 70 | 83 |
| Arable | 7 | 86 | 7 | 3 |
| Freshwater | 1 | 13 | 0 | 0 |
| Linear features | 25 | 355 | 36 | 9 |
| Built-up | 10 | 57 | 3 | 0 |
| Refuse | 83 | 681 | 18 | 5 |
| Other | 67 | 320 | 20 | 7 |
| None | 0 | 1 | 0 | 0 |
Regarding wildfire BHs classified from LCS88 classes, bigger wildfires (burnt area >1,000 m2) accounted for 35% of wildfires on bogs and peatlands and 41% of shrubland wildfires, compared to small wildfires (burnt area <100 m2) that accounted for 41% and 34% of all wildfires, respectively (Table 5.26 and Figure 5.9b). Bigger wildfires accounted for only 11%-12% of wildfires on seminatural and improved grasslands, while most broadleaved, mixed and conifer woodland fires were small wildfires (68%, 82% and 77%, respectively).
| BH | None | DA0_100 | DA100_1000 | DA>1000 |
|---|---|---|---|---|
| Bogs & peatlands | 16 | 248 | 127 | 213 |
| Shrubland | 22 | 329 | 225 | 397 |
| Montane | 0 | 1 | 1 | 1 |
| Cliffs | 1 | 1 | 3 | 1 |
| Grasslands | 80 | 1321 | 372 | 233 |
| Improved grass | 140 | 1504 | 297 | 247 |
| Broadleaves | 25 | 282 | 48 | 62 |
| Mixed woodland | 51 | 780 | 85 | 34 |
| Conifers | 64 | 1188 | 188 | 109 |
| Arable | 16 | 311 | 38 | 3 |
| Freshwater | 2 | 14 | 6 | 2 |
| Built-up | 32 | 427 | 41 | 13 |
| No Data | 6 | 87 | 21 | 10 |
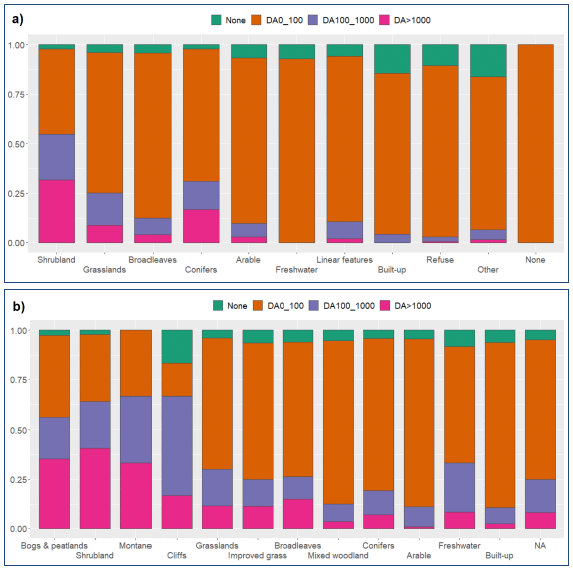
Overall, these results indicate that wildfires on peatlands and heathlands tend to be larger in burnt area size and cause greater damage (based on recorded damage area estimates) than wildfires in other seminatural vegetation such as grasslands and woodlands, which are more likely to be small fires causing limited damage.
5.2.5 Urban-Rural classification
Accessibility and population density and proximity to populated areas are established factors influencing wildfire ignitions and wildfire risk. For this reason, we used the 8-fold Scottish Government Urban Rural (UR) Classification (Table 5.27) to investigate, in an integrated way, patterns of wildfire occurrence related to accessibility and population numbers.
| UR Folds | Description | UR Folds | Description |
|---|---|---|---|
| Fold01 | Large Urban Areas | Fold05 | Very Remote Small Towns |
| Fold02 | Other Urban Areas | Fold06 | Accessible Rural |
| Fold03 | Accessible Small Towns | Fold07 | Remote Rural |
| Fold04 | Remote Small Towns | Fold08 | Very Remote Rural |
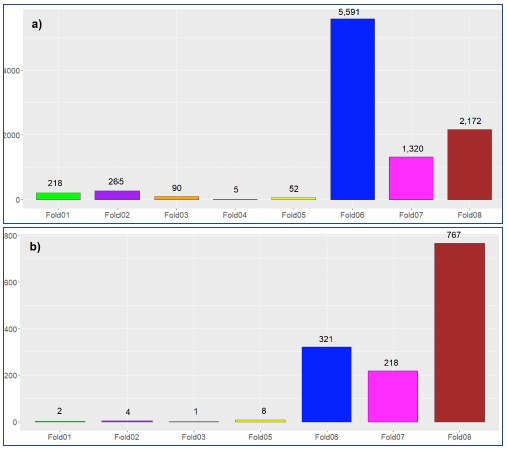
Figure 5.10a shows that most IRS wildfires occurred within accessible rural areas (57%), followed by wildfires in very remote rural areas (22%) and in remote rural areas (14%). Only 5% of wildfires occurred within large urban and other urban areas (477 wildfire incidents in total). In contrast, most of the 1,325 bigger wildfires occurred in very remote rural areas (58%) and then in accessible rural areas (24%) and remote rural areas (15%), while only six (6) bigger wildfires were recorded in urban areas (Folds 1 and 2) and just nine (9) wildfires in small towns (one (1) in accessible small towns and eight (8) in very remote small towns) (Figure 5.10b).
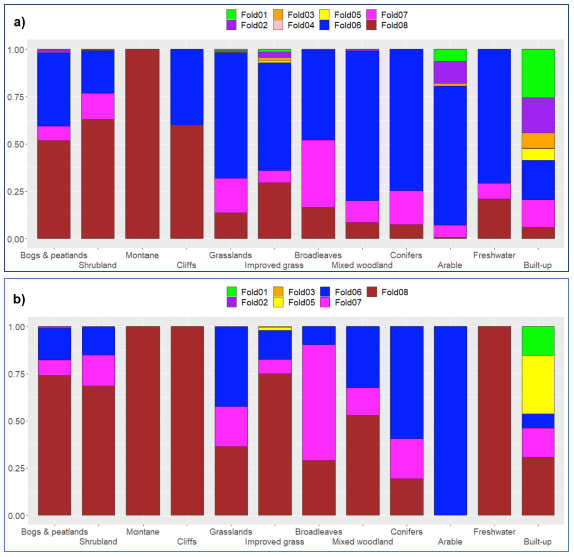
Regarding fuel type composition, most grassland and woodland wildfires occurred in accessible rural areas for Broad Habitats (BH) classified from both the IRS Level 3 Property Types (Figure 5.11a) and LCS88 classes (Figure 5.12a). However, most wildfires on bogs and peatlands and heathlands/shrubland occurred in very remote rural areas, which shows a clear indication that these wildfires that tend to be larger in burnt area size and of accidental motive are more likely to occur in areas with very low population density and with very limited accessibility.
This is further supported when looking at the subset of bigger wildfires, where a greater proportion of wildfires on bogs and peatlands and on heathlands occurred in very remote areas compared to when all wildfires where investigated (Figures 5.11b and 5.12b). In addition, a greater proportion of bigger grassland wildfires occurred in very remote areas than accessible rural areas when BHs based on Level 3 Property types were used (Figure 11b); this is also true for bigger wildfires on managed or improved grasslands using BHs based on LCS88 classes (Figure 12b).
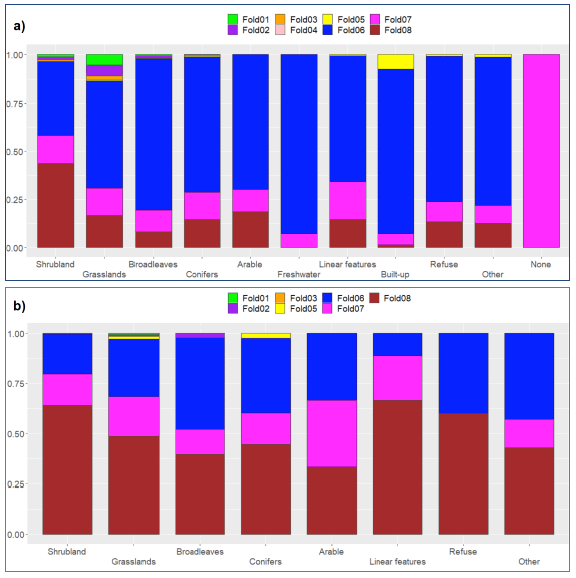
Looking at bigger woodland fires based on LCS88 classes (Figure 12b), it is evident that most wildfires on broadleaf woodlands occurred in remote rural areas (61%) with only 10% of wildfires on broadleaves occurring in accessible rural areas. On the other hand, most wildfires on mixed woodland occurred in very remote areas (53%) and in accessible rural areas (32%). Finally, most bigger conifer forest fires occurred in accessible rural areas, with an almost even number of conifer forest fires occurring in remote and very remote rural areas (21% and 19%, respectively). These results indicate that bigger wildfires on broadleaves and mixed woodland are more likely to occur in remote and very remote rural areas compared to wildfires of smaller damage area size on the same vegetation/fuel types that are more likely to occur in more accessible rural areas.
5.3 Patterns per Local Authorities
5.3.1 Overview
Wildfire data from both the full wildfire dataset and the subset of bigger wildfires are presented for each Local Authority (LA) using tables of the total count of wildfires per LA along with the proportions of those wildfire counts falling into the different time periods (years, months, days), fuel types, ignition motive types and burnt area sizes. Results at LA level are presented using tables because the large number of LAs made generated figures difficult to read and interpret (LA n=32 for the full wildfire dataset and n=31 for the bigger wildfires; no bigger wildfire incident recorded in East Renfrewshire).
5.3.2 Temporal - Seasonality
5.3.2.1 Annual
Most wildfires from the full dataset occurred in the Highland area (1,852), followed by the North Lanarkshire (690) and West Lothian (684) areas, while Clackmannanshire, Angus and East Renfrewshire areas had the least recorded wildfires (79, 54, 35 incidents, respectively) (Table 5.28). For most LAs, the greater annual number of wildfires within their areas occurred during the 2016 to 2020 period, but there was no clear indication of any trend of inter-annual wildfire occurrence.
| LA | Sum | 2009 | 2010 | 2011 | 2012 | 2013 | 2014 | 2015 | 2016 | 2017 | 2018 | 2019 | 2020 |
|---|---|---|---|---|---|---|---|---|---|---|---|---|---|
| Aberdeen City | 125 | 6 | 6 | 10 | 4 | 6 | 2 | 7 | 2 | 10 | 21 | 11 | 14 |
| Aberdeenshire | 281 | 5 | 6 | 9 | 5 | 10 | 6 | 9 | 5 | 9 | 11 | 11 | 16 |
| Angus | 54 | 7 | 7 | 11 | 2 | 7 | 7 | 6 | 6 | 13 | 7 | 9 | 17 |
| Argyll & Bute | 355 | 5 | 19 | 9 | 9 | 14 | 3 | 5 | 8 | 7 | 7 | 10 | 5 |
| Clackmannanshire | 79 | 9 | 8 | 3 | 8 | 11 | 9 | 17 | 3 | 24 | 6 | 0 | 4 |
| Dumfries & Galloway | 177 | 6 | 19 | 14 | 6 | 9 | 3 | 5 | 6 | 9 | 10 | 3 | 12 |
| Dundee City | 150 | 1 | 5 | 9 | 4 | 4 | 5 | 13 | 11 | 16 | 17 | 6 | 9 |
| East Ayrshire | 609 | 3 | 15 | 5 | 6 | 17 | 4 | 8 | 10 | 14 | 8 | 4 | 5 |
| East Dunbartonshire | 81 | 4 | 9 | 9 | 6 | 7 | 9 | 16 | 5 | 11 | 9 | 5 | 11 |
| East Lothian | 154 | 4 | 9 | 8 | 3 | 7 | 2 | 12 | 6 | 18 | 11 | 12 | 8 |
| East Renfrewshire | 35 | 3 | 3 | 3 | 17 | 26 | 3 | 3 | 11 | 11 | 6 | 9 | 6 |
| Edinburgh City | 200 | 10 | 13 | 7 | 7 | 13 | 6 | 10 | 7 | 6 | 12 | 5 | 8 |
| Falkirk | 357 | 5 | 15 | 6 | 3 | 9 | 9 | 6 | 13 | 12 | 9 | 3 | 10 |
| Fife | 414 | 13 | 12 | 7 | 6 | 9 | 5 | 10 | 8 | 7 | 13 | 4 | 8 |
| Glasgow City | 198 | 3 | 7 | 9 | 4 | 11 | 10 | 13 | 15 | 11 | 5 | 9 | 4 |
| Highland | 1852 | 7 | 10 | 8 | 9 | 15 | 7 | 5 | 5 | 8 | 12 | 9 | 7 |
| Inverclyde | 245 | 0 | 2 | 6 | 9 | 9 | 5 | 9 | 25 | 18 | 7 | 4 | 7 |
| Midlothian | 202 | 10 | 8 | 9 | 6 | 7 | 5 | 7 | 6 | 16 | 5 | 10 | 11 |
| Moray | 323 | 6 | 7 | 8 | 6 | 7 | 7 | 6 | 7 | 4 | 19 | 10 | 13 |
| Na h-Eileanan Siar | 644 | 3 | 7 | 6 | 15 | 23 | 6 | 5 | 6 | 6 | 14 | 5 | 5 |
| North Ayrshire | 187 | 2 | 6 | 6 | 10 | 9 | 4 | 8 | 9 | 17 | 16 | 10 | 5 |
| North Lanarkshire | 690 | 4 | 8 | 9 | 8 | 14 | 7 | 10 | 11 | 9 | 6 | 7 | 8 |
| Orkney Islands | 101 | 11 | 11 | 5 | 5 | 13 | 6 | 5 | 7 | 6 | 16 | 9 | 7 |
| Perth & Kinross | 182 | 9 | 13 | 6 | 7 | 9 | 9 | 7 | 10 | 13 | 9 | 4 | 7 |
| Renfrewshire | 195 | 4 | 3 | 9 | 7 | 10 | 7 | 11 | 14 | 14 | 9 | 3 | 10 |
| Scottish Borders | 257 | 7 | 15 | 11 | 4 | 7 | 6 | 6 | 4 | 16 | 8 | 8 | 8 |
| Shetland Islands | 83 | 6 | 18 | 6 | 6 | 8 | 4 | 5 | 4 | 6 | 21 | 2 | 15 |
| South Ayrshire | 87 | 2 | 17 | 8 | 9 | 5 | 8 | 6 | 6 | 8 | 16 | 3 | 12 |
| South Lanarkshire | 368 | 7 | 9 | 8 | 4 | 9 | 7 | 10 | 12 | 10 | 4 | 8 | 12 |
| Stirling | 211 | 10 | 13 | 7 | 3 | 5 | 3 | 7 | 6 | 11 | 13 | 7 | 17 |
| West Dunbartonshire | 145 | 2 | 8 | 8 | 2 | 21 | 8 | 8 | 12 | 13 | 6 | 4 | 6 |
| West Lothian | 684 | 6 | 16 | 6 | 7 | 9 | 6 | 6 | 6 | 9 | 11 | 8 | 11 |
Most bigger wildfires occurred in the Highland and Na h-Eileanan Siar areas (656 and 251 fire incidents, respectively) (Table 5.29). There is an indication that a greater proportion of bigger wildfires occurred in 2013 when most fire incidents were recorded for the Na h-Eileanan Siar (33%) and Highland (19%) LAs, which combined accounted for 208 of the 268 wildfires recorded in 2013.
| LA | Sum | 2009 | 2010 | 2011 | 2012 | 2013 | 2014 | 2015 | 2016 | 2017 | 2018 | 2019 | 2020 |
|---|---|---|---|---|---|---|---|---|---|---|---|---|---|
| Aberdeen City | 3 | 0 | 0 | 33 | 0 | 0 | 0 | 0 | 0 | 0 | 67 | 0 | 0 |
| Aberdeenshire | 27 | 4 | 4 | 7 | 15 | 19 | 11 | 0 | 4 | 7 | 11 | 7 | 11 |
| Angus | 4 | 0 | 0 | 0 | 0 | 0 | 0 | 0 | 0 | 25 | 0 | 50 | 25 |
| Argyll & Bute | 59 | 0 | 27 | 19 | 5 | 17 | 2 | 3 | 2 | 10 | 5 | 8 | 2 |
| Clackmannanshire | 7 | 0 | 14 | 14 | 14 | 0 | 0 | 43 | 0 | 15 | 0 | 0 | 0 |
| Dumfries & Galloway | 33 | 9 | 21 | 21 | 15 | 9 | 0 | 6 | 9 | 3 | 0 | 0 | 6 |
| Dundee City | 2 | 0 | 0 | 0 | 0 | 50 | 0 | 0 | 0 | 0 | 50 | 0 | 0 |
| East Ayrshire | 30 | 0 | 4 | 13 | 0 | 33 | 7 | 0 | 3 | 33 | 0 | 7 | 0 |
| East Dunbartonshire | 4 | 0 | 25 | 0 | 0 | 0 | 25 | 50 | 0 | 0 | 0 | 0 | 0 |
| East Lothian | 5 | 0 | 0 | 0 | 0 | 0 | 0 | 0 | 0 | 0 | 0 | 100 | 0 |
| Edinburgh City | 2 | 0 | 0 | 0 | 0 | 0 | 0 | 0 | 0 | 0 | 50 | 0 | 50 |
| Falkirk | 7 | 0 | 14 | 0 | 0 | 0 | 29 | 0 | 0 | 14 | 14 | 0 | 29 |
| Fife | 17 | 6 | 0 | 6 | 6 | 29 | 0 | 6 | 6 | 6 | 12 | 12 | 12 |
| Glasgow City | 2 | 0 | 0 | 50 | 0 | 0 | 0 | 0 | 0 | 0 | 0 | 50 | 0 |
| Highland | 656 | 9 | 10 | 8 | 9 | 19 | 6 | 3 | 4 | 9 | 10 | 10 | 3 |
| Inverclyde | 8 | 0 | 0 | 13 | 0 | 0 | 0 | 13 | 25 | 38 | 0 | 0 | 13 |
| Midlothian | 4 | 25 | 0 | 25 | 25 | 0 | 0 | 25 | 0 | 0 | 0 | 0 | 0 |
| Moray | 25 | 0 | 4 | 0 | 12 | 8 | 8 | 4 | 0 | 8 | 12 | 24 | 20 |
| Na h-Eileanan Siar | 251 | 4 | 7 | 6 | 11 | 33 | 5 | 4 | 4 | 5 | 13 | 7 | 1 |
| North Ayrshire | 2 | 0 | 0 | 0 | 0 | 0 | 0 | 0 | 0 | 0 | 100 | 0 | 0 |
| North Lanarkshire | 26 | 0 | 4 | 12 | 0 | 12 | 0 | 19 | 4 | 23 | 8 | 4 | 15 |
| Orkney Islands | 11 | 9 | 27 | 0 | 0 | 45 | 0 | 0 | 9 | 0 | 9 | 0 | 0 |
| Perth & Kinross | 13 | 8 | 23 | 8 | 15 | 15 | 8 | 0 | 8 | 15 | 0 | 0 | 0 |
| Renfrewshire | 3 | 0 | 0 | 0 | 0 | 0 | 0 | 0 | 67 | 33 | 0 | 0 | 0 |
| Scottish Borders | 22 | 9 | 23 | 23 | 9 | 5 | 0 | 0 | 0 | 5 | 14 | 14 | 0 |
| Shetland Islands | 11 | 0 | 9 | 9 | 0 | 45 | 0 | 0 | 9 | 9 | 18 | 0 | 0 |
| South Ayrshire | 7 | 0 | 14 | 14 | 14 | 0 | 0 | 0 | 0 | 14 | 14 | 0 | 29 |
| South Lanarkshire | 16 | 0 | 13 | 6 | 6 | 6 | 6 | 13 | 13 | 6 | 0 | 13 | 19 |
| Stirling | 15 | 13 | 13 | 7 | 0 | 7 | 13 | 20 | 0 | 20 | 0 | 0 | 7 |
| West Dunbartonshire | 14 | 0 | 0 | 14 | 0 | 14 | 14 | 0 | 29 | 21 | 0 | 7 | 0 |
| West Lothian | 39 | 13 | 8 | 5 | 10 | 10 | 10 | 15 | 10 | 5 | 5 | 0 | 8 |
5.3.2.2 Monthly
The greater monthly counts of wildfires for the 2009-2020 period and for all LAs were recorded in one of the spring months, with the only exception of Moray where more wildfires were recorded for July than in other months (Table 5.30). April was the month with the most recorded wildfires for most LAs, followed by May. Overall, spring wildfires outnumbered summer wildfires in all LAs, apart from in the Moray and Falkirk areas, while an almost equal number of spring and summer wildfires was recorded in the Shetlands Islands.
| LA | Sum | Jan | Feb | Mar | Apr | May | Jun | Jul | Aug | Sept | Oct | Nov | Dec |
|---|---|---|---|---|---|---|---|---|---|---|---|---|---|
| Aberdeen City | 125 | 5 | 7 | 6 | 12 | 18 | 12 | 14 | 6 | 12 | 2 | 4 | 1 |
| Aberdeenshire | 281 | 2 | 2 | 13 | 20 | 17 | 10 | 12 | 9 | 9 | 3 | 2 | 2 |
| Angus | 54 | 2 | 6 | 11 | 7 | 26 | 9 | 6 | 9 | 6 | 2 | 13 | 4 |
| Argyll & Bute | 355 | 1 | 2 | 17 | 34 | 25 | 8 | 7 | 1 | 2 | 1 | 1 | 1 |
| Clackmannanshire | 79 | 0 | 3 | 8 | 22 | 29 | 8 | 13 | 8 | 11 | 0 | 0 | 0 |
| Dumfries & Galloway | 177 | 1 | 2 | 14 | 31 | 22 | 10 | 6 | 4 | 2 | 5 | 2 | 2 |
| Dundee City | 150 | 3 | 2 | 25 | 27 | 17 | 13 | 7 | 1 | 1 | 3 | 0 | 1 |
| East Ayrshire | 609 | 1 | 1 | 18 | 39 | 18 | 7 | 6 | 2 | 2 | 1 | 2 | 1 |
| East Dunbartonshire | 81 | 4 | 1 | 9 | 33 | 23 | 7 | 7 | 2 | 4 | 2 | 5 | 1 |
| East Lothian | 154 | 6 | 6 | 8 | 23 | 17 | 14 | 10 | 3 | 2 | 5 | 1 | 4 |
| East Renfrewshire | 35 | 0 | 3 | 11 | 26 | 34 | 6 | 9 | 0 | 0 | 6 | 3 | 3 |
| Edinburgh City | 200 | 0 | 4 | 8 | 22 | 16 | 9 | 22 | 4 | 7 | 5 | 4 | 3 |
| Falkirk | 357 | 1 | 1 | 6 | 18 | 19 | 18 | 16 | 9 | 6 | 4 | 2 | 0 |
| Fife | 414 | 1 | 2 | 8 | 23 | 16 | 17 | 15 | 6 | 5 | 5 | 2 | 0 |
| Glasgow City | 198 | 1 | 2 | 17 | 46 | 17 | 5 | 4 | 2 | 4 | 2 | 2 | 0 |
| Highland | 1852 | 1 | 2 | 17 | 33 | 17 | 10 | 10 | 4 | 3 | 2 | 1 | 0 |
| Inverclyde | 245 | 0 | 0 | 16 | 34 | 31 | 11 | 4 | 0 | 1 | 1 | 1 | 0 |
| Midlothian | 202 | 2 | 3 | 10 | 23 | 24 | 7 | 8 | 4 | 10 | 2 | 3 | 1 |
| Moray | 323 | 1 | 2 | 5 | 16 | 14 | 14 | 22 | 8 | 11 | 5 | 2 | 1 |
| Na h-Eileanan Siar | 644 | 1 | 3 | 30 | 30 | 13 | 10 | 6 | 2 | 1 | 1 | 2 | 0 |
| North Ayrshire | 187 | 1 | 4 | 9 | 25 | 22 | 11 | 14 | 6 | 3 | 2 | 3 | 1 |
| North Lanarkshire | 690 | 1 | 2 | 20 | 37 | 19 | 7 | 7 | 2 | 2 | 2 | 1 | 1 |
| Orkney Islands | 101 | 1 | 2 | 13 | 26 | 20 | 6 | 10 | 8 | 2 | 4 | 5 | 4 |
| Perth & Kinross | 182 | 2 | 3 | 8 | 27 | 21 | 13 | 10 | 5 | 7 | 2 | 2 | 2 |
| Renfrewshire | 195 | 1 | 5 | 13 | 24 | 27 | 6 | 8 | 2 | 5 | 4 | 3 | 3 |
| Scottish Borders | 257 | 2 | 2 | 10 | 21 | 18 | 15 | 9 | 9 | 7 | 2 | 4 | 2 |
| Shetland Islands | 83 | 0 | 5 | 20 | 13 | 7 | 23 | 7 | 10 | 4 | 2 | 4 | 5 |
| South Ayrshire | 87 | 2 | 2 | 11 | 13 | 24 | 16 | 9 | 5 | 7 | 5 | 3 | 2 |
| South Lanarkshire | 368 | 3 | 3 | 11 | 26 | 21 | 12 | 7 | 5 | 4 | 4 | 4 | 1 |
| Stirling | 211 | 1 | 1 | 8 | 30 | 22 | 11 | 13 | 5 | 2 | 3 | 2 | 1 |
| West Dunbartonshire | 145 | 1 | 1 | 15 | 34 | 19 | 13 | 6 | 5 | 3 | 2 | 1 | 1 |
| West Lothian | 684 | 2 | 1 | 11 | 28 | 26 | 10 | 10 | 4 | 3 | 2 | 2 | 1 |
Regarding the subset of bigger wildfires, greater monthly counts of wildfires for most LAs were recorded in one of the spring months (Table 5.31). For example, 43% and 39% of wildfires recorded for the Highland and Na h-Eileanan Siar areas, respectively, occurred in April, while April was the month with the most recorded wildfires for most LAs, followed by May. Overall, bigger spring wildfires outnumbered summer wildfires in almost all LAs and in those LAs with the greatest numbers of wildfire occurrence.
| LA | Sum | Jan | Feb | Mar | Apr | May | Jun | Jul | Aug | Sep | Oct | Nov | Dec |
|---|---|---|---|---|---|---|---|---|---|---|---|---|---|
| Aberdeen City | 3 | 0 | 0 | 0 | 0 | 33 | 0 | 33 | 0 | 33 | 0 | 0 | 0 |
| Aberdeenshire | 27 | 0 | 0 | 26 | 19 | 15 | 15 | 19 | 4 | 4 | 0 | 0 | 0 |
| Angus | 4 | 0 | 0 | 25 | 25 | 50 | 0 | 0 | 0 | 0 | 0 | 0 | 0 |
| Argyll & Bute | 59 | 0 | 2 | 29 | 37 | 29 | 3 | 0 | 0 | 0 | 0 | 0 | 0 |
| Clackmannanshire | 7 | 0 | 0 | 29 | 57 | 14 | 0 | 0 | 0 | 0 | 0 | 0 | 0 |
| Dumfries & Galloway | 33 | 0 | 3 | 21 | 52 | 18 | 6 | 0 | 0 | 0 | 0 | 0 | 0 |
| Dundee City | 2 | 0 | 0 | 0 | 50 | 0 | 0 | 50 | 0 | 0 | 0 | 0 | 0 |
| East Ayrshire | 30 | 0 | 0 | 13 | 50 | 30 | 7 | 0 | 0 | 0 | 0 | 0 | 0 |
| East Dunbartonshire | 4 | 0 | 0 | 0 | 50 | 50 | 0 | 0 | 0 | 0 | 0 | 0 | 0 |
| East Lothian | 5 | 80 | 20 | 0 | 0 | 0 | 0 | 0 | 0 | 0 | 0 | 0 | 0 |
| Edinburgh City | 2 | 0 | 0 | 0 | 50 | 0 | 0 | 50 | 0 | 0 | 0 | 0 | 0 |
| Falkirk | 7 | 0 | 0 | 0 | 29 | 43 | 0 | 29 | 0 | 0 | 0 | 0 | 0 |
| Fife | 17 | 0 | 6 | 12 | 24 | 18 | 18 | 18 | 0 | 0 | 6 | 0 | 0 |
| Glasgow City | 2 | 0 | 0 | 0 | 50 | 0 | 0 | 50 | 0 | 0 | 0 | 0 | 0 |
| Highland | 656 | 0 | 2 | 20 | 43 | 20 | 8 | 4 | 1 | 1 | 0 | 0 | 0 |
| Inverclyde | 8 | 0 | 0 | 0 | 38 | 63 | 0 | 0 | 0 | 0 | 0 | 0 | 0 |
| Midlothian | 4 | 0 | 0 | 25 | 25 | 25 | 25 | 0 | 0 | 0 | 0 | 0 | 0 |
| Moray | 25 | 0 | 0 | 8 | 20 | 28 | 20 | 12 | 0 | 12 | 0 | 0 | 0 |
| Na h-Eileanan Siar | 251 | 0 | 5 | 35 | 39 | 11 | 6 | 3 | 1 | 0 | 0 | 0 | 0 |
| North Ayrshire | 2 | 0 | 0 | 0 | 0 | 0 | 0 | 100 | 0 | 0 | 0 | 0 | 0 |
| North Lanarkshire | 26 | 0 | 0 | 4 | 38 | 54 | 4 | 0 | 0 | 0 | 0 | 0 | 0 |
| Orkney Islands | 11 | 0 | 0 | 9 | 55 | 18 | 0 | 9 | 0 | 0 | 9 | 0 | 0 |
| Perth & Kinross | 13 | 0 | 0 | 15 | 38 | 31 | 0 | 8 | 0 | 8 | 0 | 0 | 0 |
| Renfrewshire | 3 | 0 | 0 | 0 | 33 | 67 | 0 | 0 | 0 | 0 | 0 | 0 | 0 |
| Scottish Borders | 22 | 0 | 5 | 36 | 32 | 18 | 0 | 5 | 5 | 0 | 0 | 0 | 0 |
| Shetland Islands | 11 | 0 | 0 | 64 | 27 | 9 | 0 | 0 | 0 | 0 | 0 | 0 | 0 |
| South Ayrshire | 7 | 0 | 0 | 43 | 14 | 43 | 0 | 0 | 0 | 0 | 0 | 0 | 0 |
| South Lanarkshire | 16 | 0 | 0 | 13 | 44 | 25 | 19 | 0 | 0 | 0 | 0 | 0 | 0 |
| Stirling | 15 | 0 | 0 | 0 | 60 | 33 | 7 | 0 | 0 | 0 | 0 | 0 | 0 |
| West Dunbartonshire | 14 | 0 | 0 | 14 | 57 | 14 | 7 | 7 | 0 | 0 | 0 | 0 | 0 |
| West Lothian | 39 | 0 | 0 | 18 | 33 | 31 | 10 | 8 | 0 | 0 | 0 | 0 | 0 |
5.3.2.3 Daily
The greater daily counts of wildfires for the 2009-2020 period and for all LAs were recorded during weekends (either on a Saturday or a Sunday) (Table 5.32). However, in most cases the differences between daily wildfire counts were small. Overall, total wildfires occurring during weekdays outnumbered wildfires occurring at the weekend in all LAs. The greater numbers of weekday wildfires were recorded in the Dundee City, Aberdeen City and Na h-Eileanan Siar areas, where weekday wildfires accounted for 80%, 73% and 72% of the total number of wildfires. On the other hand, weekday wildfires accounted for 59% and 58% in the Shetlands and Orkney Islands, respectively, but accounted for 60% and more of total wildfires in all other LAs.
| LA | Sum | Monday | Tuesday | Wednesday | Thursday | Friday | Saturday | Sunday |
|---|---|---|---|---|---|---|---|---|
| Aberdeen City | 125 | 13 | 13 | 16 | 17 | 14 | 17 | 10 |
| Aberdeenshire | 281 | 16 | 12 | 12 | 11 | 12 | 19 | 17 |
| Angus | 54 | 9 | 24 | 15 | 7 | 13 | 17 | 15 |
| Argyll & Bute | 355 | 19 | 12 | 12 | 13 | 14 | 14 | 15 |
| Clackmannanshire | 79 | 14 | 14 | 11 | 15 | 10 | 14 | 22 |
| Dumfries & Galloway | 177 | 17 | 10 | 12 | 14 | 14 | 14 | 20 |
| Dundee City | 150 | 17 | 13 | 21 | 15 | 13 | 11 | 9 |
| East Ayrshire | 609 | 13 | 14 | 14 | 13 | 13 | 18 | 16 |
| East Dunbartonshire | 81 | 14 | 14 | 10 | 9 | 21 | 21 | 12 |
| East Lothian | 154 | 12 | 16 | 15 | 13 | 12 | 19 | 14 |
| East Renfrewshire | 35 | 20 | 20 | 6 | 6 | 17 | 11 | 20 |
| Edinburgh City | 200 | 15 | 12 | 13 | 9 | 11 | 21 | 20 |
| Falkirk | 357 | 16 | 16 | 11 | 13 | 12 | 16 | 16 |
| Fife | 414 | 15 | 11 | 13 | 14 | 12 | 16 | 19 |
| Glasgow City | 198 | 13 | 11 | 14 | 11 | 16 | 16 | 20 |
| Highland | 1852 | 14 | 14 | 14 | 14 | 15 | 17 | 12 |
| Inverclyde | 245 | 12 | 12 | 16 | 17 | 13 | 14 | 16 |
| Midlothian | 202 | 14 | 7 | 12 | 14 | 17 | 17 | 18 |
| Moray | 323 | 14 | 14 | 11 | 13 | 16 | 14 | 18 |
| Na h-Eileanan Siar | 644 | 19 | 16 | 12 | 13 | 11 | 17 | 11 |
| North Ayrshire | 187 | 16 | 12 | 11 | 12 | 11 | 23 | 15 |
| North Lanarkshire | 690 | 17 | 11 | 12 | 13 | 11 | 18 | 17 |
| Orkney Islands | 101 | 12 | 8 | 15 | 14 | 10 | 18 | 24 |
| Perth & Kinross | 182 | 14 | 10 | 17 | 5 | 14 | 23 | 16 |
| Renfrewshire | 195 | 16 | 13 | 14 | 12 | 17 | 15 | 13 |
| Scottish Borders | 257 | 11 | 14 | 11 | 12 | 18 | 16 | 19 |
| Shetland Islands | 83 | 12 | 8 | 10 | 11 | 18 | 20 | 20 |
| South Ayrshire | 87 | 17 | 2 | 16 | 17 | 7 | 21 | 20 |
| South Lanarkshire | 368 | 15 | 13 | 14 | 15 | 12 | 17 | 16 |
| Stirling | 211 | 16 | 13 | 11 | 15 | 9 | 19 | 17 |
| West Dunbartonshire | 145 | 12 | 12 | 16 | 14 | 10 | 16 | 20 |
| West Lothian | 684 | 16 | 14 | 11 | 12 | 14 | 16 | 17 |
Regarding bigger wildfires, fire incidents occurring during weekdays outnumbered wildfires occurring at the weekend in 25 of the 31 LAs, with three (3) LAs having the same wildfire occurrence between weekdays and weekends and another three (3) LAs having more wildfires recorded in weekends than during the week (Table 5.32). However, these six (6) LAs where weekend wildfires were the same or outnumbered fires during weekdays had only 26 (out of a total 1,325 fires) incidents of bigger wildfires. Overall, weekday wildfires accounted for 60% and more of total wildfires in most LAs. Looking at LAs with the greater numbers of bigger wildfires (>30 incidents), weekday wildfires accounted for 80%, 75% and 75% of the total number of bigger wildfires in the Argyll and Bute, Highland and Na h-Eileanan Siar areas, respectively.
| LA | Sum | Monday | Tuesday | Wednesday | Thursday | Friday | Saturday | Sunday |
|---|---|---|---|---|---|---|---|---|
| Aberdeen City | 3 | 0 | 0 | 33 | 33 | 0 | 33 | 0 |
| Aberdeenshire | 27 | 22 | 11 | 19 | 15 | 4 | 22 | 7 |
| Angus | 4 | 25 | 0 | 0 | 0 | 50 | 0 | 25 |
| Argyll & Bute | 59 | 24 | 15 | 12 | 10 | 19 | 10 | 10 |
| Clackmannanshire | 7 | 29 | 29 | 14 | 14 | 0 | 14 | 0 |
| Dumfries & Galloway | 33 | 24 | 12 | 12 | 9 | 6 | 15 | 21 |
| Dundee City | 2 | 0 | 0 | 0 | 0 | 50 | 0 | 50 |
| East Ayrshire | 30 | 13 | 23 | 7 | 0 | 17 | 23 | 17 |
| East Dunbartonshire | 4 | 25 | 0 | 25 | 0 | 50 | 0 | 0 |
| East Lothian | 5 | 0 | 0 | 40 | 20 | 0 | 20 | 20 |
| Edinburgh City | 2 | 0 | 0 | 0 | 50 | 0 | 0 | 50 |
| Falkirk | 7 | 57 | 0 | 0 | 0 | 14 | 29 | 0 |
| Fife | 17 | 12 | 0 | 12 | 29 | 12 | 18 | 18 |
| Glasgow City | 2 | 0 | 0 | 0 | 0 | 0 | 50 | 50 |
| Highland | 656 | 17 | 16 | 14 | 13 | 14 | 15 | 11 |
| Inverclyde | 8 | 38 | 13 | 13 | 13 | 13 | 13 | 0 |
| Midlothian | 4 | 0 | 0 | 25 | 50 | 0 | 25 | 0 |
| Moray | 25 | 24 | 4 | 8 | 24 | 12 | 12 | 16 |
| Na h-Eileanan Siar | 251 | 22 | 19 | 14 | 8 | 12 | 14 | 11 |
| North Ayrshire | 2 | 0 | 0 | 0 | 50 | 0 | 50 | 0 |
| North Lanarkshire | 26 | 19 | 12 | 8 | 12 | 4 | 31 | 15 |
| Orkney Islands | 11 | 18 | 9 | 18 | 0 | 0 | 18 | 36 |
| Perth & Kinross | 13 | 23 | 15 | 0 | 23 | 15 | 8 | 15 |
| Renfrewshire | 3 | 0 | 33 | 0 | 67 | 0 | 0 | 0 |
| Scottish Borders | 22 | 23 | 9 | 5 | 32 | 14 | 18 | 0 |
| Shetland Islands | 11 | 0 | 18 | 18 | 18 | 0 | 36 | 9 |
| South Ayrshire | 7 | 14 | 14 | 14 | 0 | 0 | 29 | 29 |
| South Lanarkshire | 16 | 19 | 6 | 13 | 31 | 13 | 6 | 13 |
| Stirling | 15 | 33 | 13 | 0 | 7 | 7 | 20 | 20 |
| West Dunbartonshire | 14 | 14 | 14 | 7 | 29 | 21 | 0 | 14 |
| West Lothian | 39 | 18 | 10 | 8 | 15 | 10 | 26 | 13 |
5.3.3 Fuel type
Broad Habitats (BH) classified from IRS Level 3 Property Types (Table 5.34) for wildfires from the full dataset show that grasslands were the most frequent fuel type in almost all LAs, where they ranged from 24% to 79% of total number of wildfires in the Angus and Dundee City, respectively. The main exceptions were in the Highland and Na h-Eileanan Siar areas where wildfires on heathlands/shrubland accounted for 56% and 50% of total wildfires, respectively. Wildfires on broadleaved and conifer woodlands accounted for 50% of all wildfires that occurred in the Falkirk area and for 44% of all wildfires in the Scottish Borders, while woodland/forest fires accounted for only 1% of total numbers of wildfires in the Shetland Islands and Glasgow City areas. In addition, wildfires on loose refuse were most frequent in the Orkney Islands, where they accounted for 25% of all recorded fires, and in the Midlothian and Angus areas (19% of all wildfires for both areas). Regarding BHs classified from LCS88 classes (Table 5.35), seminatural or improved grasslands were also the most frequent fuel types in most LAs, but there was several LAs where wildfires on either mixed or conifer forest were the most frequent (Aberdeenshire, Clackmannanshire, East Lothian, Falkirk, Fife, Midlothian, Moray, Scottish Borders), while wildfires on shrublands were the most frequent in the Highland area.
On the other hand, analysis of the subset of bigger wildfires using BHs classified from IRS Level 3 Property Types (Table 5.36) showed that shrublands were the most frequent fuel type for 22 LAs, with grasslands being the most frequent fuel type in another eight (8) LAs and conifers in one LA (Moray). Looking at BHs based on LCS88 classes (Table 5.37), bigger wildfires on grasslands (either seminatural or improved) outnumbered wildfires on bogs and peatlands and shrubland combined and woodland fires (broadleaves, mixed and conifers) in 18 LAs. Wildfires on bogs and peatland and on shrubland were more frequent in the Angus, Highland and Na h-Eileanan Siar LAs (75%, 56% and 53% of all wildfires, respectively), while combined woodland fires were more frequent in Falkirk, Moray and Midlothian LAs (71%, 68% and 50% of all wildfires, respectively).
| LA | Sum | Shrubland | Grasslands | Broadleaves | Conifers | Arable | Freshwater | Linear features | Built-up | Refuse | Other |
|---|---|---|---|---|---|---|---|---|---|---|---|
| Aberdeen City | 125 | 26 | 38 | 18 | 3 | 1 | 1 | 0 | 0 | 13 | 0 |
| Aberdeenshire | 281 | 22 | 31 | 19 | 6 | 1 | 0 | 4 | 0 | 14 | 3 |
| Angus | 54 | 20 | 24 | 17 | 2 | 0 | 0 | 11 | 2 | 19 | 6 |
| Argyll & Bute | 355 | 35 | 36 | 8 | 4 | 1 | 0 | 4 | 0 | 3 | 8 |
| Clackmannanshire | 79 | 14 | 41 | 33 | 1 | 5 | 0 | 1 | 1 | 4 | 0 |
| Dumfries & Galloway | 177 | 28 | 29 | 10 | 7 | 2 | 0 | 12 | 0 | 9 | 3 |
| Dundee City | 150 | 7 | 79 | 7 | 1 | 0 | 0 | 0 | 2 | 5 | 0 |
| East Ayrshire | 609 | 14 | 57 | 7 | 3 | 0 | 0 | 4 | 0 | 9 | 6 |
| East Dunbartonshire | 81 | 21 | 30 | 11 | 2 | 1 | 0 | 5 | 0 | 12 | 17 |
| East Lothian | 154 | 11 | 34 | 21 | 8 | 1 | 0 | 6 | 1 | 6 | 12 |
| East Renfrewshire | 35 | 11 | 51 | 6 | 3 | 6 | 0 | 0 | 0 | 9 | 14 |
| Edinburgh City | 200 | 22 | 32 | 19 | 7 | 2 | 2 | 6 | 4 | 6 | 3 |
| Falkirk | 357 | 7 | 29 | 35 | 15 | 1 | 0 | 4 | 2 | 5 | 3 |
| Fife | 414 | 11 | 37 | 21 | 10 | 2 | 0 | 3 | 1 | 12 | 2 |
| Glasgow City | 198 | 10 | 75 | 1 | 0 | 1 | 1 | 2 | 0 | 8 | 4 |
| Highland | 1852 | 56 | 23 | 7 | 4 | 1 | 0 | 5 | 0 | 3 | 2 |
| Inverclyde | 245 | 40 | 46 | 4 | 1 | 0 | 0 | 2 | 0 | 4 | 4 |
| Midlothian | 202 | 10 | 27 | 24 | 6 | 1 | 0 | 8 | 3 | 19 | 1 |
| Moray | 323 | 9 | 41 | 21 | 8 | 1 | 0 | 9 | 0 | 10 | 1 |
| Na h-Eileanan Siar | 644 | 50 | 35 | 4 | 2 | 1 | 0 | 1 | 0 | 5 | 1 |
| North Ayrshire | 187 | 13 | 43 | 2 | 2 | 2 | 0 | 10 | 1 | 9 | 20 |
| North Lanarkshire | 690 | 21 | 52 | 6 | 1 | 1 | 0 | 4 | 1 | 11 | 3 |
| Orkney Islands | 101 | 17 | 37 | 1 | 2 | 4 | 0 | 7 | 2 | 25 | 6 |
| Perth & Kinross | 182 | 16 | 32 | 23 | 4 | 4 | 1 | 7 | 1 | 7 | 7 |
| Renfrewshire | 195 | 10 | 46 | 13 | 3 | 2 | 1 | 4 | 1 | 14 | 8 |
| Scottish Borders | 257 | 20 | 16 | 28 | 16 | 2 | 0 | 6 | 1 | 6 | 5 |
| Shetland Islands | 83 | 29 | 35 | 0 | 1 | 0 | 0 | 8 | 2 | 17 | 7 |
| South Ayrshire | 87 | 8 | 32 | 15 | 6 | 2 | 0 | 3 | 0 | 7 | 26 |
| South Lanarkshire | 368 | 14 | 37 | 10 | 3 | 1 | 0 | 5 | 0 | 18 | 12 |
| Stirling | 211 | 26 | 28 | 23 | 9 | 1 | 1 | 1 | 1 | 7 | 1 |
| West Dunbartonshire | 145 | 23 | 52 | 9 | 2 | 0 | 0 | 1 | 3 | 4 | 6 |
| West Lothian | 684 | 24 | 36 | 13 | 10 | 0 | 0 | 4 | 2 | 10 | 3 |
| LA | Sum | Bogs & peatlands | Shrubland | Montane | Cliffs | Grasslands | Improved grass | Broadleaves | Mixed woodland | Conifers | Arable | Fresh water | Built- up | No Data |
|---|---|---|---|---|---|---|---|---|---|---|---|---|---|---|
| Aberdeen City | 125 | 0 | 3 | 0 | 0 | 54 | 11 | 2 | 2 | 16 | 5 | 0 | 2 | 5 |
| Aberdeenshire | 281 | 2 | 7 | 0 | 0 | 16 | 5 | 8 | 13 | 37 | 10 | 0 | 0 | 0 |
| Angus | 54 | 0 | 13 | 0 | 0 | 35 | 9 | 2 | 17 | 11 | 2 | 0 | 7 | 4 |
| Argyll & Bute | 355 | 10 | 14 | 0 | 0 | 31 | 17 | 8 | 8 | 12 | 0 | 0 | 1 | 0 |
| Clackmannanshire | 79 | 0 | 0 | 0 | 0 | 18 | 6 | 8 | 42 | 10 | 11 | 0 | 5 | 0 |
| Dumfries & Galloway | 177 | 8 | 3 | 0 | 0 | 37 | 12 | 10 | 8 | 17 | 3 | 1 | 1 | 0 |
| Dundee City | 150 | 0 | 0 | 0 | 0 | 48 | 4 | 3 | 12 | 0 | 19 | 0 | 15 | 0 |
| East Ayrshire | 609 | 4 | 0 | 0 | 0 | 36 | 19 | 5 | 10 | 13 | 0 | 0 | 12 | 0 |
| East Dunbartonshire | 81 | 2 | 4 | 0 | 0 | 20 | 41 | 7 | 17 | 4 | 1 | 0 | 4 | 0 |
| East Lothian | 154 | 0 | 0 | 0 | 0 | 25 | 1 | 2 | 13 | 26 | 31 | 0 | 3 | 0 |
| East Renfrewshire | 35 | 6 | 0 | 0 | 0 | 23 | 63 | 0 | 3 | 3 | 0 | 0 | 3 | 0 |
| Edinburgh City | 200 | 0 | 12 | 0 | 0 | 15 | 11 | 6 | 10 | 14 | 21 | 2 | 12 | 0 |
| Falkirk | 357 | 2 | 0 | 0 | 0 | 11 | 14 | 2 | 15 | 51 | 1 | 0 | 3 | 1 |
| Fife | 414 | 1 | 3 | 0 | 0 | 20 | 9 | 8 | 15 | 28 | 11 | 1 | 2 | 1 |
| Glasgow City | 198 | 2 | 0 | 0 | 0 | 12 | 41 | 4 | 1 | 0 | 1 | 1 | 39 | 1 |
| Highland | 1852 | 10 | 32 | 0 | 0 | 14 | 15 | 7 | 4 | 16 | 0 | 0 | 0 | 0 |
| Inverclyde | 245 | 1 | 11 | 0 | 0 | 66 | 13 | 0 | 4 | 2 | 1 | 0 | 2 | 0 |
| Midlothian | 202 | 0 | 3 | 0 | 0 | 7 | 8 | 2 | 49 | 12 | 16 | 0 | 1 | 0 |
| Moray | 323 | 2 | 2 | 0 | 0 | 8 | 6 | 3 | 7 | 64 | 6 | 0 | 1 | 1 |
| Na h-Eileanan Siar | 644 | 18 | 23 | 0 | 0 | 1 | 45 | 1 | 3 | 0 | 0 | 1 | 5 | 3 |
| North Ayrshire | 187 | 3 | 1 | 0 | 0 | 26 | 48 | 2 | 3 | 3 | 1 | 0 | 9 | 4 |
| North Lanarkshire | 690 | 7 | 1 | 0 | 0 | 24 | 37 | 0 | 11 | 3 | 2 | 0 | 13 | 2 |
| Orkney Islands | 101 | 4 | 5 | 0 | 0 | 3 | 71 | 0 | 0 | 0 | 0 | 0 | 11 | 6 |
| Perth & Kinross | 182 | 1 | 5 | 0 | 0 | 26 | 7 | 12 | 25 | 17 | 7 | 0 | 1 | 0 |
| Renfrewshire | 195 | 3 | 0 | 0 | 0 | 33 | 39 | 2 | 8 | 3 | 6 | 0 | 8 | 0 |
| Scottish Borders | 257 | 0 | 6 | 0 | 0 | 21 | 19 | 4 | 11 | 35 | 2 | 0 | 2 | 0 |
| Shetland Islands | 83 | 11 | 16 | 0 | 1 | 10 | 41 | 0 | 0 | 0 | 0 | 0 | 20 | 1 |
| South Ayrshire | 87 | 0 | 1 | 0 | 0 | 23 | 45 | 7 | 11 | 8 | 2 | 0 | 2 | 0 |
| South Lanarkshire | 368 | 2 | 0 | 0 | 0 | 12 | 52 | 4 | 12 | 5 | 0 | 0 | 3 | 10 |
| Stirling | 211 | 2 | 2 | 0 | 0 | 27 | 9 | 8 | 28 | 15 | 5 | 0 | 3 | 1 |
| West Dunbartonshire | 145 | 1 | 9 | 0 | 0 | 30 | 19 | 1 | 20 | 4 | 0 | 0 | 14 | 1 |
| West Lothian | 684 | 16 | 0 | 0 | 0 | 18 | 28 | 0 | 5 | 21 | 4 | 0 | 5 | 2 |
| LA | Sum | Shrubland | Grasslands | Broadleaves | Conifers | Arable | Linear features | Refuse | Other |
|---|---|---|---|---|---|---|---|---|---|
| Aberdeen City | 3 | 100 | 0 | 0 | 0 | 0 | 0 | 0 | 0 |
| Aberdeenshire | 27 | 56 | 30 | 4 | 7 | 0 | 0 | 0 | 4 |
| Angus | 4 | 100 | 0 | 0 | 0 | 0 | 0 | 0 | 0 |
| Argyll & Bute | 59 | 64 | 25 | 2 | 8 | 0 | 0 | 0 | 0 |
| Clackmannanshire | 7 | 57 | 43 | 0 | 0 | 0 | 0 | 0 | 0 |
| Dumfries & Galloway | 33 | 61 | 27 | 6 | 6 | 0 | 0 | 0 | 0 |
| Dundee City | 2 | 50 | 50 | 0 | 0 | 0 | 0 | 0 | 0 |
| East Ayrshire | 30 | 23 | 60 | 0 | 17 | 0 | 0 | 0 | 0 |
| East Dunbartonshire | 4 | 50 | 25 | 0 | 25 | 0 | 0 | 0 | 0 |
| East Lothian | 5 | 80 | 20 | 0 | 0 | 0 | 0 | 0 | 0 |
| Edinburgh City | 2 | 0 | 100 | 0 | 0 | 0 | 0 | 0 | 0 |
| Falkirk | 7 | 57 | 29 | 0 | 14 | 0 | 0 | 0 | 0 |
| Fife | 17 | 6 | 47 | 12 | 29 | 0 | 0 | 0 | 6 |
| Glasgow City | 2 | 0 | 100 | 0 | 0 | 0 | 0 | 0 | 0 |
| Highland | 656 | 73 | 17 | 3 | 4 | 0 | 1 | 0 | 1 |
| Inverclyde | 8 | 75 | 13 | 0 | 13 | 0 | 0 | 0 | 0 |
| Midlothian | 4 | 25 | 25 | 25 | 25 | 0 | 0 | 0 | 0 |
| Moray | 25 | 24 | 24 | 16 | 32 | 0 | 0 | 4 | 0 |
| Na h-Eileanan Siar | 251 | 65 | 28 | 2 | 4 | 0 | 0 | 0 | 0 |
| North Ayrshire | 2 | 0 | 100 | 0 | 0 | 0 | 0 | 0 | 0 |
| North Lanarkshire | 26 | 50 | 42 | 4 | 4 | 0 | 0 | 0 | 0 |
| Orkney Islands | 11 | 36 | 45 | 0 | 18 | 0 | 0 | 0 | 0 |
| Perth & Kinross | 13 | 54 | 15 | 8 | 15 | 8 | 0 | 0 | 0 |
| Renfrewshire | 3 | 33 | 67 | 0 | 0 | 0 | 0 | 0 | 0 |
| Scottish Borders | 22 | 55 | 23 | 14 | 5 | 0 | 5 | 0 | 0 |
| Shetland Islands | 11 | 100 | 0 | 0 | 0 | 0 | 0 | 0 | 0 |
| South Ayrshire | 7 | 43 | 43 | 14 | 0 | 0 | 0 | 0 | 0 |
| South Lanarkshire | 16 | 63 | 38 | 0 | 0 | 0 | 0 | 0 | 0 |
| Stirling | 15 | 60 | 13 | 13 | 13 | 0 | 0 | 0 | 0 |
| West Dunbartonshire | 14 | 57 | 21 | 14 | 7 | 0 | 0 | 0 | 0 |
| West Lothian | 39 | 44 | 33 | 0 | 18 | 0 | 0 | 3 | 3 |
| LA | Sum | Bogs & peatlands | Shrubland | Montane | Cliffs | Grasslands | Improved grass | Broadleaves | Mixed woodland | Conifers | Arable | Fresh water | Built- up | No Data |
|---|---|---|---|---|---|---|---|---|---|---|---|---|---|---|
| Aberdeen City | 3 | 0 | 0 | 0 | 0 | 67 | 33 | 0 | 0 | 0 | 0 | 0 | 0 | 0 |
| Aberdeenshire | 27 | 11 | 33 | 0 | 0 | 22 | 4 | 0 | 7 | 22 | 0 | 0 | 0 | 0 |
| Angus | 4 | 0 | 75 | 0 | 0 | 0 | 0 | 0 | 0 | 25 | 0 | 0 | 0 | 0 |
| Argyll & Bute | 59 | 10 | 24 | 0 | 0 | 29 | 10 | 8 | 8 | 10 | 0 | 0 | 0 | 0 |
| Clackmannanshire | 7 | 0 | 0 | 0 | 0 | 71 | 29 | 0 | 0 | 0 | 0 | 0 | 0 | 0 |
| Dumfries & Galloway | 33 | 18 | 12 | 0 | 0 | 39 | 6 | 9 | 0 | 15 | 0 | 0 | 0 | 0 |
| Dundee City | 2 | 0 | 0 | 0 | 0 | 0 | 0 | 0 | 0 | 0 | 50 | 0 | 50 | 0 |
| East Ayrshire | 30 | 20 | 3 | 0 | 0 | 47 | 3 | 0 | 0 | 20 | 0 | 0 | 7 | 0 |
| East Dunbartonshire | 4 | 0 | 0 | 0 | 0 | 75 | 0 | 25 | 0 | 0 | 0 | 0 | 0 | 0 |
| East Lothian | 5 | 0 | 0 | 0 | 0 | 100 | 0 | 0 | 0 | 0 | 0 | 0 | 0 | 0 |
| Edinburgh City | 2 | 0 | 0 | 0 | 0 | 0 | 0 | 0 | 50 | 0 | 0 | 0 | 50 | 0 |
| Falkirk | 7 | 29 | 0 | 0 | 0 | 0 | 0 | 0 | 0 | 71 | 0 | 0 | 0 | 0 |
| Fife | 17 | 0 | 6 | 0 | 0 | 29 | 12 | 6 | 6 | 35 | 6 | 0 | 0 | 0 |
| Glasgow City | 2 | 0 | 0 | 0 | 0 | 50 | 50 | 0 | 0 | 0 | 0 | 0 | 0 | 0 |
| Highland | 656 | 13 | 43 | 0 | 0 | 14 | 14 | 8 | 2 | 6 | 0 | 0 | 0 | 0 |
| Inverclyde | 8 | 0 | 0 | 0 | 0 | 100 | 0 | 0 | 0 | 0 | 0 | 0 | 0 | 0 |
| Midlothian | 4 | 0 | 25 | 0 | 0 | 25 | 0 | 0 | 0 | 50 | 0 | 0 | 0 | 0 |
| Moray | 25 | 4 | 8 | 0 | 0 | 20 | 0 | 0 | 0 | 68 | 0 | 0 | 0 | 0 |
| Na h-Eileanan Siar | 251 | 27 | 26 | 0 | 0 | 1 | 40 | 0 | 1 | 0 | 0 | 1 | 3 | 2 |
| North Ayrshire | 2 | 0 | 0 | 0 | 0 | 100 | 0 | 0 | 0 | 0 | 0 | 0 | 0 | 0 |
| North Lanarkshire | 26 | 23 | 8 | 0 | 0 | 23 | 35 | 0 | 8 | 4 | 0 | 0 | 0 | 0 |
| Orkney Islands | 11 | 18 | 0 | 0 | 0 | 9 | 55 | 0 | 0 | 0 | 0 | 0 | 0 | 18 |
| Perth & Kinross | 13 | 8 | 23 | 0 | 0 | 38 | 8 | 0 | 15 | 8 | 0 | 0 | 0 | 0 |
| Renfrewshire | 3 | 0 | 0 | 0 | 0 | 33 | 0 | 0 | 33 | 0 | 0 | 0 | 33 | 0 |
| Scottish Borders | 22 | 0 | 23 | 0 | 0 | 41 | 14 | 0 | 0 | 23 | 0 | 0 | 0 | 0 |
| Shetland Islands | 11 | 9 | 36 | 0 | 0 | 9 | 36 | 0 | 0 | 0 | 0 | 0 | 9 | 0 |
| South Ayrshire | 7 | 0 | 14 | 0 | 0 | 14 | 43 | 14 | 0 | 14 | 0 | 0 | 0 | 0 |
| South Lanarkshire | 16 | 19 | 0 | 0 | 0 | 38 | 25 | 0 | 0 | 0 | 0 | 0 | 0 | 19 |
| Stirling | 15 | 20 | 0 | 0 | 0 | 60 | 7 | 0 | 13 | 0 | 0 | 0 | 0 | 0 |
| West Dunbartonshire | 14 | 0 | 21 | 0 | 0 | 71 | 0 | 0 | 0 | 7 | 0 | 0 | 0 | 0 |
| West Lothian | 39 | 46 | 0 | 0 | 0 | 10 | 21 | 0 | 0 | 21 | 0 | 0 | 0 | 3 |
5.3.4 Ignition motives
Wildfires caused by deliberate ignitions were the most frequent in 23 of the 32 LAs in Scotland (Table 5.38), accounting for 53% of total wildfires in the Stirling area and up to 95% in the Renfrewshire area and 97% in the Inverclyde areas. On the other hand, wildfires caused by accidental ignitions were the most frequent in the Argyll and Bute, Na h-Eileanan Siar, Dumfries and Galloway, Aberdeenshire, Perth and Kinross, Shetland Islands, Orkney Islands, Moray and Highland areas, where they accounted for 45% to 60% of all wildfires recorded. This was expected based on the finding (Section 5.2.5) that wildfires in the least accessible and least populated areas are more likely to be accidental, as most of the more remote and very remote areas in Scotland are concentrated in these LAs.
| LA | Sum | Accidental | Deliberate | Not known |
|---|---|---|---|---|
| Aberdeen City | 125 | 22 | 70 | 7 |
| Aberdeenshire | 281 | 55 | 42 | 3 |
| Angus | 54 | 24 | 59 | 17 |
| Argyll & Bute | 355 | 60 | 33 | 7 |
| Clackmannanshire | 79 | 9 | 77 | 14 |
| Dumfries & Galloway | 177 | 56 | 38 | 6 |
| Dundee City | 150 | 1 | 90 | 9 |
| East Ayrshire | 609 | 4 | 90 | 5 |
| East Dunbartonshire | 81 | 5 | 89 | 6 |
| East Lothian | 154 | 17 | 60 | 23 |
| East Renfrewshire | 35 | 3 | 94 | 3 |
| Edinburgh City | 200 | 10 | 70 | 20 |
| Falkirk | 357 | 6 | 71 | 23 |
| Fife | 414 | 14 | 68 | 18 |
| Glasgow City | 198 | 2 | 94 | 4 |
| Highland | 1852 | 45 | 17 | 38 |
| Inverclyde | 245 | 2 | 97 | 2 |
| Midlothian | 202 | 7 | 78 | 15 |
| Moray | 323 | 46 | 42 | 12 |
| Na h-Eileanan Siar | 644 | 59 | 10 | 31 |
| North Ayrshire | 187 | 8 | 91 | 1 |
| North Lanarkshire | 690 | 4 | 92 | 4 |
| Orkney Islands | 101 | 50 | 26 | 24 |
| Perth & Kinross | 182 | 51 | 40 | 10 |
| Renfrewshire | 195 | 3 | 95 | 2 |
| Scottish Borders | 257 | 20 | 67 | 13 |
| Shetland Islands | 83 | 51 | 19 | 30 |
| South Ayrshire | 87 | 25 | 70 | 5 |
| South Lanarkshire | 368 | 14 | 83 | 3 |
| Stirling | 211 | 18 | 53 | 29 |
| West Dunbartonshire | 145 | 8 | 90 | 2 |
| West Lothian | 684 | 7 | 79 | 14 |
Looking at the subset of bigger wildfires, those caused by deliberate ignitions were the most frequent in 14 of the 31 LAs (Table 5.39), accounting for all wildfires in the Inverclyde, Renfrewshire, Dundee City and North Ayrshire LAs. On the other hand, wildfires caused by accidental ignitions were the most frequent in eight (8) LAs that include those where most bigger wildfires were recorded. In particular, accidental wildfires in the Aberdeenshire, Dumfries & Galloway, Argyll and Bute, Na h-Eileanan Siar and Highland areas accounted for 85%, 73%, 63%, 59% and 47% of all bigger wildfires in these LAs, respectively.
| LA | Sum | Accidental | Deliberate | Not known |
|---|---|---|---|---|
| Aberdeen City | 3 | 67 | 33 | 0 |
| Aberdeenshire | 27 | 85 | 7 | 7 |
| Angus | 4 | 50 | 25 | 25 |
| Argyll & Bute | 59 | 63 | 27 | 10 |
| Clackmannanshire | 7 | 0 | 71 | 29 |
| Dumfries & Galloway | 33 | 73 | 18 | 9 |
| Dundee City | 2 | 0 | 100 | 0 |
| East Ayrshire | 30 | 10 | 87 | 3 |
| East Dunbartonshire | 4 | 0 | 75 | 25 |
| East Lothian | 5 | 0 | 80 | 20 |
| Edinburgh City | 2 | 0 | 0 | 100 |
| Falkirk | 7 | 0 | 29 | 71 |
| Fife | 17 | 18 | 35 | 47 |
| Glasgow City | 2 | 50 | 50 | 0 |
| Highland | 656 | 47 | 11 | 43 |
| Inverclyde | 8 | 0 | 100 | 0 |
| Midlothian | 4 | 50 | 25 | 25 |
| Moray | 25 | 40 | 16 | 44 |
| Na h-Eileanan Siar | 251 | 59 | 7 | 34 |
| North Ayrshire | 2 | 0 | 100 | 0 |
| North Lanarkshire | 26 | 15 | 81 | 4 |
| Orkney Islands | 11 | 73 | 0 | 27 |
| Perth & Kinross | 13 | 77 | 23 | 0 |
| Renfrewshire | 3 | 0 | 100 | 0 |
| Scottish Borders | 22 | 23 | 50 | 27 |
| Shetland Islands | 11 | 73 | 9 | 18 |
| South Ayrshire | 7 | 43 | 29 | 29 |
| South Lanarkshire | 16 | 44 | 56 | 0 |
| Stirling | 15 | 40 | 20 | 40 |
| West Dunbartonshire | 14 | 21 | 79 | 0 |
| West Lothian | 39 | 3 | 69 | 28 |
5.3.5 Burnt area size
Most wildfires in all LAs were small fires with burnt areas of less than 100 m2, except for Na h-Eileanan Siar where bigger fires of more than 1,000 m2 were the most frequent (39%) (Table 5.40). A significant proportion of bigger wildfires (35%) was also recorded in the Highland area. The greater numbers of small wildfires occurred in Renfrewshire, Falkirk, Aberdeen City, Glasgow City and Edinburgh City areas, where they accounted for more than 84% of all recorded wildfires. On the other hand, fewer small wildfires occurred in the Na h-Eileanan Siar, Highland and Argyll and Bute areas, where they accounted for 35%, 44% and 54% of all wildfires, respectively. Again, this finding is consistent with the previous analysis (Section 5.2.5) which showed that small fires are more likely to occur in easily accessible urban areas, while bigger fires tend to occur in more remote and less accessible areas.
| LA | Sum | None | DA0_100 | DA100_1000 | DA>1000 |
|---|---|---|---|---|---|
| Aberdeen City | 125 | 4 | 85 | 9 | 2 |
| Aberdeenshire | 281 | 7 | 71 | 13 | 10 |
| Angus | 54 | 17 | 65 | 11 | 7 |
| Argyll & Bute | 355 | 7 | 54 | 23 | 17 |
| Clackmannanshire | 79 | 4 | 71 | 16 | 9 |
| Dumfries & Galloway | 177 | 6 | 57 | 19 | 19 |
| Dundee City | 150 | 5 | 81 | 13 | 1 |
| East Ayrshire | 609 | 9 | 69 | 17 | 5 |
| East Dunbartonshire | 81 | 4 | 83 | 9 | 5 |
| East Lothian | 154 | 5 | 81 | 11 | 3 |
| East Renfrewshire | 35 | 0 | 80 | 20 | 0 |
| Edinburgh City | 200 | 4 | 84 | 12 | 1 |
| Falkirk | 357 | 3 | 87 | 8 | 2 |
| Fife | 414 | 3 | 81 | 12 | 4 |
| Glasgow City | 198 | 9 | 84 | 7 | 1 |
| Highland | 1852 | 3 | 44 | 17 | 35 |
| Inverclyde | 245 | 2 | 75 | 20 | 3 |
| Midlothian | 202 | 13 | 77 | 8 | 2 |
| Moray | 323 | 2 | 78 | 12 | 8 |
| Na h-Eileanan Siar | 644 | 3 | 35 | 22 | 39 |
| North Ayrshire | 187 | 10 | 80 | 9 | 1 |
| North Lanarkshire | 690 | 5 | 79 | 13 | 4 |
| Orkney Islands | 101 | 10 | 65 | 14 | 11 |
| Perth & Kinross | 182 | 3 | 75 | 14 | 7 |
| Renfrewshire | 195 | 3 | 89 | 7 | 2 |
| Scottish Borders | 257 | 7 | 72 | 12 | 9 |
| Shetland Islands | 83 | 10 | 64 | 13 | 13 |
| South Ayrshire | 87 | 11 | 75 | 6 | 8 |
| South Lanarkshire | 368 | 7 | 77 | 12 | 4 |
| Stirling | 211 | 3 | 68 | 22 | 7 |
| West Dunbartonshire | 145 | 1 | 70 | 20 | 10 |
| West Lothian | 684 | 2 | 76 | 16 | 6 |
5.4 Local Authority Cluster Groups
5.4.1 Cluster analysis
As mentioned in Section 5.1, we used hierarchical cluster analysis to group Local Authorities (LAs) based on similarities of their wildfire characteristics, aiming to facilitate an easier comparison and understanding of wildfire occurrence patterns in different LAs. For this purpose, we compiled a dataset of wildfire characteristics recorded in the IRS for all identified wildfires occurring in each of the 32 LAs that consisted of the following values:
- Proportions (in %) of wildfires belonging to main Level 3 Property Types: grasslands, heathlands, refuse, scrub land, broadleaves, and conifers.
- Proportions (in %) of wildfires occurring in winter (December, January, February), spring (March, April, May), summer (June, July, August) and autumn (September, October, November) seasons.
- Proportions (%) of wildfires with burnt area estimates for Outdoor Damage Area classes of 0-100 m2; 100-1,000 m2 and more than 1,000 m2.
- Proportions (in %) of wildfires with an accidental or a deliberate ignition motive.
We calculated and used proportions because cluster analysis requires using numeric variables. We used Ward's method of hierarchical cluster analysis implemented in the R statistical software using the dataset with all wildfire characteristics (Clusters A) and without the proportions of ignition motive (Clusters B); this was done in consultation with the SFRS aiming to assess the effect that motive of ignition, which is prone to a certain degree of subjectivity because of personal beliefs or experience, has on the groupings of LAs.
Figure 5.13 shows the result of the cluster analysis in the form of two dendrograms based on similarity distance between LAs. The analysis using the dataset with all wildfire characteristics produced two main cluster groupings (Figure 5.13a): the smaller Cluster group A2 consisting of six (6) LAs and the bigger Cluster that was divided into Cluster sub-groups A1 and A3, consisting of nineteen (19) and seven (7) LAs, respectively. Regarding the number of wildfires within Cluster groups, Cluster groups A1, A2 and A3 contained 4,441, 3,212 and 2,072 wildfires, respectively.
Removing the motive of ignition from the analysis resulted in two main cluster groupings that each was split into two sub-groups (Figure 5.13b): Cluster sub-groups B1 and B3, consisting of eleven (11) and seven (7) LAs, respectively, and Cluster sub-groups B2 and B4, consisting of twelve (12) and two (2) LAs, respectively. Cluster groups B1, B2, B3 and B4 contained 2,434, 3,578, 1,217 and 2,496, respectively.
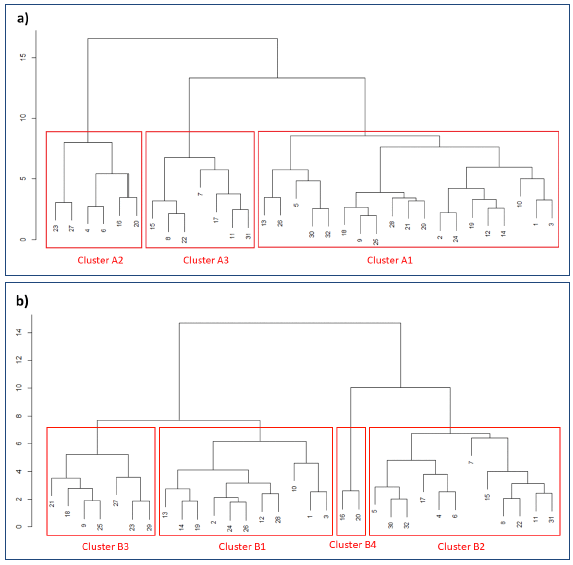
| ID | LA | Clusters A | Clusters B | ID | LA | Clusters A | Clusters B |
|---|---|---|---|---|---|---|---|
| 1 | Aberdeen City | 1 | 1 | 17 | Inverclyde | 3 | 2 |
| 2 | Aberdeenshire | 1 | 1 | 18 | Midlothian | 1 | 3 |
| 3 | Angus | 1 | 1 | 19 | Moray | 1 | 1 |
| 4 | Argyll & Bute | 2 | 2 | 20 | Na h-Eileanan Siar | 2 | 4 |
| 5 | Clackmannanshire | 1 | 2 | 21 | North Ayrshire | 1 | 3 |
| 6 | Dumfries & Galloway | 2 | 2 | 22 | North Lanarkshire | 3 | 2 |
| 7 | Dundee City | 3 | 2 | 23 | Orkney Islands | 2 | 3 |
| 8 | East Ayrshire | 3 | 2 | 24 | Perth & Kinross | 1 | 1 |
| 9 | East Dunbartonshire | 1 | 3 | 25 | Renfrewshire | 1 | 3 |
| 10 | East Lothian | 1 | 1 | 26 | Scottish Borders | 1 | 1 |
| 11 | East Renfrewshire | 3 | 2 | 27 | Shetland Islands | 2 | 3 |
| 12 | Edinburgh City | 1 | 1 | 28 | South Ayrshire | 1 | 1 |
| 13 | Falkirk | 1 | 1 | 29 | South Lanarkshire | 1 | 3 |
| 14 | Fife | 1 | 1 | 30 | Stirling | 1 | 2 |
| 15 | Glasgow City | 3 | 2 | 31 | West Dunbartonshire | 3 | 2 |
| 16 | Highland | 2 | 4 | 32 | West Lothian | 1 | 2 |
Looking at Table 5.41 and Figure 5.14, it becomes evident that Cluster group A2 consists of the LAs that include more remote rural areas, while Cluster groups A1 and A3 consist of LAs where most urban and accessible rural areas are found. Similarly, Cluster groups B2 and B4 consist of the LAs with more rural areas and Cluster groups B1 and B3 consist of LAs with more urban and accessible rural areas. The main difference between Cluster A and B groups is that the Highland and Na h-Eileanan Siar LAs form a separate group (Cluster B4) consisting of bigger wildfires on bogs and shrublands, while those two (2) LAs are included in the Cluster A2 group. There are also differences in cluster groupings in the more urban areas in the Central Belt, while there are similarities in groupings in the eastern parts of Scotland.
To understand differences in wildfire occurrence patterns within the identified cluster groups, we conducted the same analysis as in Sections 5.2 and 5.3 looking at patterns of seasonality, fuel type, motives of ignition, burnt area sizes along with accessibility aspects based on the Urban-Rural classification.
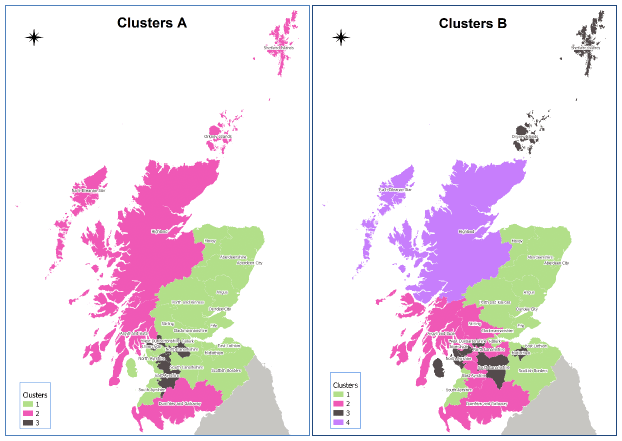
5.4.2 Temporal – Seasonality
Figure 5.15 shows overall limited inter-annual variability with regards to the relative proportions of wildfire incidents belonging to the different cluster groups. There seem to be fewer than average Cluster group A2 and B4 wildfires between 2015 to 2017 proportionally to Cluster groups A1 and A3 and B1, B2, B3 wildfires, respectively. This indicated that fewer than expected remote wildfires were recorded for these years.
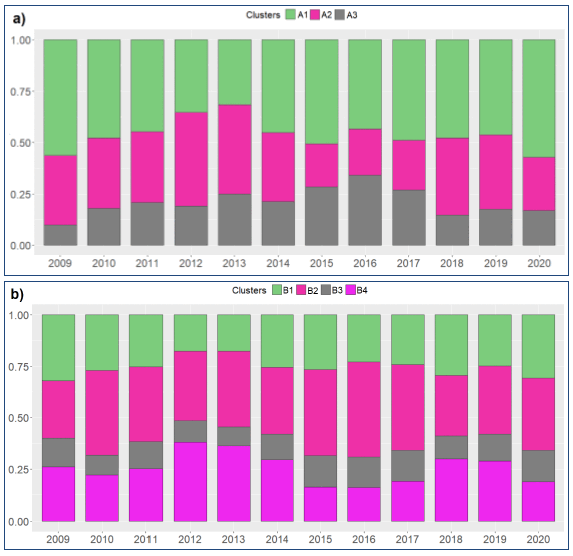
Looking at seasonality at a monthly basis, most Cluster group A3 wildfires occurred in April, and this was the same but to a lesser extent for the Cluster group A2 wildfires (Figure 5.16a). On the other hand, most wildfires in Cluster group A1 occurred almost equally in April and May. Similarly, most wildfires in Cluster groups B2 and B4 occurred in April, but there was a greater proportions of early spring wildfires (in March) than late spring wildfires (in May) in Cluster group B4 compared to group B2 (Figure 5.16b). Most wildfires in Cluster groups B1 and B3 occurred almost equally in April and May, but their combined proportion was greater in Cluster group B3 than in B1, with the latter also having the greater proportion of summer wildfires compared to the other three (3) groups.
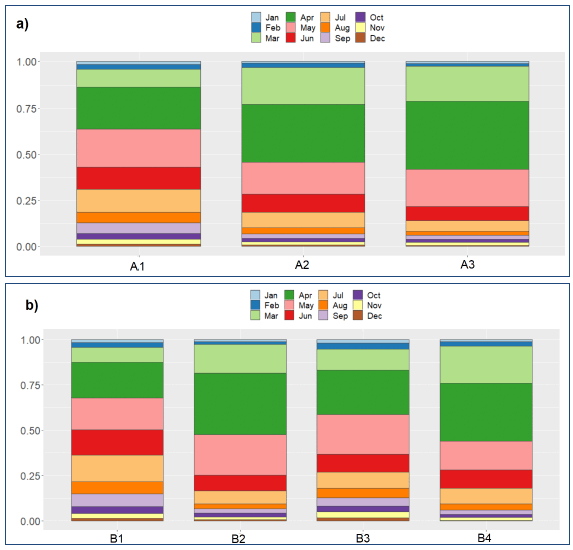
5.4.3 Fuel type
Figure 5.17 shows clear patterns related to fuel type composition between cluster groups. Cluster group A2 includes a greater number of wildfires on shrub and on bogs and peatlands compared to Cluster groups A1 and A3 (Figure 5.17a). This was expected since Cluster group A2 includes LAs with a more remote and rural character. Based on Broad Habitats (BH) classified from both IRS Level 3 Property Types and LCS88 classes, Cluster group A3 is dominated by grassland wildfires and has the greater proportion of wildfires on built-up areas. Grassland fires are also frequent within Cluster group A1, but this group also has the greater proportion of woodland fires (mainly for mixed woodlands and conifer forests) and of fires on arable land (Figure 5.17b).
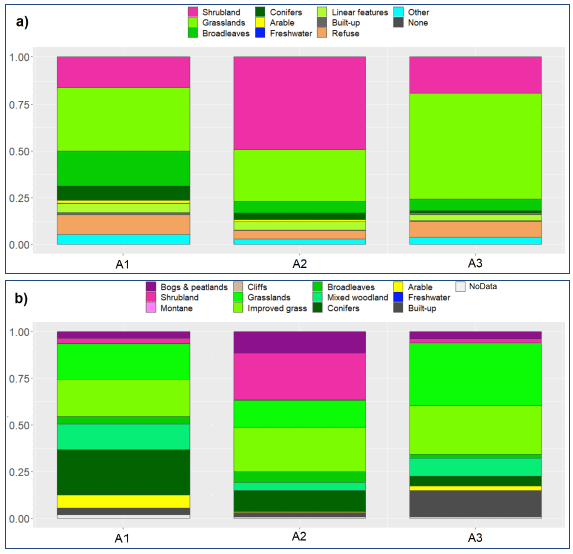
Similar patterns of fuel type composition emerge for the Cluster B groups (Figure 5.18). More than half of wildfires included in Cluster group B4 were on shrub using BHs based on Level 3 Property types, while wildfires on bogs and peatlands and on shrubland were the dominant in group B4 based on LCS88 classes. This was expected based on information given in Tables 5.36 and 5.37 for the Highland and Na h-Eileanan Siar areas. Based on BHs classified from both IRS Level 3 Property Types and LCS88 classes, Cluster group B2 is dominated by grassland wildfires and has the greater proportion of wildfires on built-up areas. Grassland fires are also frequent within Cluster group B1, but this group also has the greater proportion of woodland fires (mainly for conifer forests), while Cluster group B3 had the greater proportion of wildfires on improved grassland and on mixed woodland (Figure 5.18b).
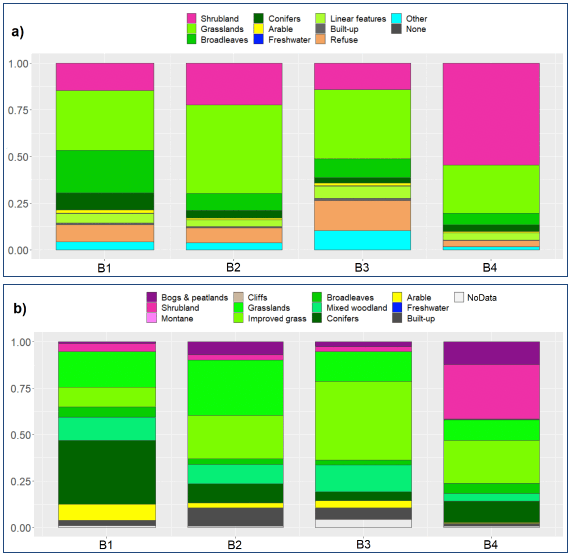
5.4.4 Ignition motives
Figure 5.19a shows that one of the main parameters causing the split between Cluster (sub) groups A1 and A3 is the motive of ignition. While both Cluster groups A1 and A3 consist of wildfires in more urban or accessible rural areas, Cluster group A3 consists almost exclusively of wildfires caused by deliberate ignitions, compared to Cluster group A2, where deliberate wildfires are also the most frequent ones but there are also important proportions of wildfires with an accidental or unknown motive of ignition. On the other hand, accidental ignitions followed by unknown ignitions were the most frequent motives for the wildfires belonging to Cluster group A2.
Ignition motive was not used in the analysis for Cluster B groups. As expected, accidental wildfires were the dominant ones in Cluster group B4 (Highland and Na h-Eileanan Siar areas), which also had the smaller proportion of wildfires caused by deliberate ignitions between the different cluster groups (Figure 5.19b). Cluster group B1 had the second greater proportion of accidental wildfires, but deliberate ignitions were the most frequent in this group and in Cluster groups B2 and B3, both of which had similar proportion of wildfires with accidental, deliberate and unknown motives.
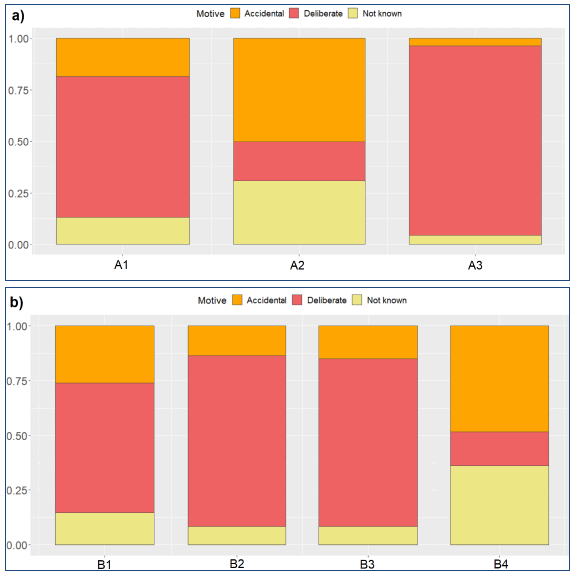
5.4.5 Burnt area size
Figure 5.20a shows that most of the smaller wildfires with estimated burnt areas less than 100 m2 are found in Cluster groups A1 and A3, while the bigger wildfires with burnt areas between 100 m2 and 1,000 m2 and more than 1,000 m2 are more frequent in Cluster group A2. Looking at Cluster B groups (Figure 5.20b), most of the bigger wildfires (>1,000 m2) are found in Cluster group B4, while Cluster groups B2 and B4 have almost equal proportions of wildfires with burnt areas between 100 m2 and 1,000 m2. Cluster groups B1 and B3 have similar proportions of wildfires falling in the different damage area classes.
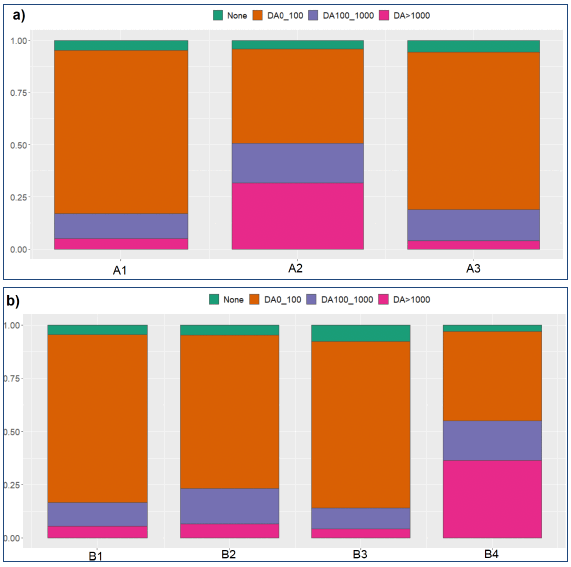
5.4.6 Urban – Rural Classification
Based on Figure 5.21a, most wildfires in Cluster group A2 occurred in very remote areas (66%), while an almost equal number of wildfires occurred in remote and accessible rural areas (around 16% of all wildfires for both areas). Cluster groups A1 and A3 showed similar patterns with regards to the number of wildfires within the different folds of the Urban Rural classification. This was expected because wildfires belonging to both clusters occurred mostly within accessible rural areas; the difference being that these wildfires were slightly more frequent in Cluster group A1 than in group A3 (82% compared to 69%). On the other hand, around 10% of wildfires in Cluster group A3 occurred in urban areas, which was the greatest proportion between the three Cluster A groups.
Regarding Cluster B groups (Figure 5.21b), most wildfires in Cluster group B4 occurred in very remote areas (67%), while, as in the case of Cluster group A2, an almost equal number of wildfires occurred in remote and accessible rural areas (around 16% of all wildfires for both areas). Cluster groups B1 and B3 had similar proportions of wildfires in accessible rural areas (78% and 74%, respectively), but a greater proportion of wildfires in very remote areas was found in Cluster group B3 than in group B1 (14% compared to 3%) and a greater proportion of wildfires in remote areas occurred in Cluster group B1 than in group B3 (13% compared to 3%). Cluster group B2 shows a pattern that is intermediate to Clusters groups B1 and B3 and Cluster group B4, with 67% of wildfires in this group occurring in accessible rural areas, 16% of wildfires occurring in remote areas and 8% of wildfires occurring in very remote areas.
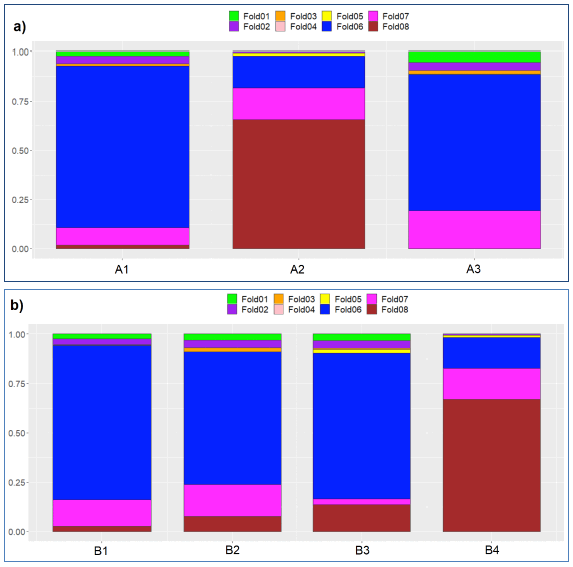
5.4.7 Conclusions
The results of the cluster analysis revealed clear groupings of LAs that were based on similarities regarding wildfire occurrence patterns and characteristics:
- LAs where bigger wildfires, in terms of larger burnt area sizes, caused by accidental ignitions are more frequent and more likely to occur that mainly affect remote seminatural habitats (i.e., bogs and peatland and heathlands/shrubland) (Cluster group A2). When motive of ignition is ignored, then the bigger and very remote wildfires affecting bogs and peatlands and heathlands are mainly found in Cluster group B4 (Highland and Na h-Eileanan Siar areas), while other wildfires mainly on shrubs and seminatural grasslands in accessible and remote rural areas are found in Cluster group B2, which consists of LAs located in the central and south-western parts of Scotland.
- LAs where small or smaller wildfires, mainly on grassland and in proximity of urban areas or in relatively accessible rural areas, are more frequent and that are caused by either a mix of ignition motives (Cluster group A1) or predominantly by deliberate ignitions (Cluster group A3). Again, when motive is removed from the analysis, LAs with smaller wildfires in relatively accessible rural areas and located at central and eastern Scotland are split mainly based on fuel type composition between those where woodland fires are dominant (Cluster group B1) and those where fires on (mainly improved) grassland are dominant (Cluster group B3).
We need to stress that since this is a data-driven approach, its outcomes depend purely on the variables used to conduct the analysis. For example, splitting between Cluster groups A1 and A3 seemed to be greatly influenced by the motive of ignition, while removing this variable changed the outcome of the analysis to a certain degree and resulted in different cluster groupings. However, this approach provides an objective way to identify LAs with similarities in their wildfire occurrence patterns, which could be useful for making decisions about prioritising areas of certain wildfire patterns or characteristics to improve preparedness or enhancing the wildfire suppression capability of certain regional SFRS regional stations.
Contact
Email: alison.seton@gov.scot