Pesticide usage in Scotland: Outdoor Vegetable Crops 2021
This publication presents information from a survey of pesticide use on outdoor vegetable crops in Scotland during 2021.
Part of
2021 Pesticide usage
Vining peas
- An estimated 9,458 hectares of vining peas were gown in Scotland in 2021, an increase of 16 per cent since 2019
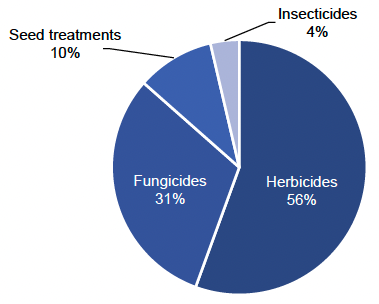
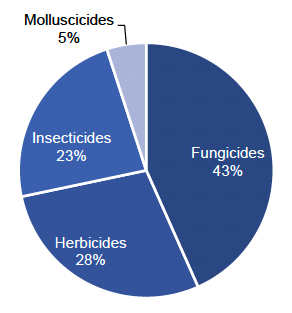
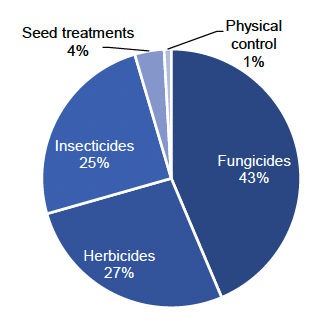
- 97 per cent of the crop was treated with a pesticide (see Figure 9 for types of pesticides used)
- Pesticide formulations were applied to 22,535 treated hectares with 13,738 kilograms of pesticide applied in total (see summary table below)
- Vining pea crops received on average 2.1 pesticide applications (Table 1). These applications included 1.3 herbicides (applied to 94 per cent of the crop area) and one fungicide (applied to 74 per cent of the crop area)
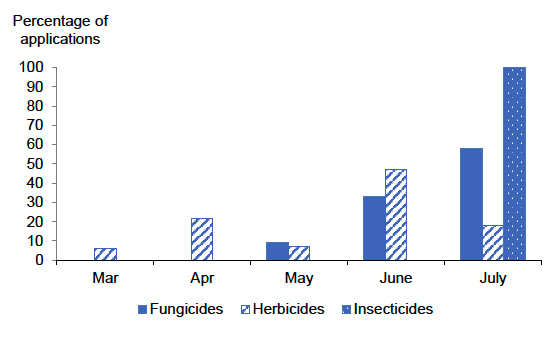
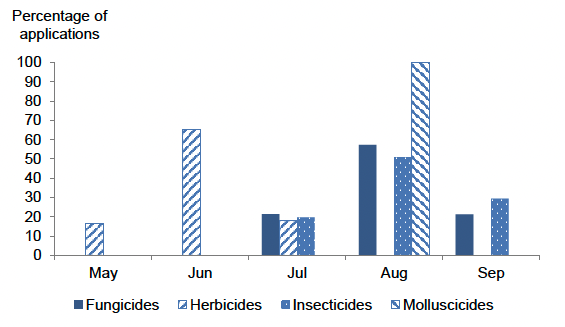
- Timing of pesticide applications are shown in Figure 10
- The only reasons specified for herbicide and fungicide use were general weed (10 per cent) and disease control (18 per cent). There were no reasons recorded for insecticide use
- The most common varieties encountered were Kimberley and Corus accounting for 29 and 25 per cent of the sample respectively, and Romance and Spandimo both accounting for seven per cent of the sample area
Summary of pesticide use on vining peas:
| Pesticide group | Formulation area treated | Weight of pesticides applied | Percentage of crop treated | Most used formulations |
|---|---|---|---|---|
| ha | kg | % | ha | |
| Fungicides | 6,975 | 1,796 | 74 | Boscalid/pyraclostrobin (6,975) |
| Herbicides | 12,522 | 11,538 | 94 | Imazamox/pendimethalin (8,893) |
| Insecticides | 822 | 115 | 9 | Pirimicarb (822) |
| Seed treatments | 2,217 | 288 | 23 | Cymoxanil/fludioxonil/ metalaxyl-M (2,217) |
| All pesticides | 22,535 | 13,738 | 97 |
Brussels sprouts
- An estimated area of 1,173 hectares was grown in Scotland in 2021. This represents an increase of 26 per cent since 2019
- 94 per cent of Brussels sprouts crop was grown from transplants
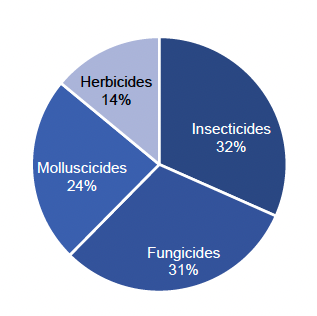
- 100 per cent of the crop was treated with a pesticide (see Figure 11 for types of pesticides used)
- Pesticide formulations were applied to 34,743 treated hectares with 7,165 kilograms of pesticide applied in total (see summary table below)
- The Brussels sprouts crop received on average 17.4 pesticide applications (Table 1). These applications included 6.9 molluscicides, 6.8 fungicides, 5.6 insecticides and 3.1 herbicides (each applied to 100 per cent of the crop area)
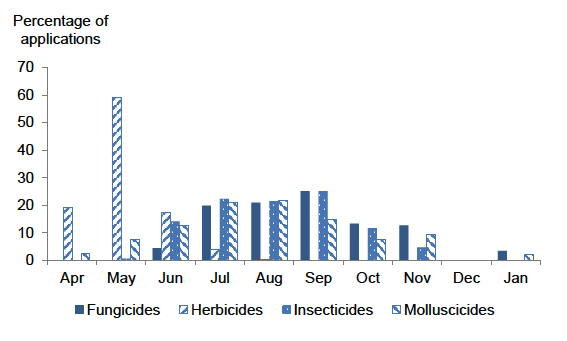
- Timing of pesticide applications are shown in Figure 12
- The only reason specified for fungicide use was disease control (27 per cent of use). Aphids were the only reason specified for insecticide applications (11 per cent of total use). Reasons for herbicide applications were supplied for 15 per cent of total use, 13 per cent for general weed control and two per cent for couch grass
- The most common varieties encountered were Petrus, Gladius and Doric, accounting for 25, 16 and 13 per cent of the sample area respectively
Summary of pesticide use on Brussels sprouts:
| Pesticide group | Formulation area treated | Weight of pesticides applied | Percentage of crop treated | Most used formulations |
|---|---|---|---|---|
| ha | kg | % | ha | |
| Fungicides | 10,688 | 2,635 | 100 | Prothioconazole (2,905) |
| Herbicides | 4,866 | 2,915 | 100 | Clomazone (1,172), metazachlor (1,172), pendimethalin (1,172) |
| Insecticides | 10,988 | 402 | 100 | Lambda-cyhalothrin (3,305) |
| Molluscicides | 8,201 | 1,213 | 100 | Ferric phosphate (5,097) |
| All pesticides | 34,743 | 7,165 | 100 |
Calabrese
- An estimated area of 1,786 hectares of calabrese were grown in Scotland in 2021, an increase of 20 per cent since 2019. This included 1,779 hectares recorded in the 'calabrese' census category with the remainder recorded in the 'other vegetable' category
- All the calabrese crop was grown from transplants
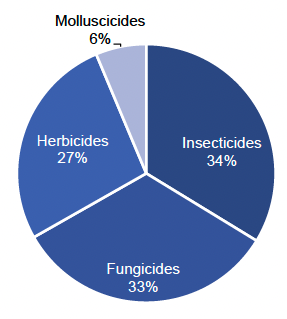
- 100 per cent of the crop was treated with a pesticide (see Figure 13 for types of pesticides used)
- Pesticide formulations were applied to 7,635 treated hectares with 3,163 kilograms of pesticide applied in total (see summary table below)
- The calabrese crop received on average 3.9 pesticide applications (Table 1). These applications included 3.1 fungicides, 1.7 insecticides and 1.7 herbicides (each applied to 60 per cent of the crop area) and one molluscicide (applied to 21 per cent of the crop area)
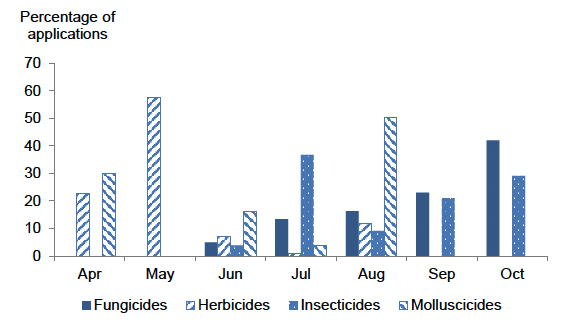
- Timing of pesticide applications are shown in Figure 14
- There were no specified reasons given for pesticide use on calabrese
- The most common variety encountered was Parthenon, accounting for 86 per cent of the sample area
Summary of pesticide use on calabrese:
| Pesticide group | Formulation area treated | Weight of pesticides applied | Percentage of crop treated | Most used formulations |
|---|---|---|---|---|
| ha | kg | % | ha | |
| Fungicides | 3,309 | 1,198 | 60 | Copper oxychloride (1,562) |
| Herbicides | 2,165 | 1,739 | 60 | Metazachlor (1,033) |
| Insecticides | 1,779 | 146 | 60 | Spinosad (1,428) |
| Molluscicides | 382 | 79 | 21 | Ferric phosphate (382) |
| All pesticides | 7,635 | 3,163 | 100 |
Other brassica crops
- Other brassica crops encountered in the 2021 survey were red, Chinese, summer/autumn and winter cabbage as well as cauliflower, kale and purple sprouting broccoli (some of which was recorded in the 'other vegetable' census category). In previous publications cabbages were reported separately but this was not possible in 2021 or 2019 due to reduced area of crop encountered in the sample
- The total estimated area of other brassica crops was 1,322 hectares
- 62 per cent of other brassica crops were grown from transplants
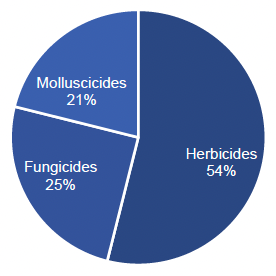
- 62 per cent of the other brassica crop was treated with a pesticide (see Figure 15 for types of pesticides used)
- Pesticide formulations were applied to 4,700 treated hectares with 2,795 kilograms of pesticide applied in total (see summary table below)
- The 62 per cent of other brassica crops treated with a pesticide received on average 4.7 pesticide applications (Table 1). These applications included two herbicides and 1.4 fungicides (each applied to 62 per cent of the crop area) and 1.5 molluscicides (applied to 50 per cent of the crop area)
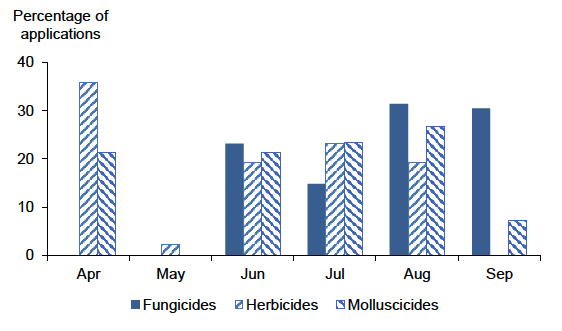
- Timing of pesticide applications are shown in Figure 16
- Disease control and downy mildew were the only specified reasons reported for fungicide application (31 per cent and 13 per cent respectively). Reasons were supplied for 26 per cent of total herbicide use all of which was general weed control.
Summary of pesticide use on other brassica crops:
| Pesticide group | Formulation area treated | Weight of pesticides applied | Percentage of crop treated | Most used formulations |
|---|---|---|---|---|
| ha | kg | % | ha | |
| Fungicides | 1,174 | 458 | 62 | Azoxystrobin (784) |
| Herbicides | 2,534 | 2,157 | 62 | Metazachlor (683) |
| Molluscicides | 992 | 180 | 50 | Ferric phosphate (992) |
| All pesticides | 4,700 | 2,795 | 62 |
Carrots
- An estimated 3,449 hectares of carrots was grown in Scotland in 2021, an increase of three per cent since 2019
- 73 per cent of the crop was treated with a pesticide (see Figure 17 for types of pesticides used). Pesticide formulations were applied to 48,964 treated hectares with 15,611 kilograms of pesticide applied in total (see summary table below)
- The 73 per cent of carrot crop treated with a pesticide received on average 10.9 applications (Table 1). These applications included 7.1 fungicides, 4.8 insecticides, 3.3 herbicides and one physical control (applied to 71, 73, 73 and 13 per cent of the crop area respectively)
- Timing of pesticide applications is shown in Figure 18
- Reasons for fungicide applications were supplied for 47 per cent of total use; 24 per cent for Sclerotinia, eight per cent for disease control, six per cent for Alternaria, five per cent for crown rot, three per cent for cavity spot, Botrytis one per cent and light leaf spot less than one per cent
- Reasons for insecticide/nematicide applications were supplied for 22 per cent of total use; 20 per cent for carrot fly, one per cent for nematodes and less than one per cent for aphids and cutworms. Reasons for physical control (all garlic based) were supplied for less than one per cent of total use with the only reason supplied being for nematode control
- Reasons for herbicide applications were supplied for 31 per cent of total use; seven per cent for both annual broadleaved weeds and general weed control, six per cent for annual meadow grass, three per cent for broadleaved weeds, two per cent for mayweed and grass weed control and one per cent for both control of cover crops and volunteer cereals
- The most common variety encountered was Nairobi, accounting for 76 per cent of the sample area surveyed
Summary of pesticide use on carrots:
| Pesticide group | Formulation area treated | Weight of pesticides applied | Percentage of crop treated | Most used formulations |
|---|---|---|---|---|
| ha | kg | % | ha | |
| Fungicides | 21,361 | 6,171 | 71 | Prothioconazole (3,879) |
| Herbicides | 13,203 | 6,592 | 73 | Metribuzin (3,767) |
| Insecticides/ nematicides | 12,169 | 311 | 73 | Lambda-cyhalothrin (8,639) |
| Seed treatments | 1,796 | 51 | 45 | Cymoxanil/fludioxonil/ metalaxyl-M (1,064) |
| Physical control | 435 | 2,487 | 13 | Garlic (435) |
| All pesticides | 48,964 | 15,611 | 73 |
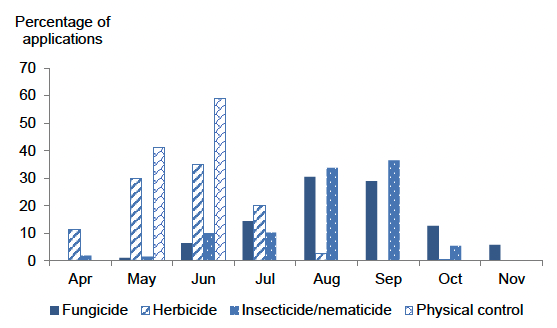
Note: there were small amounts (< one per cent) of insecticide/nematicide application in March which are not shown on this figure.
Turnips and swedes
- The total estimated area of turnips and swedes grown in 2021 was 1,933 hectares, representing a 38 per cent increase from 2019. 1,621 hectares were recorded in the 'turnips & swedes' census category and 312 hectares were recorded in the 'other vegetable' census category
- 77 per cent of the turnip and swede crop was treated with a pesticide (see Figure 19 for types of pesticides used)
- Pesticide formulations were applied to 10,178 treated hectares with 1,878 kilograms of pesticide applied in total (see summary table below)
- The turnip and swede crop received on average 4.4 pesticide applications (Table 1). These applications included 2.4 insecticides (applied to 71 per cent of the crop area), 1.7 fungicides and one herbicide (each applied to 77 per cent of the crop area) as well as one molluscicide (applied to 33 per cent of the crop area)
- Timing of pesticide applications is shown in Figure 20
- Disease control was the only specified reason for the use of fungicides (11 per cent). Reasons for herbicide applications were supplied for 21 per cent of total use; all of which was for general weed control. There were no specified reasons given for insecticide use
- The most common varieties encountered were Magres and Tweed accounting for 57 per cent and 23 per cent of the sample area surveyed respectively
Summary of pesticide use on turnips and swedes:
| Pesticide group | Formulation area treated | Weight of pesticides applied | Percentage of crop treated | Most used formulations |
|---|---|---|---|---|
| ha | kg | % | ha | |
| Fungicides | 3,364 | 866 | 77 | Prothioconazole (1,141) |
| Herbicides | 2,737 | 866 | 77 | Metazachlor (1,491) |
| Insecticides | 3,433 | 52 | 71 | Deltamethrin (2,558) |
| Molluscicides | 644 | 94 | 33 | Ferric phosphate (542) |
| All pesticides | 10,178 | 1,878 | 77 |
Note: there were small amounts (< one per cent) of insecticide and fungicide applications on turnips and swedes in November 2021 which are not shown on this figure.
Other vegetable crops
- Other vegetable crops encountered in the 2021 survey were broad beans, leeks, lettuce, celery, fennel, French beans, Jerusalem artichoke, pumpkin, runner beans, spring onions, beetroot, chard, parsnips, onions and rhubarb
- The total estimated area of other vegetable crops was 2,945 hectares. No multi-cropping was encountered during the 2021 survey
- Nine per cent of other vegetable crops were grown from transplants
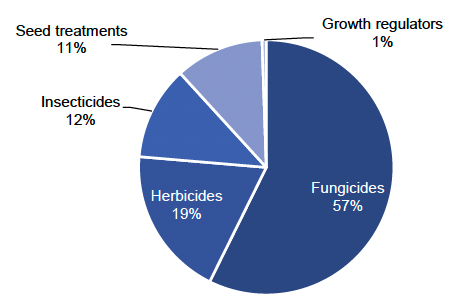
- 88 per cent of other vegetable crops were treated with a pesticide (see Figure 21 for types of pesticides used)
- Pesticide formulations were applied to 20,475 treated hectares with 9,281 kilograms of pesticide applied in total (see summary table below)
- The 88 per cent of the other vegetable crop treated with a pesticide received on average 6.4 pesticide applications (Table 1). These applications included 4.3 fungicides 1.2 herbicides (each applied to 88 per cent of the crop area) and one insecticide (applied to 80 per cent of the crop area)
- Timing of pesticide applications is shown in Figure 22
- The only reason supplied for herbicide applications was general weed control (65 per cent). General disease control (79 per cent), downy mildew and Botrytis (one per cent or less each) were the only specified reasons for fungicide use. The only stated reason for insecticide applications was for aphids (100 per cent)
Summary of pesticide use on other vegetable crops:
| Pesticide group | Formulation area treated | Weight of pesticides applied | Percentage of crop treated | Most used formulations |
|---|---|---|---|---|
| ha | kg | % | ha | |
| Fungicides | 11,688 | 5,358 | 88 | Cyprodinil/fludioxonil (4,615) |
| Herbicides | 3,879 | 3,103 | 88 | Imazamox/pendimethalin (2,293) |
| Insecticides | 2,422 | 329 | 80 | Pirimicarb (2,293) |
| Growth regulators | 109 | 262 | 4 | Maleic hydrazide (109) |
| Molluscicides | 84 | 18 | 3 | Ferric phosphate (84) |
| Seed treatments | 2,293 | 212 | 78 | Cymoxanil/fludioxonil/ metalaxyl-M (2,293) |
| All pesticides | 20,475 | 9,281 | 88 |
Note: molluscicides have been excluded as their use represents < 0.5 per cent quantity applied.
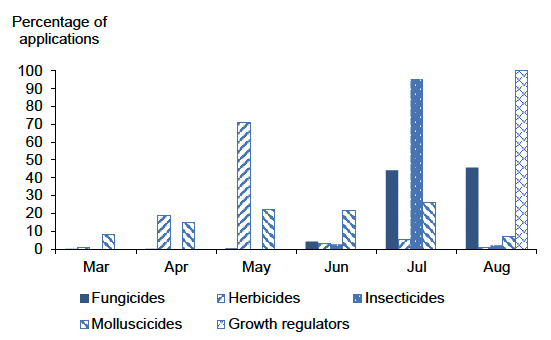
Note: there were small amounts (< two per cent) of fungicide applications on other vegetable crops in September, October, December 2021 & March 2022 which are not shown on this figure.
Contact
Email: psu@sasa.gov.scot