Pesticide usage in Scotland: Outdoor Vegetable Crops 2021
This publication presents information from a survey of pesticide use on outdoor vegetable crops in Scotland during 2021.
Part of
Appendix 4 – Survey methodology
Sampling and data collection
Using the June 2021 Agricultural Census(11), a sample was drawn representing vegetable cultivation in Scotland. The first sample was selected from holdings growing any vegetable crops excluding vining peas, and the second from holdings known to have grown vining peas. Two samples were taken to achieve a better representation of all vegetable crops, as most vining pea crops are grown on farms growing arable crops rather than vegetable crops.
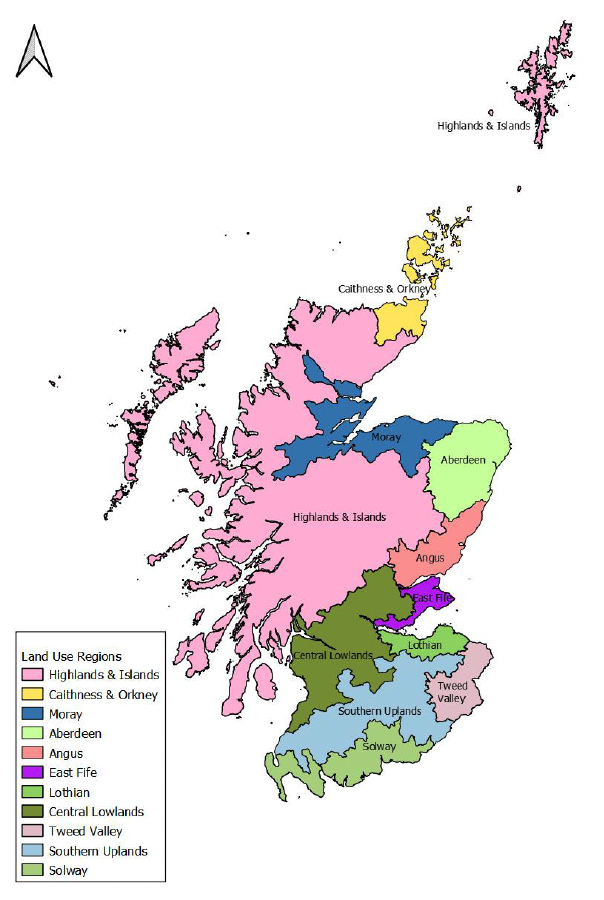
The country was divided into 11 land-use regions (Figure 23). Each sample was stratified by these land-use regions and according to holding size. The holding size groups were based on the total area of either vegetable or vining peas crops grown. The sampling fractions used within both regions and size groups were based on the areas of relevant crops grown rather than number of holdings, so that smaller holdings would not dominate the sample.
The survey covered pesticide applications to vegetable crops where all or the majority of the growing season was in 2021. As well as recording treatments applied directly to the crop, data was also collected on land preparation treatments prior to sowing or planting the crop.
Following an introductory letter and phone call, data was collected during a phone interview or by email. Where necessary, information was also collected from agronomists and contractors. In total, information was collected from 51 holdings growing vegetable crops and 22 holdings growing only peas (Tables 21 & 22), (with a further five pea holdings also growing veg, 9 veg holdings also growing peas, and one pea holding with no peas, growing only veg). These 73 holdings represent 10 per cent of the total crop area grown.
Raising factors
National pesticide use was estimated by ratio raising. This is a standard statistical technique for producing estimates from a sample. It is the same methodology used by the other UK survey teams and has been used for all historical datasets produced by the Pesticide Survey Unit, allowing comparability over time. The sample data were multiplied by raising factors (Tables 27 and 28). These factors were calculated by comparing the sampled area to the areas recorded in the Agricultural Census within each region and size group. An adjustment (Table 29) was made for each crop within each region by applying the raising factors to the sample area of each crop grown and comparing this with the census area. This adjustment modifies the estimate to take into account differences in composition of crops encountered in the sample and those present in the population. A second adjustment was necessary for some crops which were present in the population but were not encountered in the sample in some strata.
Changes from previous years
There are a number of changes which should be noted when comparing the 2021 data with the previous survey.
For the first time, broad beans have been included in the 'other vegetables' category. This is due to too few crops being encountered in the holdings sampled in 2021 to adequately represent usage. This must be taken into account when comparing both legume and other vegetable data between surveys.
In contrast to previous years, relative standard errors are not reported for constituent crop groups due to the small sample size of some crops encountered in some regions which presented issues with RSE calculation. Alternative methods for calculating RSEs for minor crops with low sample numbers are being investigated.
The previous reports in 2015 and 2019 contained information about grower adoption of Integrated Pest Management (IPM). IPM data was not collected during the 2021 survey. It is anticipated that IPM data will be collected and published every 4 years. This allows IPM uptake to be monitored over time but reduces the burden on growers and surveyors.
Data quality assurance
The dataset undergoes several validation processes as follows; (i) checking for any obvious errors upon data receipt (ii) checking and identifying inconsistencies with use and pesticide approval conditions once entered into the database (iii) 100 per cent checking of data held in the database against the raw data. Where inconsistencies are found these are checked against the records and with the grower if necessary. Additional quality assurance is provided by sending reports for review to members of the Working Party on Pesticide Usage Surveys and other agricultural experts. In addition, the Scottish pesticide survey unit is accredited to ISO 9001:2015. All survey related processes are documented in Standard Operating Procedures (SOPs) and our output is audited against these SOPs by internal auditors annually and by external auditors every three years.
Main sources of bias
The use of a random stratified sample is an appropriate survey methodology. A stratified random sample, grouped by farm size and region, is used to select holdings used in this survey. Sampling within size groups is based on area rather than numbers of holdings, so that smaller size groups are not over-represented in the sample. The pesticide survey may be subject to measurement biasas it is reliant on farmers/growers recording data accurately. As this survey is not compulsory it may also subject to non-response bias, as growers on certain farm/holding types may be more likely to respond to the survey than others. Reserve lists of holdings are held for each stratum to allow non-responding holdings to be replaced with similar holdings.
Experience indicates that stratified random sampling, including reserves, coupled with personal interview technique, delivers the highest quality data and minimises non-response bias.
Contact
Email: psu@sasa.gov.scot