
National Mission on Drugs: annual monitoring report 2024-2025
This third annual monitoring report provides an analysis of the progress made between April 2024 and March 2025 on the National Mission to reduce drug deaths and improve lives.
6. Outcome 3: People most at risk have access to treatment and recovery
6.1 Summary
Headline metrics
Number of referrals resulting in treatment starting: 14,355 referrals resulting in treatment starting in 2024/25. Decrease of 5% since 2023/24. Broadly in line with the level at the start of the National Mission.
Percentage of ADP areas with near-fatal overdose referral pathways: 100% of ADP areas had referral pathways in place in 2024/25 for people who experience a near-fatal overdose. In line with 2022/23 and 2023/24.
Commentary: Available evidence suggests access to specialist treatment and recovery services has been broadly stable, but there are limitations in understanding of the unmet need among those most at risk.
6.2 Background
Evidence shows that service contact and treatment protect against drug-related harms and deaths[20],[21] meaning it is vital to understand treatment and support pathways. For those most at risk, this can be explored using data on referrals resulting in treatment starting, near-fatal overdose pathways, and waiting times. Additional context is provided by understanding how people at risk are proactively identified and offered support (MAT 3), and how pathways between the criminal justice system and specialist services are utilised.
6.3 Headline metrics
6.3.1 Headline metric: Number of referrals resulting in treatment starting
Progression of referrals to treatment start provides an indication of access to specialist treatment services. There were 14,355 referrals resulting in community-based specialist drug or drug and alcohol treatment starting in 2024/25 (Figure 7). This was 5% (797) fewer than in 2023/24 when 15,152 referrals resulted in treatment starting. Although the number of referrals leading to treatment has varied from quarter to quarter, it remains broadly consistent with the level seen at the start of the National Mission.[22]
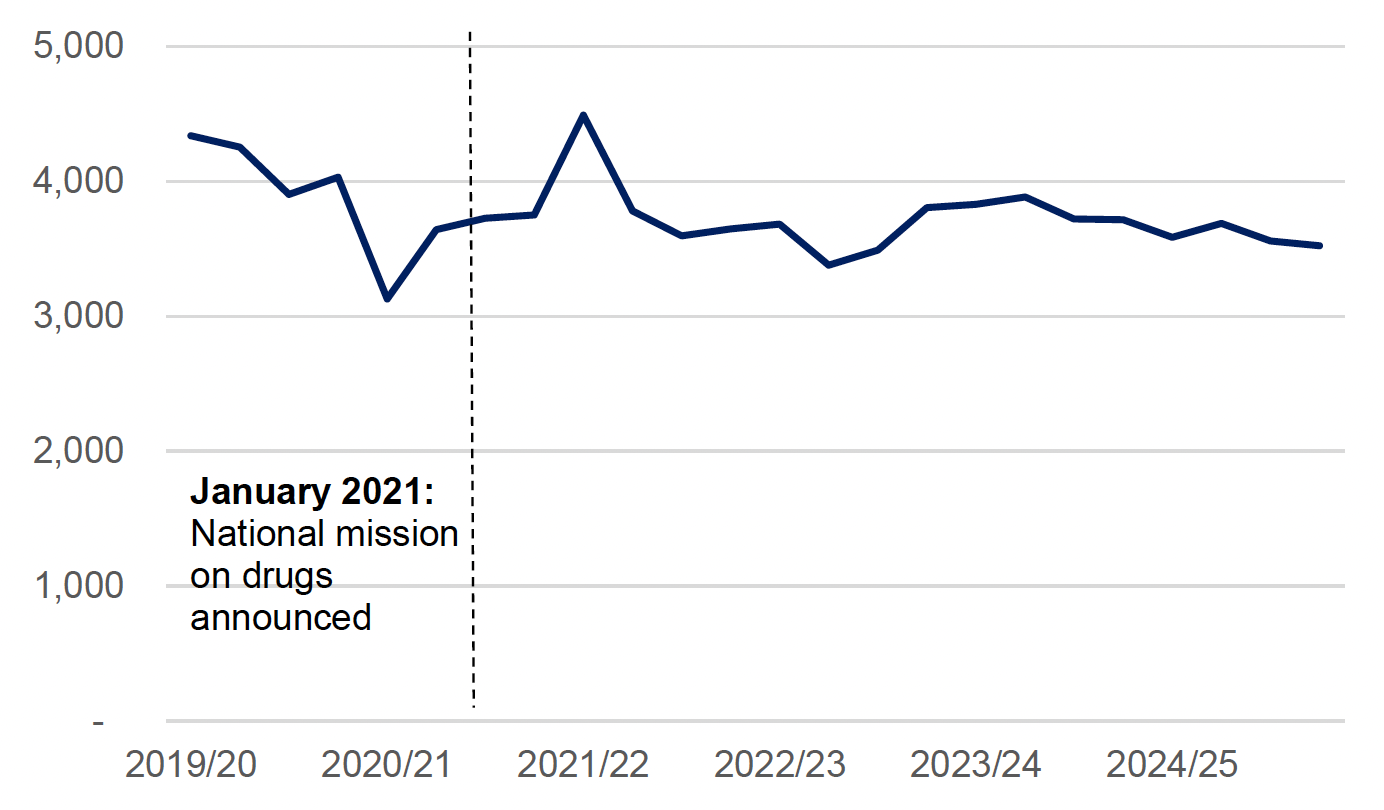
Source: National drug and alcohol treatment waiting times dashboard, Public Health Scotland, December 2025 (data extracted May 2026)
Note that the number of referrals does not directly represent the number of people referred – where individuals are referred to multiple service providers they will have more than one referral. The Drug and Alcohol Information System (DAISy) is a dynamic source of data, which means the information extracted for reporting is a snapshot of the data that are on the system at that time. As such, data for previous quarters may not be the same as found in previous publications for the same time period.
6.3.2 Headline metric: ADP areas where referral pathways are in place for people who experience a near-fatal overdose
Data on areas referral pathways aim to provide insight into access to treatment and recovery services. In 2024/25, all ADPs reported having referral pathways in place in their area to ensure people who experience a near-fatal overdose are identified and offered support. This is consistent with the findings from both the 2022/23 and 2023/24 surveys. Pathways were in place through both the Scottish Ambulance Service and specialist substance use treatment services in all ADP areas. Near-fatal overdose pathways were also commonly reported to be in place through hospitals, Police Scotland and third sector substance use services.[23]
These data are self-reported by ADP lead officers and do not provide insight into service uptake. Geographic distribution, and the number or range of settings within an ADP area providing the service are also not captured.
6.4 Supporting metrics
6.4.1 Supporting metric: Percentage of referrals resulting in treatment starting within three weeks or less
Waiting times provide a measure of the ability of the system to meet the demand for specialist treatment and the capacity to deliver care. Scottish Government has an established target that 90% of people referred for help with problematic drug or alcohol use will wait no longer than three weeks for specialist treatment that supports their recovery. In 2024/25, 95% of referrals for community-based specialist drug or drug and alcohol treatment resulted in treatment starting within three weeks or less. This is a small increase on the previous year (2023/24: 93%) and in line with the start of the National Mission (2020/21: 95%).[24]
Note that the number of referrals does not directly represent the number of people referred – where individuals are referred to multiple service providers they will have more than one referral.
6.4.2 Supporting metric: Percentage of ADP areas where MAT standard 3 has been fully implemented
The aim of MAT standard 3 is to ensure that all people at high risk of drug-related harm are proactively identified and offered support to commence or continue MAT. Nearly all locality areas have been able to confirm the implementation of MAT 3. In 2024/25 the standard was assessed as fully implemented (green) or sustained (blue), in 90% of ADP areas and partially implemented (provisional green) in 10% of ADP areas.[25]
This metric is based on data collected for quality, measuring progress towards national standards rather than outcomes; data are gathered locally using separate systems, with no single national data collection system.
6.4.3 Supporting metric: Percentage of ADP areas supporting referrals within the criminal justice system to specialist treatment services
This data aims to provide insight into the availability of pathways to specialist treatment for people engaged in the justice system, who are often at higher risk of drug-related harms. The percentage of ADP areas reporting that they fund or support referrals to drug and alcohol treatment services varies by stage of engagement with the criminal justice system, but has increased at every stage:
- Pre-arrest: 60% of ADP areas (up from 53% in 2023/24 and 38% in 2022/23).
- In police custody: 87% of ADP areas (up from 80% in 2023/24 and 66% in 2022/23).
- In courts: 50% of ADP areas (up from 43% in 2023/24, data not available for 2022/23).
- In prison: 80% of ADP areas (up from 67% in 2023/24, data not available for 2022/23).
- Upon release: 100% of ADP areas (up from 90% in 2023/24 and 79% in 2022/23).
These data are self-reported by ADP lead officers and do not provide insight into service uptake. Geographic distribution, and the number or range of settings within an ADP area are also not captured.[26]