Long-term monitoring of health inequalities: March 2022 report
Annual update of the long-term monitoring of health inequalities headline indicators.
Premature mortality (under 75 years)
In 2020, the gap in premature mortality rates between the most and least deprived areas increased to its highest point since 2004 (680.4 per 100,000 and 683.2 per 100,000 respectively), and is higher than at the start of the time series (648.7 per 100,000 in 1997). Relative inequalities have widened over the long term and are now at the highest point in the time series (1.52).
In 2020, premature mortality rates were 4 times higher in the most deprived areas compared to the least deprived, an increase from 3 times higher in 1997.
National Records of Scotland (NRS) have undertaken analysis looking at deaths occurring in Scotland since the start of the COVID-19 pandemic4. According to analysis using data from March 2020 to November 2020, the age-standardised mortality rate from all causes was 1,176 per 100,000 population, higher than the age-standardised mortality rate from all causes in 2019 which was 1,108 per 100,000.
Trends in premature mortality
Over 23,300 people in Scotland died before the age of 75 in 2020.
Over the long term there has been a reduction in the mortality rate among under-75s. However, the European Age-Standardised mortality rate (EASR) among under-75s in 2020 was 457.4 per 100,000 people, the highest rate since 2010.
| Year | Number of deaths | Target population size | Rate per 100,000 (EASR) |
|---|---|---|---|
| 1997 | 26,081 | 4,740,269 | 651.9 |
| 1998 | 25,857 | 4,729,975 | 643.3 |
| 1999 | 25,491 | 4,721,298 | 632.5 |
| 2000 | 24,593 | 4,708,667 | 607.3 |
| 2001 | 24,168 | 4,703,661 | 593.1 |
| 2002 | 24,219 | 4,701,958 | 588.9 |
| 2003 | 23,789 | 4,702,431 | 573.4 |
| 2004 | 22,896 | 4,714,233 | 546.2 |
| 2005 | 22,441 | 4,735,320 | 530.3 |
| 2006 | 22,237 | 4,752,425 | 520.4 |
| 2007 | 22,359 | 4,783,452 | 516.8 |
| 2008 | 22,005 | 4,811,453 | 501.3 |
| 2009 | 21,229 | 4,835,007 | 477.0 |
| 2010 | 20,997 | 4,858,058 | 467.4 |
| 2011 | 20,685 | 4,888,316 | 456.1 |
| 2012 | 20,446 | 4,895,114 | 445.3 |
| 2013 | 20,344 | 4,903,074 | 437.5 |
| 2014 | 19,961 | 4,914,362 | 423.2 |
| 2015 | 20,988 | 4,935,283 | 440.5 |
| 2016 | 21,313 | 4,962,391 | 439.7 |
| 2017 | 20,992 | 4,976,829 | 425.2 |
| 2018 | 21,601 | 4,983,364 | 432.0 |
| 2019 | 21,501 | 4,997,455 | 425.6 |
| 2020 | 23,370 | 4,996,183 | 457.4 |
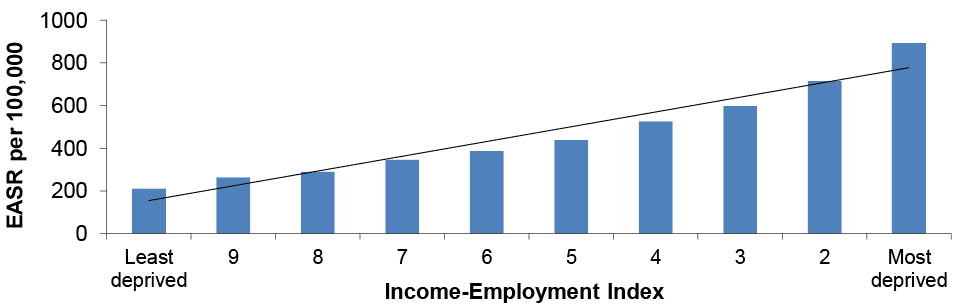
Inequalities in premature mortality, 2020
In 2020, the premature mortality rate in the most deprived areas was 891.3 per 100,000, four times higher than the rate in the least deprived areas (210.9 per 100,000).
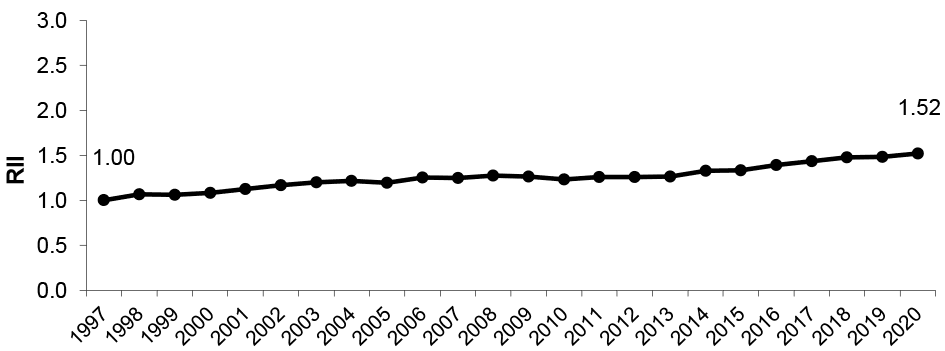
Trends in relative inequalities
Over the longer term, relative inequalities have increased. The RII for 2020 is the highest in the time series at 1.52, compared with 1.00 at the start of the time series in 1997.
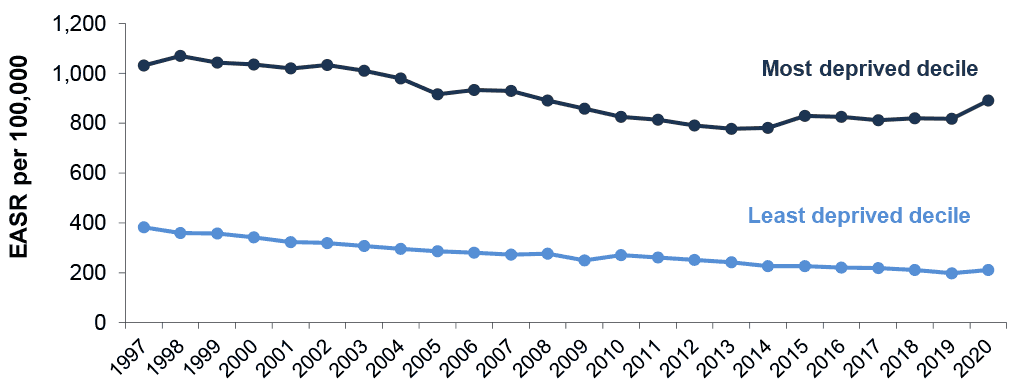
Between 1997 and 2020, premature mortality rates declined by 45% in the least deprived areas, but by only 14% in the most deprived areas in Scotland.
Between 1997 and 2014, premature mortality rates were three times higher in the most deprived areas compared to the least deprived; in the last six years premature mortality rates have been four times higher in the most deprived areas.
Trends in absolute inequalities
Absolute inequalities in premature mortality reached a peak in 2002 (713.4 per 100,000). Between 2002 and 2013 there was a general downward trend. Most notably, the absolute gap between the most and least deprived areas reduced every year between 2007 and 2013 (from 656.2 in 2007 to 536.0 in 2013). Since 2013 the gap has increased, and is currently at its highest point since 2004 at 680.4 per 100,000.
Deaths caused by COVID-19 are likely to have had an impact on the absolute gap in premature mortality between those living in the most and least deprived areas in 2020. The rate increased by 9% in the most deprived areas between 2019 and 2020, compared to an increase of 6% in the least deprived areas.
According to analysis by NRS using data from March 2020 to November 20204, after adjusting for age, people living in the most deprived areas were 2.3 times more likely to die with COVID-19 than those living in the least deprived areas. When looking at deaths from all causes the death rate is 1.9 times higher in the most deprived areas compared to the least deprived areas. The leading cause of death between March 2020 and November 2020 was COVID-19, suggesting that the pandemic will have driven an increase in inequalities between those living in the most and least deprived areas in 2020.
Contact
Email: morag.shepherd@gov.scot