Long-term monitoring of health inequalities: March 2022 report
Annual update of the long-term monitoring of health inequalities headline indicators.
Coronary Heart Disease (CHD) - deaths aged 45-74 years
Trends in CHD deaths
In 2020, nearly 2,600 deaths amongst those aged 45-74 years were attributed to CHD.
Since 1997, there has been a considerable decrease in CHD deaths amongst the population aged 45-74 years. In 2020, the death rate for this age group was 123.3 per 100,000, less than one third of the rate in 1997.
| Year | Number of deaths | Target population size | Rate per 100,000 (EASR) |
|---|---|---|---|
| 1997 | 5,887 | 1,635,590 | 372.5 |
| 1998 | 5,675 | 1,646,711 | 357.9 |
| 1999 | 5,389 | 1,658,124 | 338.9 |
| 2000 | 4,858 | 1,670,660 | 303.9 |
| 2001 | 4,483 | 1,687,422 | 279.3 |
| 2002 | 4,310 | 1,706,141 | 265.9 |
| 2003 | 4,197 | 1,727,112 | 256.3 |
| 2004 | 3,840 | 1,751,037 | 232.3 |
| 2005 | 3,721 | 1,774,865 | 222.3 |
| 2006 | 3,393 | 1,799,382 | 200.8 |
| 2007 | 3,374 | 1,827,320 | 196.6 |
| 2008 | 3,155 | 1,856,874 | 180.9 |
| 2009 | 2,857 | 1,885,693 | 160.7 |
| 2010 | 2,811 | 1,914,226 | 156.6 |
| 2011 | 2,592 | 1,941,253 | 142.6 |
| 2012 | 2,584 | 1,964,203 | 139.7 |
| 2013 | 2,515 | 1,986,202 | 133.7 |
| 2014 | 2,358 | 2,007,988 | 123.1 |
| 2015 | 2,463 | 2,026,210 | 127.4 |
| 2016 | 2,467 | 2,047,858 | 124.7 |
| 2017 | 2,476 | 2064612 | 122.2 |
| 2018 | 2,416 | 2,073,318 | 117.6 |
| 2019 | 2,333 | 2,078,411 | 112.1 |
| 2020 | 2,595 | 2,081,214 | 123.3 |
Inequalities in CHD deaths, 2020
In 2020, the CHD mortality rate was four times higher in Scotland’s most deprived areas compared to the least deprived (247.9 compared to 62.5 deaths per 100,000 population).

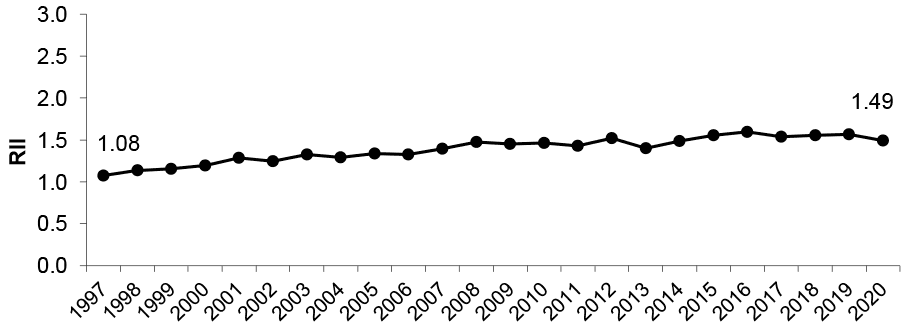
Trends in relative inequalities
Relative inequalities in CHD deaths have increased over the longer term. In 2020 the RII was 1.49, the lowest it’s been since 2014, but higher than at the start of the time series when the RII was 1.08.
In the second half of the time series, CHD mortality rates have typically been 4-5 times higher in the most deprived areas compared to the least deprived areas. This is higher than at the start of the times series when CHD mortality rates were typically 3-4 times higher.
Trends in absolute inequalities
In contrast to relative inequalities, the absolute gap between those living in the most deprived areas and those living in the least deprived areas has reduced over the longer term from a high of 390.1 per 100,000 in 1998. The gap in 2020 is 47% lower than the start of the time series (185.4 per 100,000 in 2020 compared to 347.3 per 100,000 in 1997). However, between 2019 and 2020 the CHD mortality rate increased in both the most and least deprived areas (by 14% and 40% respectively).

Contact
Email: morag.shepherd@gov.scot