Long-term monitoring of health inequalities: March 2022 report
Annual update of the long-term monitoring of health inequalities headline indicators.
Cancer deaths aged 45-74 years
In November 2021 Public Health Scotland (PHS) published the annual Cancer Mortality in Scotland report77 which included data up to 2020. In the report they note that the disruption caused by the COVID-19 pandemic has had an impact on cancer in Scotland. Some of the impacts, such as the pausing of cancer screenings and a fall in urgent referrals for suspected cancer, are better known than others. It is not clear how large the impact of the pandemic has been on patients seeking help, receiving investigations or treatment. PHS therefore undertook analysis to try and gauge the impact on cancer mortality rates. This analysis concluded that the cancer mortality rate in 2020 was within the limits which would have been expected if the pandemic had not occurred. For more information on this analysis please see Cancer Mortality in Scotland, Annual update to 2020. Public Health Scotland.
Trends in cancer deaths
In 2020 more than 7,350 adults aged 45-74 died of cancer.
The cancer mortality rate amongst those aged 45-74 years has fallen by 34% since the start of the time series (from 529.8 per 100,000 population in 1996 to 349.8 per 100,000 in 2020).
| Number of deaths | Target population size | Rate per 100,000 (EASR) | |
|---|---|---|---|
| 1996 | 8,402 | 1,631,224 | 529.8 |
| 1997 | 8,068 | 1,635,590 | 509.1 |
| 1998 | 7,995 | 1,646,711 | 501.9 |
| 1999 | 7,904 | 1,658,124 | 494.4 |
| 2000 | 7,776 | 1,670,660 | 484.8 |
| 2001 | 7,903 | 1,687,422 | 489.2 |
| 2002 | 7,850 | 1,706,141 | 481.2 |
| 2003 | 7,706 | 1,727,112 | 467.4 |
| 2004 | 7,678 | 1,751,037 | 460.9 |
| 2005 | 7,606 | 1,774,865 | 451.8 |
| 2006 | 7,486 | 1,799,382 | 441.3 |
| 2007 | 7,569 | 1,827,320 | 439.5 |
| 2008 | 7,536 | 1,856,874 | 431.0 |
| 2009 | 7,481 | 1,885,693 | 421.2 |
| 2010 | 7,394 | 1,914,226 | 411.1 |
| 2011 | 7,428 | 1,941,253 | 408.5 |
| 2012 | 7,514 | 1,964,203 | 406.2 |
| 2013 | 7,520 | 1,986,202 | 399.8 |
| 2014 | 7,445 | 2,007,988 | 389.6 |
| 2015 | 7,621 | 2,026,210 | 392.9 |
| 2016 | 7,385 | 2,047,858 | 373.5 |
| 2017 | 7,342 | 2,064,612 | 363.6 |
| 2018 | 7,531 | 2,073,318 | 367.0 |
| 2019 | 7,487 | 2,078,664 | 360.0 |
| 2020 | 7,362 | 2,081,213 | 349.8 |
Inequalities in cancer deaths, 2020
The analysis by PHS suggests that inequalities in cancer mortality did not change significantly in the first year of the pandemic. For more information on the analysis please see Cancer Mortality in Scotland, Annual update to 2020. Public Health Scotland7.
Of people in the 45-74 year age group, those living in Scotland’s most deprived areas were more than twice as likely to die of cancer than those in the least deprived areas (573.7 deaths per 100,000 population compared to 220.0 per 100,000 population, in 2020).
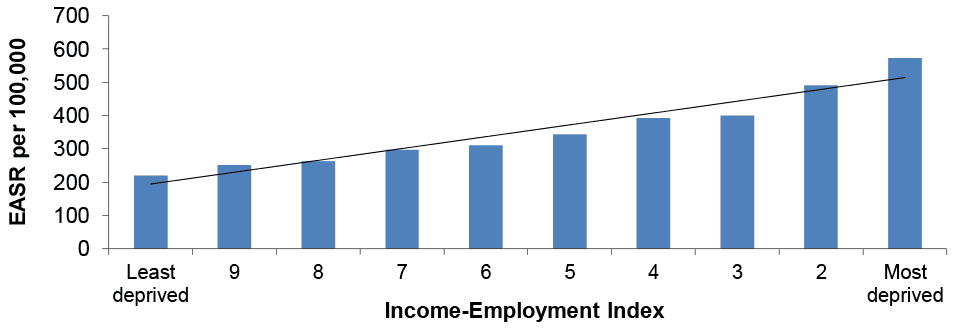
As is the case for cancer incidence, inequality levels vary when examining deaths by cancer type[ii]. As described in the previous section, variations in screening uptake may lead to socially patterned rises in cancer incidence and, in turn, cancer survival (therefore having a possible effect on mortality) for some types of cancer.
The largest differences between rates in the most and least deprived areas are again observed for cancer of the trachea, bronchus and lung (210.3 compared to 37.5 per 100,000 population in 2020).
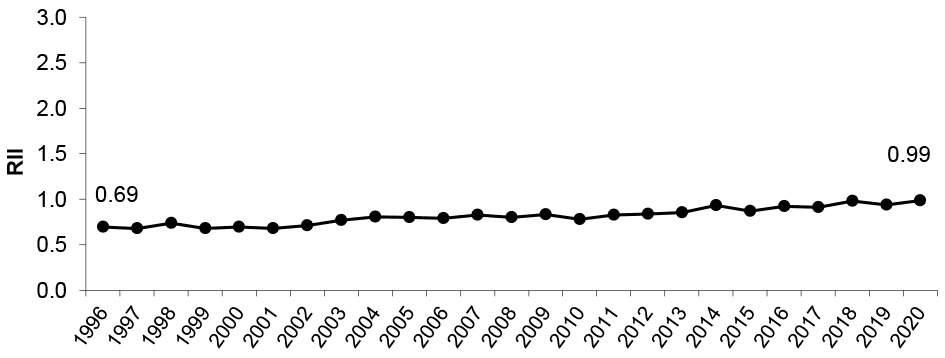
Trends in relative inequalities
Relative inequalities in cancer mortality have increased over time and the RII in 2020 was the highest recorded across the time series. The latest RII figure (0.99) compares with a range of 0.68-0.81 seen in the years between 1996 and 2006.
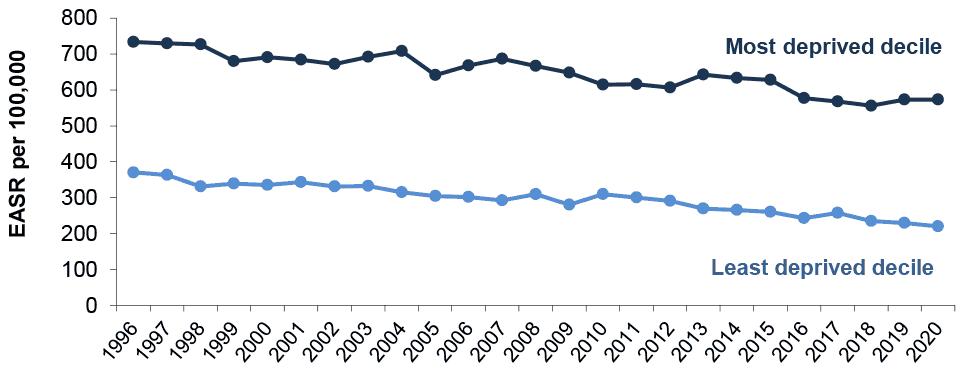
Trends in absolute inequalities
Levels of absolute inequality for cancer deaths have fluctuated since 1996, ranging from 304.8 to 395.3. In 2020 the absolute gap between the most deprived and least deprived areas was the highest it’s been since 2015 at 353.7 per 100,000.
Contact
Email: morag.shepherd@gov.scot