Long-term monitoring of health inequalities: March 2022 report
Annual update of the long-term monitoring of health inequalities headline indicators.
Healthy Birthweight
Trends in healthy birthweight babies
In each year of the time series, either 89% or 90% of babies have been of healthy birthweight.
| Year | Number appropriate for gestational age1 | Target population size1 | % of live singleton births |
|---|---|---|---|
| 1996 | 49,989 | 55,759 | 89.7 |
| 1997 | 51,113 | 56,895 | 89.8 |
| 1998 | 49,303 | 55,075 | 89.5 |
| 1999 | 47,048 | 52,655 | 89.4 |
| 2000 | 45,292 | 50,978 | 88.8 |
| 2001 | 44,355 | 49,666 | 89.3 |
| 2002 | 43,571 | 48,853 | 89.2 |
| 2003 | 44,539 | 49,956 | 89.2 |
| 2004 | 45,842 | 51,694 | 88.7 |
| 2005 | 45,592 | 51,303 | 88.9 |
| 2006 | 46,678 | 52,330 | 89.2 |
| 2007 | 49,059 | 55,080 | 89.1 |
| 2008 | 50,658 | 56,733 | 89.3 |
| 2009 | 49,880 | 55,907 | 89.2 |
| 2010 | 50,236 | 56,027 | 89.7 |
| 2011 | 49,997 | 55,958 | 89.3 |
| 2012 | 49,454 | 55,249 | 89.5 |
| 2013 | 47,650 | 53,032 | 89.9 |
| 2014 | 48,673 | 54,044 | 90.1 |
| 2015 | 47,285 | 52,528 | 90.0 |
| 2016 | 46,694 | 51,870 | 90.0 |
| 2017 | 45,228 | 50,252 | 90.0 |
| 2018 | 44,308 | 49,011 | 90.4 |
| 2019 | 42,568 | 47,169 | 90.2 |
| 20202 | 40,675 | 45,285 | 89.8 |
1. This table includes records that could not be assigned an income employment decile and are therefore not included in the rest of the analysis
2. 2020 data are provisional and may be updated in future reports.
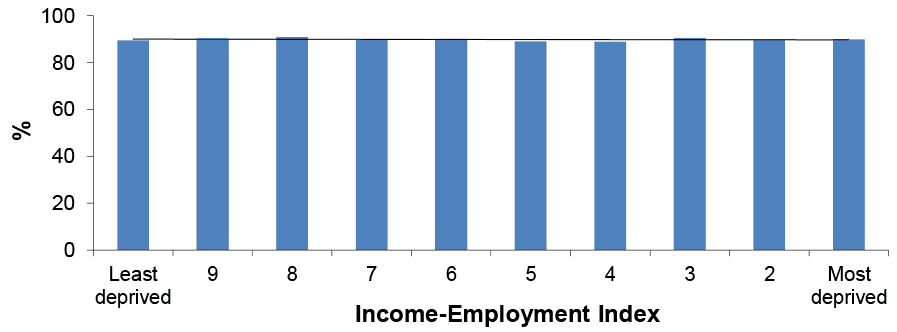
Inequalities in healthy birthweight babies 2020
In 2020, there was a marginal difference between the least and the most deprived areas in terms of the proportion of healthy birthweight babies (89.8% in the most deprived areas and 89.4% in the least deprived areas).
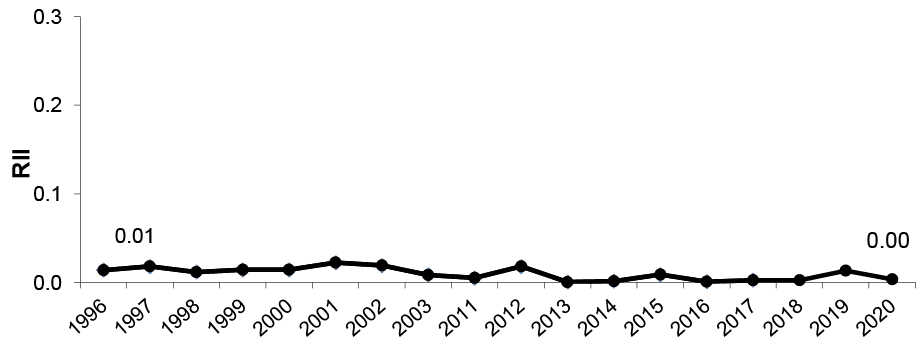
Trends in relative inequalities
Relative inequalities have been consistently low over the times series. The RII for 2020 is at 0.00, suggesting that there is no relative inequality for this indicator.
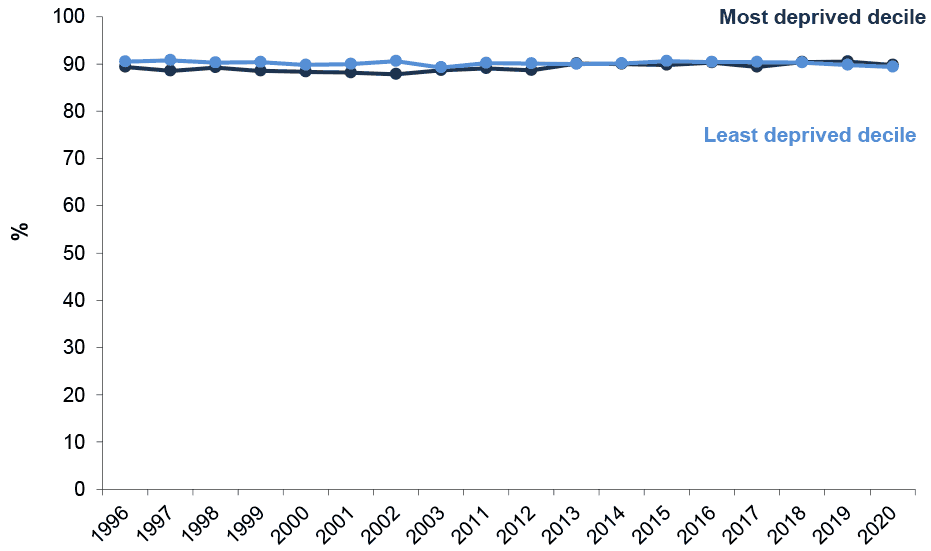
Trends in absolute inequalities
The absolute gap between the percentage of healthy birthweight babies in the most and least deprived deciles has been consistently low across the full time series (0.4 percentage points in 2020).
Contact
Email: morag.shepherd@gov.scot