Long-term monitoring of health inequalities: March 2022 report
Annual update of the long-term monitoring of health inequalities headline indicators.
All-cause mortality aged 15-44 years
Trends in all-cause mortality aged 15-44
There were over 2,300 deaths of people aged 15-44 in Scotland in 2020.
There was an overall decrease in the mortality rate from the start of the time series in 1997 to 2014, when rates reached a low of 96.8 per 100,000. Since then, the mortality rate of those aged 15-44 has increased and in 2020 it was similar to the start of the time series (119.0 per 100,000 and 116.3 per 100,000 respectively).
| Year | Number of all-causes deaths | Target population size | Rate per 100,000 (EASR) |
|---|---|---|---|
| 1997 | 2,440 | 2,158,030 | 116.3 |
| 1998 | 2,507 | 2,142,787 | 119.4 |
| 1999 | 2,507 | 2,129,794 | 119.0 |
| 2000 | 2,501 | 2,118,568 | 118.7 |
| 2001 | 2,509 | 2,111,242 | 119.0 |
| 2002 | 2,566 | 2,102,670 | 122.0 |
| 2003 | 2,461 | 2,094,408 | 116.9 |
| 2004 | 2,409 | 2,088,563 | 114.7 |
| 2005 | 2,305 | 2,091,415 | 109.3 |
| 2006 | 2,482 | 2,091,581 | 118.3 |
| 2007 | 2,461 | 2,097,902 | 117.5 |
| 2008 | 2,443 | 2,096,495 | 117.5 |
| 2009 | 2,389 | 2,092,065 | 115.1 |
| 2010 | 2,229 | 2,087,635 | 108.6 |
| 2011 | 2,262 | 2,092,311 | 110.8 |
| 2012 | 2,071 | 2,077,902 | 102.8 |
| 2013 | 1,990 | 2,064,867 | 100.1 |
| 2014 | 1,904 | 2,053,897 | 96.8 |
| 2015 | 1,976 | 2,053,401 | 101.2 |
| 2016 | 2,194 | 2,054,055 | 112.5 |
| 2017 | 2,068 | 2,048,063 | 107.1 |
| 2018 | 2,220 | 2,044,305 | 114.5 |
| 2019 | 2,331 | 2,053,086 | 119.8 |
| 2020 | 2,349 | 2,055,180 | 119.0 |
The deaths of those aged 15-44 in 2020 included: 404 probable suicides, 30 deaths from assault and 756 drug-related deaths. While the rates of probable suicide in this age group had generally been declining in recent years there was a gradual increase in 2018, 2019 and 2020, to 19.8 per 100,00 in 2020, the highest figure since 2011 (20.5 per 100,000). Rates of death from assault have increased slightly to 1.4 per 100,000 in 2020 from a low of 1.0 per 100,000 in 2014, but have generally been lower in the last decade that at the start of the series. Drug-related deaths have shown large increases since the beginning of the time series in 1997. In 2020, the drug-related death rate was 38.0 per 100,000, this compares with 8.9 per 100,000 in 1997.
| Deaths from assault | Drug related deaths | Suicides | ||||
|---|---|---|---|---|---|---|
| Year | Number | EASR per 100,000 | Number | EASR per 100,000 | Number | EASR per 100,000 |
| 1997 | 56 | 2.6 | 196 | 8.9 | 518 | 23.9 |
| 1998 | 65 | 3.0 | 227 | 10.6 | 526 | 24.4 |
| 1999 | 86 | 4.0 | 274 | 12.9 | 529 | 24.7 |
| 2000 | 60 | 2.9 | 268 | 12.7 | 541 | 25.6 |
| 2001 | 63 | 3.0 | 289 | 13.8 | 531 | 25.3 |
| 2002 | 76 | 3.6 | 345 | 16.7 | 539 | 25.7 |
| 2003 | 71 | 3.4 | 282 | 13.6 | 456 | 21.8 |
| 2004 | 78 | 3.8 | 311 | 15.2 | 475 | 22.7 |
| 2005 | 50 | 2.3 | 277 | 13.4 | 436 | 21.0 |
| 2006 | 83 | 4.0 | 350 | 17.1 | 435 | 20.9 |
| 2007 | 54 | 2.6 | 392 | 19.1 | 453 | 21.8 |
| 2008 | 53 | 2.5 | 477 | 23.3 | 480 | 23.4 |
| 2009 | 47 | 2.3 | 436 | 21.3 | 432 | 20.8 |
| 2010 | 54 | 2.6 | 384 | 18.9 | 423 | 20.5 |
| 2011 | 53 | 2.6 | 454 | 22.5 | 420 | 20.5 |
| 2012 | 37 | 1.9 | 416 | 20.8 | 375 | 18.3 |
| 2013 | 35 | 1.7 | 354 | 17.9 | 356 | 17.7 |
| 2014 | 22 | 1.0 | 416 | 21.1 | 309 | 15.4 |
| 2015 | 28 | 1.4 | 442 | 22.8 | 306 | 15.3 |
| 2016 | 34 | 1.7 | 568 | 29.2 | 329 | 16.2 |
| 2017 | 40 | 2.0 | 581 | 30.1 | 305 | 15.1 |
| 2018 | 28 | 1.4 | 723 | 37.3 | 370 | 18.3 |
| 2019 | 29 | 1.4 | 753 | 38.4 | 404 | 19.7 |
| 2020 | 30 | 1.4 | 756 | 38.0 | 404 | 19.8 |
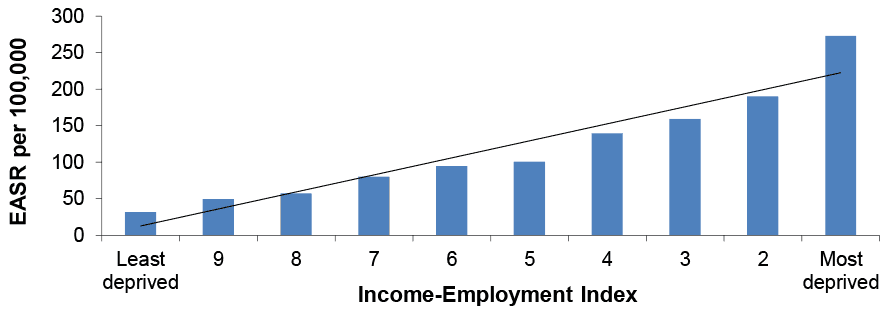
Inequalities in all-cause mortality aged 15-44, 2020
The mortality rate amongst people aged 15-44 years was nearly 9 times higher in the most deprived areas (272.8 per 100,000) compared to the least deprived (31.7 per 100,000) in 2020.
Trends in relative inequalities
There has been an overall increase in relative inequalities over time and they are currently at the second highest point in the time series (2.0).
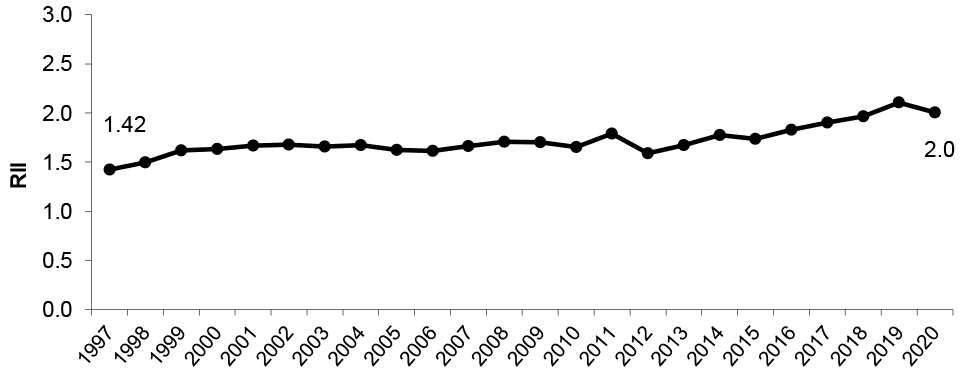
Between 1997 and 2017, death rates ranged from 4-7 times higher in the most deprived areas compared to the least deprived. Between 2018-2020 the death rates were 8-9 times higher in the most deprived areas compared to the least deprived areas.
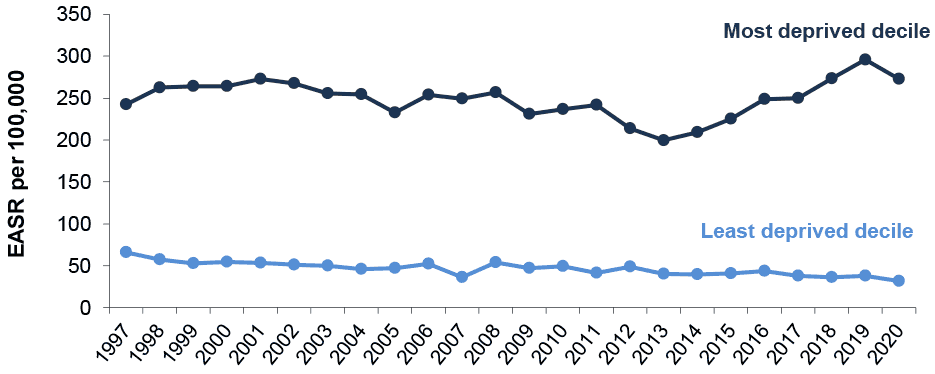
Trends in absolute inequalities
The absolute gap in all-cause mortality between those living in the most and least deprived areas has fluctuated over the time series, reaching its lowest level in 2013 (a gap of 159.6 per 100,000). The gap has shown an overall increase since then and was 241.1 per 100,000 in 2020. This increase has been driven by an increase in mortality for those living in the most deprived areas.
Contact
Email: morag.shepherd@gov.scot