Long-term monitoring of health inequalities: March 2022 report
Annual update of the long-term monitoring of health inequalities headline indicators.
Cancer incidence rate aged under 75 years
Trends in cancer incidence
In 2019, there were nearly 22,700 new cases of cancer among people aged under 75.
Cancer incidence among people aged under 75 has fluctuated over the time series ranging from 417.5 per 100,000 to 452.7 per 100,000. Despite these fluctuations, cancer incidence in 2019 is the third highest figure in the time series at 447.1 per 100,000.
| Year | Number of new cases | Target population size | Rate per 100,000 (EASR) |
|---|---|---|---|
| 1996 | 18,128 | 4,754,906 | 452.7 |
| 1997 | 17,167 | 4,740,269 | 427.4 |
| 1998 | 17,109 | 4,729,975 | 424.3 |
| 1999 | 16,914 | 4,721,298 | 417.5 |
| 2000 | 17,138 | 4,708,667 | 420.6 |
| 2001 | 17,147 | 4,703,661 | 418.9 |
| 2002 | 17,530 | 4,701,958 | 423.6 |
| 2003 | 17,574 | 4,702,431 | 420.8 |
| 2004 | 18,159 | 4,714,233 | 430.3 |
| 2005 | 17,987 | 4,735,320 | 421.9 |
| 2006 | 18,167 | 4,752,425 | 423.3 |
| 2007 | 18,775 | 4,783,452 | 430.8 |
| 2008 | 19,449 | 4,811,453 | 439.7 |
| 2009 | 19,999 | 4,835,007 | 446.6 |
| 2010 | 20,015 | 4,858,058 | 441.9 |
| 2011 | 20,208 | 4,888,316 | 441.3 |
| 2012 | 20,296 | 4,895,114 | 436.8 |
| 2013 | 20,598 | 4,903,074 | 437.7 |
| 2014 | 21,064 | 4,914,362 | 442.4 |
| 2015 | 20,888 | 4,935,283 | 433.5 |
| 2016 | 20,980 | 4,962,391 | 429.2 |
| 2017 | 21,197 | 4,976,829 | 426.5 |
| 2018 | 22,549 | 4,983,364 | 449.1 |
| 2019 | 22,698 | 4,997,455 | 447.1 |
Inequalities in cancer incidence, 2019
In 2019, there were 564.2 cases of cancer per 100,000 people in the most deprived areas, compared to 398.2 cases per 100,000 in the least deprived areas.
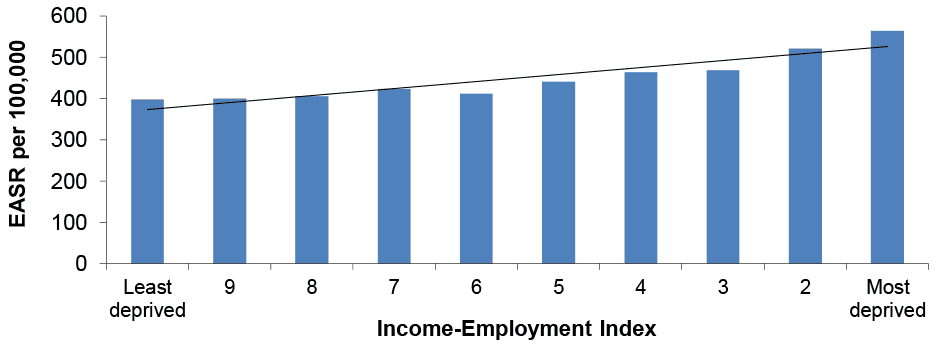
Cancer incidence is more common in the most deprived areas of Scotland. However, this is not the case for all types of cancer[i]. This is driven in part by variations in screening uptake, leading to socially patterned rises in cancer incidence and, in turn, cancer survival for some types of cancer in the least deprived areas.
As has been the case in previous years, of the most common types of cancer, the absolute gap between most and least deprived areas was largest for cancer of the trachea, bronchus and lung (2019 rates were 136.5 and 27.8 per 100,000 population in the most and least deprived areas respectively).
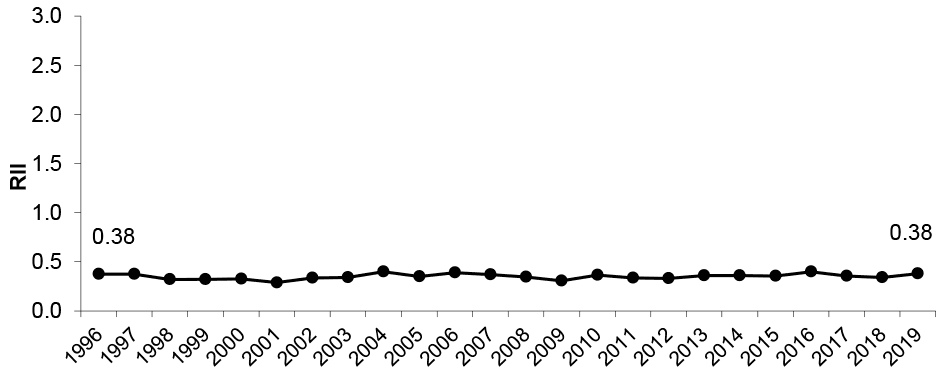
Trends in relative inequalities
Changes in the relative index of inequality over time have been minimal and show no clear pattern, with the rate fluctuating between 0.29 and 0.40. In 2019 the RII was 0.38, the same as at the start of the time series.
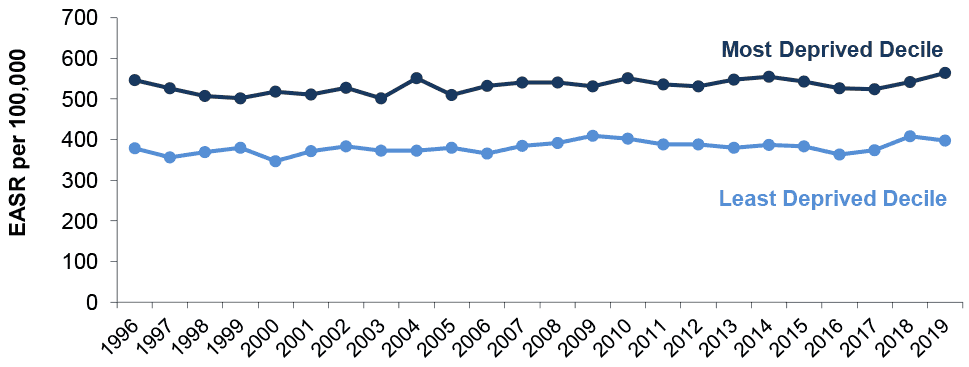
Trends in absolute inequalities
Absolute inequality levels in cancer incidence have fluctuated over time, ranging from 122.1 to 178.2. Rates in both the least and most deprived areas of Scotland have shown no clear pattern. The gap between the most and least deprived decile in 2019 (166.0 per 100,000) was the highest it’s been since 2014 (167.1 per 100,000).
Contact
Email: morag.shepherd@gov.scot