Long-term monitoring of health inequalities: March 2022 report
Annual update of the long-term monitoring of health inequalities headline indicators.
Alcohol-specific deaths aged 45-74 years
Trends in alcohol-specific deaths
The alcohol-specific death rate among those aged 45-74 years has fluctuated over the time series. There was an overall increase between 1997 and 2006 (increasing from 38.5 per 100,000 to 61.3 per 100,000) followed by a general downward trend until 2012 (38.2 per 100,000) when the rate was similar to the start of the time series. Since 2013, the alcohol-specific mortality rate has increased overall and the rate in 2020 was 45.4 per 100,000, the highest rate since 2010 and higher than at the start of the time series.
| Year | Number of deaths | Target population size | Rate per 100,000 (EASR) |
|---|---|---|---|
| 1997 | 636 | 1,635,590 | 38.5 |
| 1998 | 695 | 1,646,711 | 41.9 |
| 1999 | 761 | 1,658,124 | 45.2 |
| 2000 | 873 | 1,670,660 | 52.1 |
| 2001 | 957 | 1,687,422 | 56.7 |
| 2002 | 1,049 | 1,706,141 | 61.3 |
| 2003 | 1,053 | 1,727,112 | 60.9 |
| 2004 | 1,015 | 1,751,037 | 57.6 |
| 2005 | 1,056 | 1,774,865 | 59.3 |
| 2006 | 1,105 | 1,799,382 | 61.3 |
| 2007 | 1,002 | 1,827,320 | 54.6 |
| 2008 | 1,019 | 1,856,874 | 54.8 |
| 2009 | 905 | 1,885,693 | 47.9 |
| 2010 | 927 | 1,914,226 | 48.3 |
| 2011 | 871 | 1,941,253 | 45.1 |
| 2012 | 752 | 1,964,203 | 38.2 |
| 2013 | 769 | 1,986,202 | 38.6 |
| 2014 | 808 | 2,007,988 | 40.2 |
| 2015 | 840 | 2,026,210 | 41.4 |
| 2016 | 898 | 2,047,858 | 43.7 |
| 2017 | 910 | 2,064,612 | 44.0 |
| 2018 | 898 | 2,073,318 | 43.2 |
| 2019 | 801 | 2,078,664 | 38.4 |
| 2020 | 952 | 2,081,213 | 45.4 |
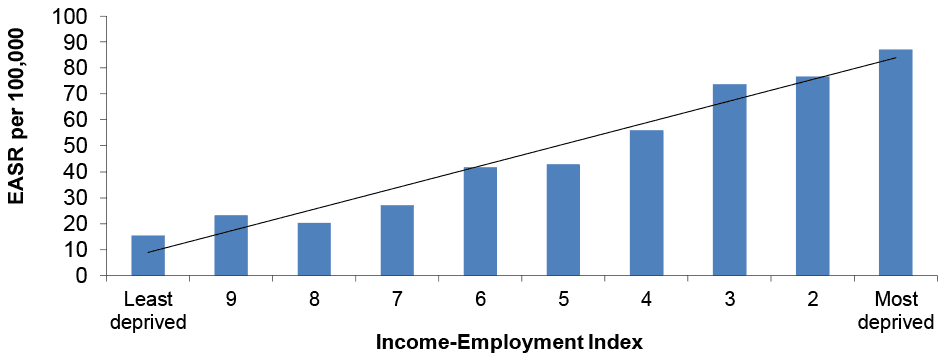
Inequalities in alcohol-specific deaths, 2020
The alcohol-specific death rate (for those aged 45-74 years) in Scotland’s most deprived areas is almost six times higher than that observed in the least deprived areas (87.2 compared to 15.4 per 100,000 population).
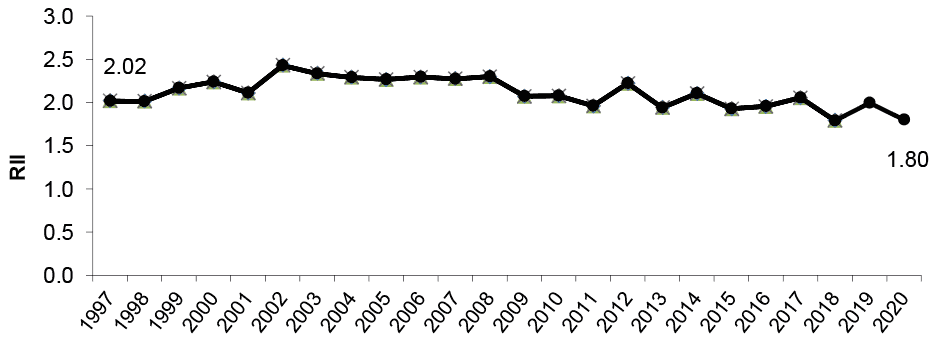
Trends in relative inequalities
Relative inequalities in alcohol-specific deaths have reduced overall since the start of the time series. For all years between 1997 and 2010 the RII was above 2, whereas it has ranged from 1.79 to 2.22 since 2011. The RII in 2020 was 1.80.
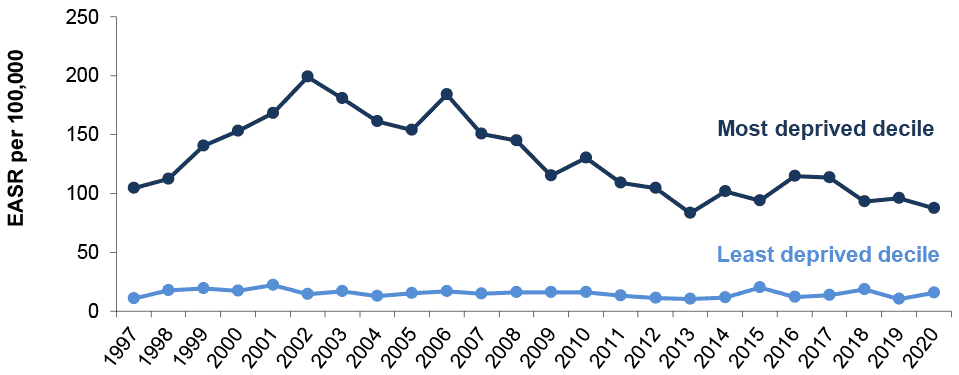
Trends in absolute inequalities
Following an increase in the gap between the alcohol-specific mortality rate in the most and least deprived areas of Scotland, from 93.7 to 184.7 per 100,000 between 1997 and 2002, there has been general downward trend, with a gap of 71.8 per 100,000 in 2020, the lowest in the time series.
Although the rate of alcohol-specific deaths in the least deprived areas has remained reasonably static since 1997, there has been considerable change in the rate in the most deprived areas. This has largely driven changes in the absolute gap.
Contact
Email: morag.shepherd@gov.scot