Independence in the modern world. Wealthier, happier, fairer: why not Scotland?
This paper sets out a detailed analysis of the UK’s performance across a range of economic and social indicators relative to that of ten European countries. It is the first in the 'Building a new Scotland' series, focusing on independence.
Section 1: How well does the UK compare?
This section considers evidence across four areas: macroeconomic outcomes, economic dynamism, social solidarity, and the labour market. Of course there are other aspects of national performance – such as the full range of indicators presented in the Scottish Government's own National Performance Framework – that also could have been considered, including some in which Scotland has unique and widely recognised potential, such as culture and the environment. But ultimately the economic and social success of a nation depends on the choices it makes as well as its cultural or natural resource endowments. The indicators presented here reflect the outcomes of different national choices and are sufficient to show that the comparator nations are, relative to the UK, wealthier, happier and fairer.
Note: the analysis in this and following sections has been compiled from the latest available data at the time of writing (March - April 2022).
A) Macroeconomic Outcomes
Key Point
The comparator countries – all independent – have generally maintained sound macroeconomic policies and credible institutions over the long-term, providing the strong foundations on which to build and sustain the economic dynamism and social solidarity described in later sections.
The comparator nations are internationalised, open economies – some on the geographical periphery of Europe – which have established macroeconomic frameworks that fit their circumstances and provide the stability required for successful long-term development. The strong macroeconomic performance of these economies is apparent across a range of indicators.
The comparator countries have:
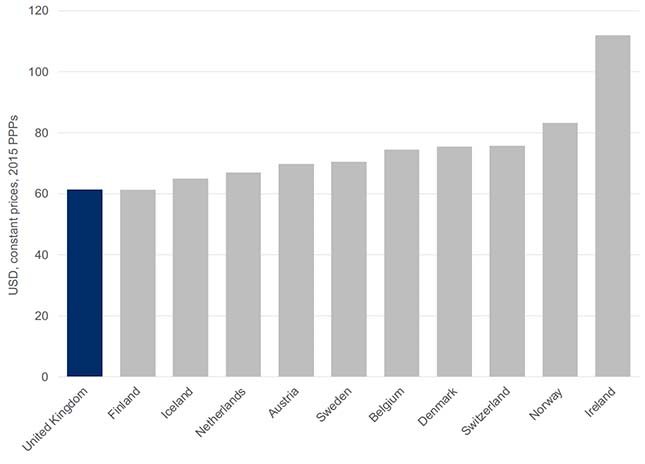
- Higher GDP per head – the comparator countries are wealthier than the UK. In 2020, GDP per capita (USD, constant prices, 2015 PPPs) was as follows: Ireland ($87,735), Switzerland ($66,674), Norway ($60,912), Denmark ($51,772), Netherlands ($51,572), Iceland ($49,416), Sweden ($49,098), Austria ($48,908), Belgium ($45,559), Finland ($44,451) and the UK ($40,607). The UK's GDP per capita fell below the OECD average ($40,941) in 2020.[50] (See Figure 1.)
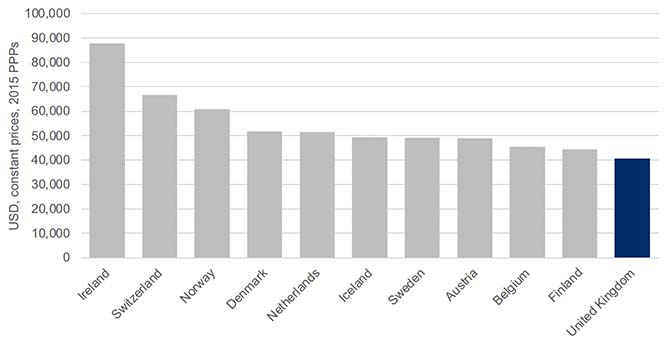
Source: OECD level of GDP per capita and productivity dataset
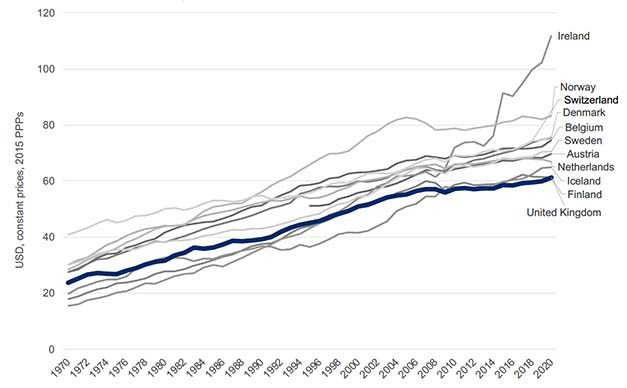
- Sustained this higher wealth over time. With the exception of Finland in 2015, GDP per capita has been higher in all the comparator countries in every year since 2000.[51] (See Figure 2.)
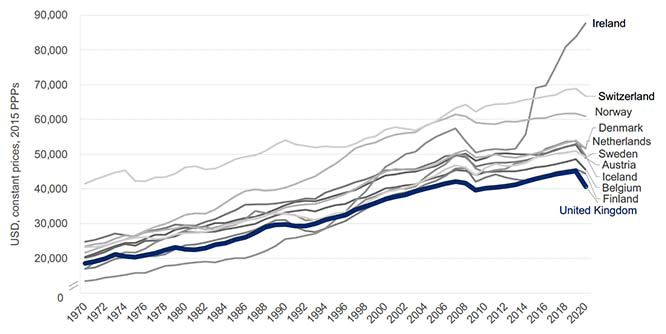
Source: OECD level of GDP per capita and productivity dataset
- Sustained high employment rates. Perhaps the strongest achievement of the UK economy in recent decades is achieving and maintaining a high employment rate (less positive elements of the UK labour market will be discussed in later sections). Yet Iceland and Switzerland have sustained a significantly higher employment rate than the UK, and Norway, Denmark, the Netherlands and Sweden have fluctuated around the UK rate.[52] (See Figure 3). The UK's success in sustaining high employment (when compared to all OECD nations) is unexceptional when measured against the comparator group.
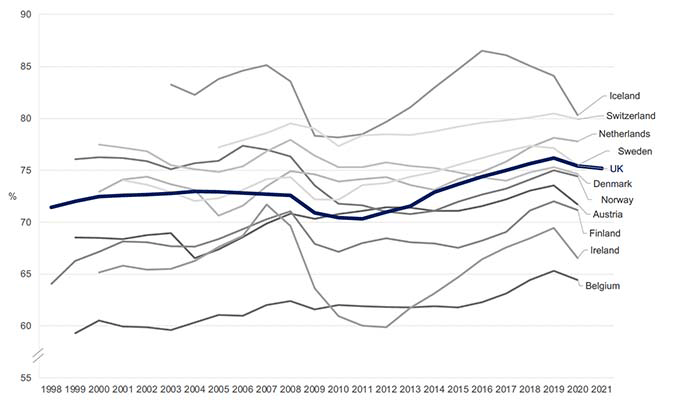
Source: OECD employment rate data
In addition, the comparator countries have:
- Achieved lower debt and deficits as a share of GDP:
- Debt: the comparator nations currently have lower debt burdens than the UK, although it is important to note that performance has fluctuated over time, with the global financial crisis having a more severe impact in some countries than others.[53] (See Figure 4.)
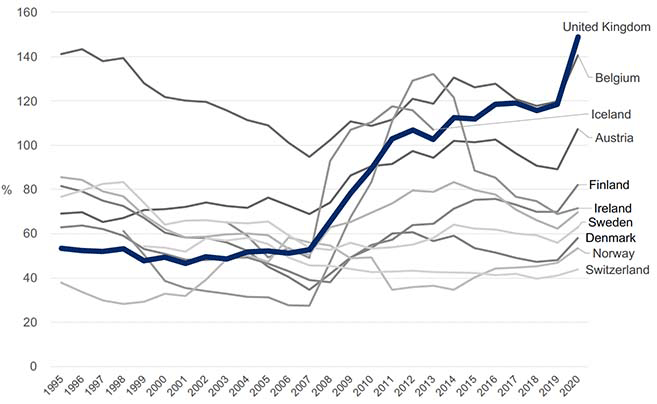
Source: General government – General government debt – OECD Data
- Deficit: similarly, the UK's fiscal deficit is high in comparison to the comparator nations.[54] (See Figure 5.)
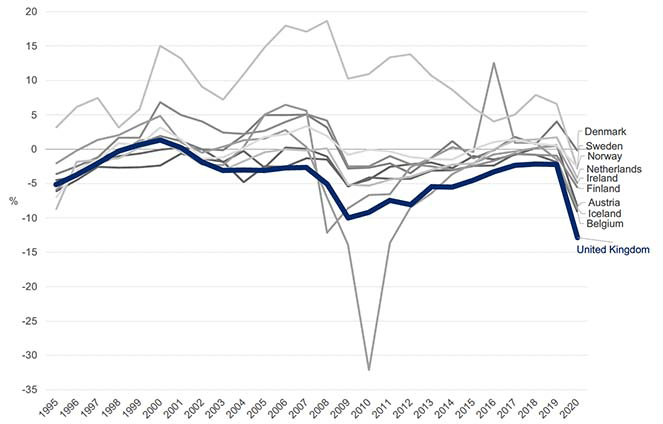
- Generally achieved low and stable inflation[55] (See Figure 6.)
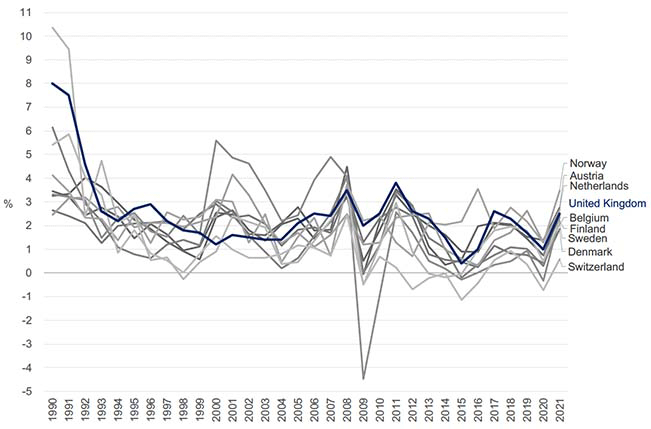
Source: OECD – Inflation (CPI) data
As noted in the introduction, the comparator nations are open, highly internationalised economies and as such they have not been immune to global shocks – indeed, these shocks have sometimes been severe. Due to the scale of their banking sectors, Ireland and Iceland faced massive fiscal challenges – significantly greater than those faced by the other comparator nations or the UK – in the wake of the global financial crisis. However, despite the scale of the shock, both recovered more rapidly than was widely predicted at the time and their economic and social models remained intact.[56]
In general, the comparator nations have benefitted from effective monetary and fiscal management by credible institutions which has created the stability on which these countries have built and sustained economic dynamism and social solidarity. We now consider these in turn.
B) Economic dynamism
Key Point
Lack of scale has not prevented the comparator nations from successfully developing – and maintaining over the long-term – some of the world's most dynamic, productive, innovative and internationalised economies.
Commentary on the comparator nations – especially the Nordic nations – tends to focus on equality of outcomes (especially income and gender equality) and high levels of employment. However, although often overlooked, the sustained success of these nations in developing dynamic, highly productive, innovative exporting economies is highly impressive. These countries routinely outperform the UK on measures of productivity and innovation.
The comparator nations:
- Achieve higher productivity – often significantly higher – than the UK. In 2020, GDP per hour worked (USD constant prices, 2015 PPPs) was as follows: Ireland ($111.8), Norway ($83.2), Switzerland ($75.7), Denmark ($75.4), Belgium ($74.5), Sweden (470.5), Austria ($69.8), Netherlands ($67.0), Iceland ($64.9), Finland ($61.3) and the UK ($61.3).[57] Again, the relatively better performance has been maintained over time. With the exception of Finland in 2015, productivity has been higher in all comparator countries in every year since 2000. (See Figure 7 and Figure 8.)
Source: OECD level of GDP per capita and productivity dataset
Source: OECD level of GDP per capita and productivity dataset
- Invest more in research and development. All the comparator countries except Ireland spend more on research and development than the UK. The full OECD dataset over time shows that the UK has spent below the OECD average in every year since 2000 while Denmark, Finland and Sweden have spent well above.[58] (See Figure 9.)
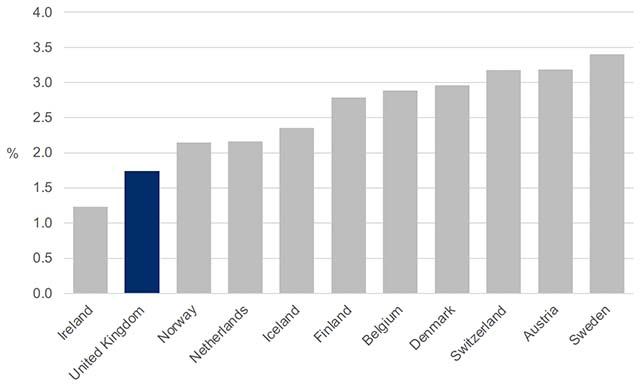
Source: OECD gross domestic spending on research and development (R&D) data
- Invest more in business enterprise research and development. Sweden, Switzerland, Austria, Belgium, Denmark, Finland, Iceland and the Netherlands all spend more on business enterprise research and development than the UK.[59] (See Figure 10.)
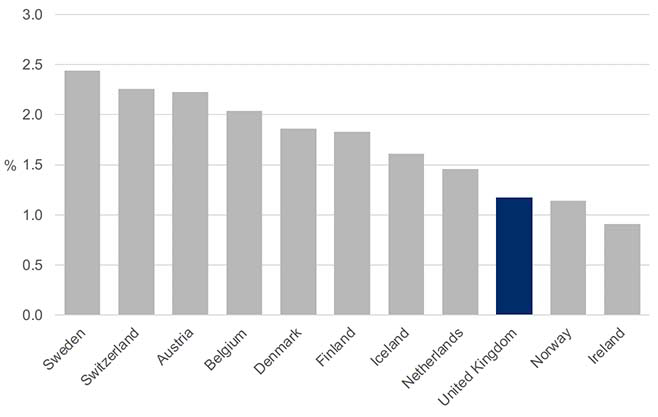
Source: Gross expenditure on research and development Scotland 2019 – gov.scot (www.gov.scot)
Achieve higher business investment, in all comparator countries where we have data, in most years. Indeed, the UK has the lowest rate of business investment in the OECD apart from Greece.[60](See Figure 11.)
Sources: GDP and spending – Investment by sector – OECD Data and Gross fixed capital formation (% of GDP) | Data (worldbank.org). Business investment as a share of GDP has been calculated by multiplying Gross Fixed Capital Formation (GFCF) expressed as a percentage of GDP by the proportion of corporate investment in total GFCF for each country.
- Register more patents per million of population. Although the UK ranked well (16th globally) in 2019, all the comparator countries except Ireland and Iceland performed better: Switzerland (3rd), Denmark (7th), Sweden (8th), Finland (9th), Netherlands (10th), Austria (11th), Norway (14th), and Belgium (15th).[61]
Global surveys/indices
The comparator nations also tend to perform strongly across the various global surveys of innovation and competitiveness:
- The IMD World Competitiveness Report 2021 analyses and ranks 64 countries based on 334 competitiveness criteria and 'according to how they manage their competencies to achieve long-term value creation'. The 2021 report ranked Switzerland 1st, Sweden 2nd, Denmark 3rd, Netherlands 4th, Norway 6th, Finland 11th, Ireland 13th, UK 18th, Austria 19th, Iceland 21st, and Belgium 24th.[62]
- The Global Innovation Index 'aims to capture the multi-dimensional facets of innovation and provide the tools that can assist in tailoring policies to promote long-term output growth, improved productivity, and employment growth'. The 2021 index covered 132 nations and ranked Switzerland 1st, Sweden 2nd, UK 4th, Netherlands 6th, Finland 7th, Denmark 9th, Iceland 17th, Austria 18th, Ireland 19th, Norway 20th and Belgium 22nd.[63]
- The World Economic Forum Global Competitiveness Report 2020 assessed 34 nations for 'readiness for economic transformation' (defined as a full integration of social, environmental and institutional targets into their economic systems over the next five years). The comparator countries scored well with only Ireland and Austria scoring below the UK: Finland was the highest scoring nation (69.9) followed by Sweden (68.5), Denmark (66.5), Netherlands (66.3), Switzerland (62.5), Belgium (63.6), UK (61.4), Ireland (60.9) and Austria (60.3).[64]
- The Bloomberg Innovation Index analyses 60 nations using dozens of criteria grouped into seven metrics: research and development, gross value added by manufacturing, productivity, high-tech company density, researcher concentration, tertiary efficiency, and patent activity. The 2021 index ranked Switzerland 3rd, Sweden 5th, Denmark 6th, Finland 8th, Netherlands 9th, Austria 10th, Belgium 14th, Norway 15th, Ireland 17th, UK 18th and Iceland 28th.[65]
- The World Economic Forum Global Competitiveness Report 2020 ranked the top ten countries on ICT adoption, digital skills and digital legal framework. Sweden featured in the top ten on all three indicators, Finland and the Netherlands in two, and Denmark and Norway in one each. The UK did not feature in the top ten in any of these categories.[66]
Not all the comparator countries out-perform the UK on every indicator listed in this section. But the best performing comparator countries perform better than the UK across many. And what really distinguishes these nations is their ability – sustained over the long-term – to marry economic dynamism with deep social solidarity.
C) Social solidarity and quality of life
Key Point
Arguably the world's most enduringly successful societies – as shown by a range of indicators – are independent countries of Scotland's size which have successfully married economic dynamism with social solidarity. Relatively high social spending and relatively equal income distributions have not proved barriers to robust economic development.
The contrast with the comparator countries is stark. As set out above, these nations have managed to equal or out-perform the UK across a range of economic indicators. Despite 'competitiveness' often being used as a justification for UK social and labour market reforms, it is striking how these comparator nations have managed to balance – over the long-term – excellent economic outcomes with consistently strong performance across a range of social indicators.[67]
Relative to the UK, the comparator countries have:
- Lower income inequality. All the comparator countries have significantly lower income inequality than the UK, with Iceland, Norway, Belgium, Denmark, Finland, Austria and Sweden among the ten most equal nations.[68] (See Figure 12.)
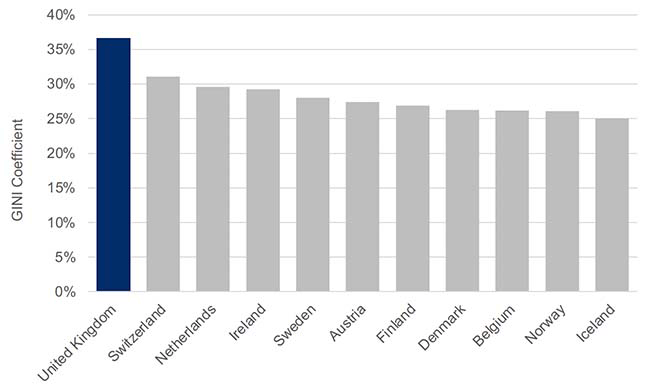
Source: OECD income inequality data
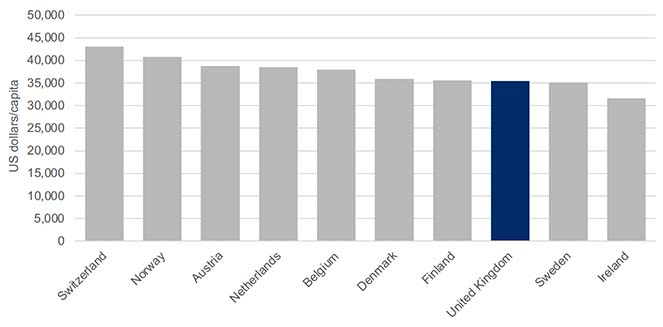
- Higher gross household disposable income (including social transfers in kind, $/per capita 2020) with the exception of Ireland and Sweden. Switzerland's gross household disposable income was $43,035, followed by Norway ($40,743), Austria ($38,726), Netherlands ($38,552), Belgium ($37,926), Denmark ($35,849), Finland ($35,536), UK ($35,350), Sweden ($35,091) and Ireland ($31,553).[69] (See Figure 13.)
- Lower poverty rates. In 2020, out of 40 countries in the OECD statistics, Iceland had the lowest rate of poverty followed by Denmark (3rd), Finland (4th), Ireland (5th), Belgium (8th), Netherlands (9th), Norway (11th), Sweden (13th), Austria (16th) and Switzerland (17th). The UK had the 23rd lowest rate of poverty in the OECD.[70] (See Figure 14.)
Source: OECD poverty rate data
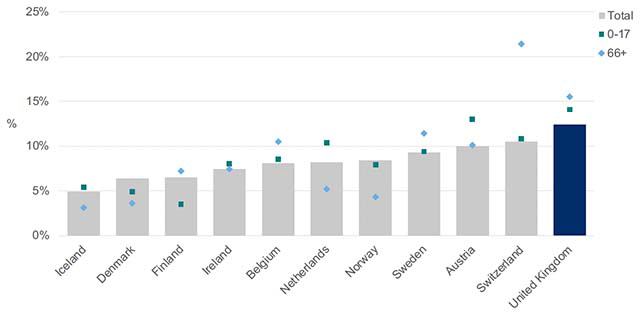
- There are fewer children and pensioners living in poverty in the comparator countries. In 2020, the poverty rates for children (aged 0-17 years) and pensioners (aged over 66 years) were lower in all the comparator countries than the UK – with the exception of pensioners in Switzerland.[71] (See Figure 15.)
Source: OECD poverty rate data
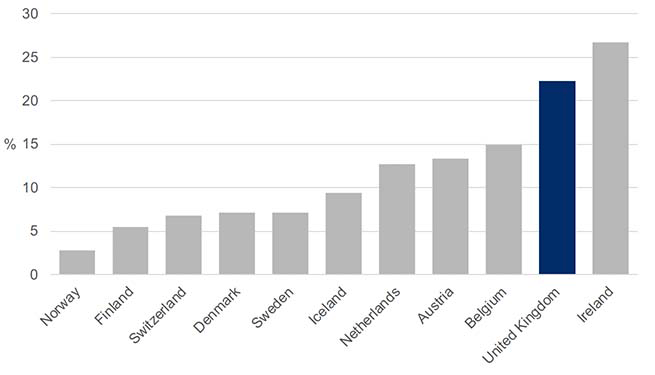
- Fewer children living in material deprivation with the exception of Ireland. The rate in Norway was 2.8%, Finland 5.5%, Switzerland 6.8%, Sweden 7.1%, Denmark 7.1%, Iceland 9.4%, Netherlands 12.7%, Austria 13.3%, Belgium 14.9%, UK 22.2% and Ireland 26.7%.[72] (See Figure 16.)
Source: Child specific material deprivation by age (children aged 1 to 15 years), Eurostat
- Higher social mobility. Comparator countries account for the top 9 places in the World Economic Forum's Social Mobility Index 2020 which ranks 82 countries; Ireland is 18th and the UK 21st.[73] (See Figure 17.) Also, comprehensive OECD analysis in 2018 concluded that it would take on average 5 generations for those born in low-income families to approach the mean income in the UK. Denmark was the only country assessed as achieving this change within 2 generations. Finland, Norway and Sweden took 3 generations and Belgium and the Netherlands 4. Austria, Ireland and Switzerland sit alongside the UK on 5 generations.[74]
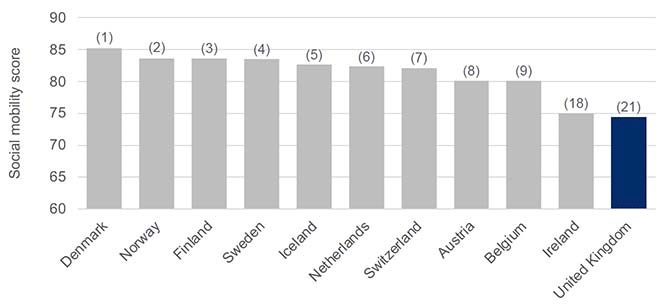
Source: Global Social Mobility Index 2020 | World Economic Forum (weforum.org)
- Higher life expectancy. All the comparator countries have higher life expectancy at birth than the UK's 80.4 years – Norway (83.3 years), Iceland (83.1), Sweden (82.5), Finland (82.2), Denmark (81.6), Netherlands (81.5), Austria (81.3), Switzerland (83.2), Ireland (82.8) and Belgium (80.9).[75]
Happiness and wellbeing
The better social outcomes achieved in the comparator countries are reflected in the more established surveys and indices of happiness and wellbeing:
- United Nations Human Development Index (HDI) 2020 rankings – the HDI is a composite indicator measuring performance across the 3 'dimensions' of 'long and healthy life', 'knowledge' and 'a decent standard of living'. Norway topped the 2020 rankings followed by Ireland and Switzerland (joint 2nd), Iceland (joint) 4th, Sweden 7th, Netherlands (joint) 8th, Denmark 10th, Finland (joint) 11th, UK 13th, Belgium (joint) 14th and Austria 18th.[76]
- OECD Better Life Index 2020 aims to "involve citizens in the debate on measuring the well‑being of societies, and to empower them to become more informed and engaged in the policy-making process that shapes all our lives". The Life Satisfaction indicator considers people's evaluation of their life as a whole. It is a weighted-sum of different response categories based on people's assessment of their current life relative to the best and worst possible lives for them on a scale from 0 to 10. In 2020, Finland (7.9) scored the highest in the OECD followed by Iceland (7.6), Denmark (7.5), Switzerland (7.5), Netherlands (7.5), Norway (7.3), Sweden (7.3), Austria (7.2), Ireland (7.0), and Belgium and the UK (6.8).[77]
- World Happiness Report 2021 uses data from 350,000 interviews across 95 countries to assess subjective happiness. In 2020, Finland ranked 1st among all countries surveyed followed by Iceland (2nd), Denmark (3rd), Switzerland (4th), Netherlands (5th), Sweden (6th), Norway (8th), Austria (10th), Ireland (13th), Belgium (17th) and the UK 18th.[78]
- Our World in Data Self-reported Life Satisfaction 2020 asks respondents to "imagine a ladder, with steps numbered from 0 at the bottom to 10 at the top. The top of the ladder represents the best possible life for you and the bottom of the ladder represents the worst possible life for you. On which step of the ladder would you say you personally feel you stand at this time?" Finland achieved the highest score of all nations (7.82) followed by Denmark (7.64), Iceland (7.56), Switzerland (7.51), Netherlands (7.41), Sweden (7.38), Norway (7.37), Austria (7.16), Ireland (7.04), UK (6.94) and Belgium (6.80).[79]
- The Global Wellbeing Index 2020 is based on 17 indicators including happiness, social progress and economic performance. In 2020, Denmark ranked first followed by Norway (2nd), Finland (3rd), Switzerland (4th), Sweden (5th), Iceland (7th), Austria (9th), Netherlands (11th), Ireland (12th), UK (15th) and Belgium (17th). The 2020 report found that "The Nordic nations score higher at all levels of wellbeing compared to the G20".[80]
Regional equality
Measuring regional equality is complex and different results can emerge depending on the territorial units and measures of output or income used in the analysis. It is difficult to reach concrete conclusions on the basis of a single indicator.
For example, in 2019, the Resolution Foundation concluded that "on the key productivity measure of output per worker, the UK is the most geographically unequal G7 country, with even greater inequality than the US" but conversely that "a different picture emerges when looking at typical household incomes after housing costs across the UK regions and nations. This is partly due to the state reducing gaps through redistributive policies, and because geographic income inequality has fallen over the last 30 years".[81]
Professor Philip McCann[82] a leading authority on regional economics, recently examined the issue of whether the UK displays high levels of interregional inequality in the context of 28 different indicators and 30 different OECD countries, concluding that "The result is clear. The UK is one of the most interregionally unbalanced countries in the industrialised world…and almost certainly the most interregionally unequal large high-income country".[83] Indeed, as referenced earlier, successive UK Governments have acknowledged this persistent issue.[84]
D) The labour market
As will be discussed later, the labour market is an area of significant policy divergence between the UK and comparator countries. The UK has deregulated its labour market[85] and policy has deliberately[86] sought to undermine or weaken 'institutions' such as trade unions and the collective bargaining of wages, terms and conditions. While the comparator nations have all deregulated to some extent (most have below OECD average levels of employment protection legislation[87]), they have also retained relatively high levels of trade union membership and collective bargaining coverage and these counter-balancing institutions have led to different outcomes.
Relative to the UK, the comparator nations have:
- Higher average wages. In 2020, average wages (US dollars) were $67,488 in Iceland followed by Switzerland ($64,824), the Netherlands ($58,828), Denmark ($58,430), Norway ($55,780), Belgium ($54,327), Austria ($53,132), Ireland ($49,474), UK ($47,147), Sweden ($47,020) and Finland ($46,230). In considering these figures, it should be borne in mind that Sweden and Finland have significantly lower income inequality than the UK.[88]
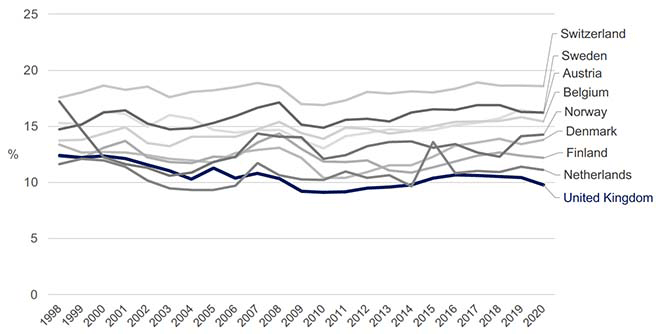
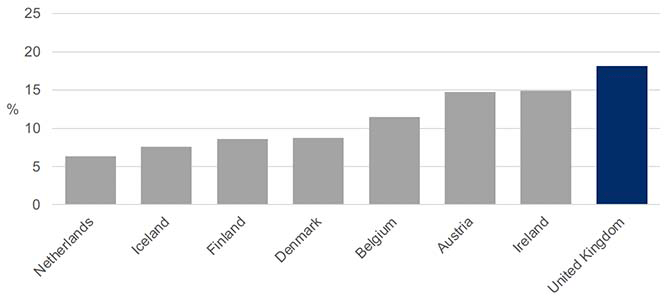
- A lower proportion of low wage earners as a proportion of all workers. The incidence of low pay in the UK is 18.1%. The comparator countries have lower rates, with some significantly lower such as the Netherlands (6.4%), Iceland (7.6%), Finland (8.6%) and Denmark (8.7%).[89] (See Figure 18.)
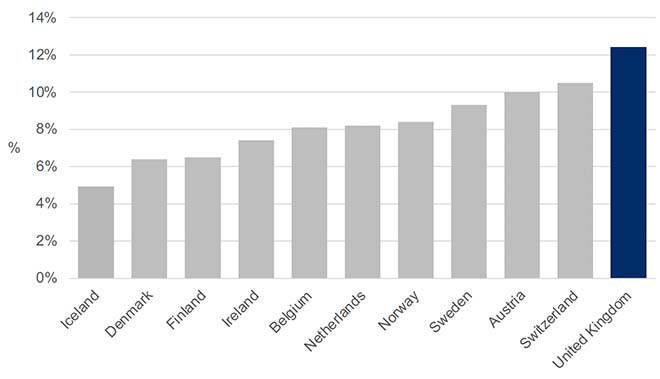
- A lower proportion of income accruing to the top 1%. A higher proportion accrues to the top 1% in the UK (12.6%) than in all the comparator countries: Netherlands 6.2%, Iceland 7.6%, Belgium 7.8%, Sweden 9.0%, Austria and Norway 9.3%, Finland 10.1%, Switzerland 10.6%, Denmark 10.7% and Ireland 11.3%.[90]
- A lower gender pay gap. In 2018 – the most recent year for which Eurostat data for all countries are available – only Austria had a higher gender pay gap than the UK. Belgium had the narrowest gap, at 5.8%, followed by Ireland 11.3%, Sweden 12.1%, Norway 13.2%, Iceland 13.8%, Denmark 14.6%, Netherlands 14.7%, Finland 16.9%, Switzerland 18.6%, UK 19.8% and Austria 20.4%.[91] (See Figure 19.)
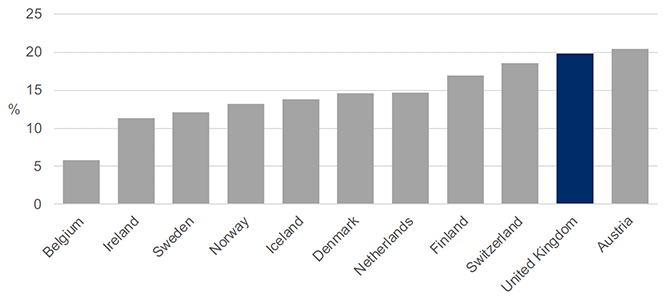
Source: Eurostat – Gender pay gap in unadjusted form statistics (europa.eu)
- Fewer people in-work and at risk of poverty. In 2018 – the last year for which data for all countries are available – the proportion of people in work aged 18-64 years at risk of poverty was: Finland 3.1%, Ireland 4.8%, Belgium 5.1%, Denmark and Norway 6.1%, Netherlands 6.1%, Iceland (7.3%), Sweden 7.1%, Switzerland 7.4%, Austria 8.0%, and the UK 10.4%.[92]
- Fewer employees working very long hours – defined as the proportion of employees whose usual hours of work per week are 50 hours or more. In 2020, only 0.3% of workers in the Netherlands worked very long hours, followed by Switzerland 0.4%, Sweden 0.9%, Denmark 1.1%, Norway 1.4%, Finland 3.6%, Belgium 4.3%, Ireland 4.7%, Austria 5.3%, and UK 10.8%. Only Iceland (11.7%) has a higher proportion.[93]
- Significantly higher statutory sick pay. The UK has the lowest level of mandatory sick pay in the OECD. In most of the comparator countries (Ireland also has relatively low mandatory sick pay), the proportion of an individual's wages that are covered by sickness benefits varies between 70 per cent and 100%.[94]