Independence in the modern world. Wealthier, happier, fairer: why not Scotland?
This paper sets out a detailed analysis of the UK’s performance across a range of economic and social indicators relative to that of ten European countries. It is the first in the 'Building a new Scotland' series, focusing on independence.
Section 2: Different models, better outcomes
This section seeks to highlight some of the factors that help explain the better performance of the comparator countries relative to the UK. A full outline and explanation of the particular characteristics of each country model is not attempted. Each national model is different. Rather, the focus is on the factors which are, to a greater or lesser extent, common to the comparator countries and which distinguish them from the UK.
It is important to note that an independent Scotland would make its own choices, tailored to our own circumstances and the priorities of governments elected from time to time. The key point is that independence would afford us the policy autonomy – which the comparator countries already have – to create an economic model and pursue policies designed to better match the performance of these other countries.
Comparator country models
A) Social security regimes
There are different ways to categorise welfare states but a classic approach[95] identifies three main groups:
- Liberal: characterised by modest means tested benefits targeted at low income recipients and often associated with stigma;
- Conservative: prioritising family-based assistance; and,
- Social democratic: universal systems based on an equality of high standards and not an equality of minimal needs. Costs of caring for the young, ill and old are socialised resulting in high social costs which in turn incentivises full employment (i.e. the durability of the model rests on maintaining a high employment rate to sustain high social spending).
In this typology, the UK and Ireland are liberal regimes with elements of the other two (e.g. the UK health service), the Nordics social democratic and the other comparator countries conservative with, depending on the country, some social democratic or liberal characteristics. Different approaches to the welfare state help explain key differences between models including the extent of public spending and the prominence given to employability systems.
A key aspect of the comparator countries – and an area where the UK is something of an outlier amongst European nations – is the relative generosity of out-of-work benefits. The 'net replacement rate' (defined as the ratio of net household income during a selected month of the period of unemployment to the net household income before the job loss) ranges between low and extremely low across UK household types. As Table 1 confirms, net replacement rates tend to be significantly higher in the reference group nations, especially for single-person households.
| Household type (people/previous earnings as % of average wage/months unemployed) | ||||||
|---|---|---|---|---|---|---|
| Single person/ 100%/2 months | Single/ 67%/2 months | Single/ 67%/13 months | One earner couple, 2 children/ 100%/2 mths |
One earner couple with 2 children/ 100%/7 mths | Single adult, 2 children/ 100%/13mths | |
| Belgium | 68.2 | 89.9 | 64.2 | 64.9 | 59.2 | 61.9 |
| Denmark | 56.9 | 81.9 | 81.9 | 63.0 | 63.0 | 65.5 |
| N/lands | 74.5 | 71.4 | 68.4 | 78.2 | 74.9 | 66.8 |
| Austria | 55.0 | 55.0 | 50.6 | 59.3 | 59.3 | 55.8 |
| Finland | 54.4 | 58.0 | 58.0 | 61.7 | 61.7 | 67.0 |
| Sweden | 48.1 | 69.4 | 59.0 | 52.5 | 45.9 | 50.8 |
| Norway | 63.3 | 67.5 | 67.5 | 66.5 | 66.5 | 73.9 |
| Ireland | 27.9 | 36.8 | 38.0 | 54.8 | 54.8 | 41.6 |
| Switz/d | 71.3 | 71.6 | 71.6 | 81.9 | 81.9 | 82.4 |
| Iceland | 62.2 | 74.7 | 61.2 | 73.0 | 56.6 | 59.3 |
| UK | 15.3 | 21.60 | 21.6 | 44.3 | 44.3 | 38.1 |
Source: Eurostat Net Replacement Rate including Unemployment Benefit 2020
UK policy has tended to be designed in the belief that generous benefits will reduce work incentives and that the driving imperative should be to get people into jobs as quickly as possible.[97] However, experience in the comparator nations suggests that higher benefits not only cushion the impact of unemployment on household incomes, but can also help the labour market clear more efficiently. High replacement rates – and higher spend on active labour market policies – allow unemployed workers to take time to find a job that suits them leading to better 'matches' between employer and worker.[98] The stronger safety net also emboldens workers to change jobs more often – a key mechanism by which higher wages are achieved.[99]
Box 2: Tax and public spending
Public spending as a proportion of GDP and the taxation required to fund that spending are higher in all the comparator countries except Ireland and Switzerland.[100], [101] (See Figure 20 and Figure 21.)
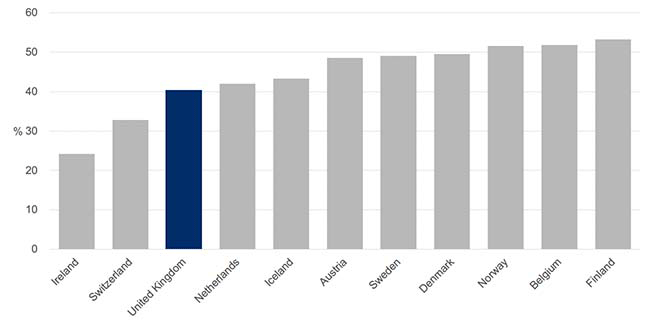
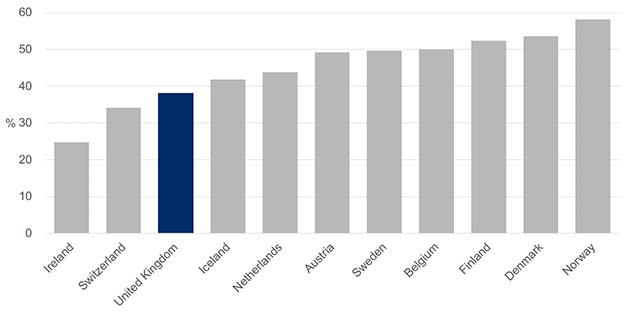
The experience of the comparator nations demonstrates the range of choices provided by independence. Ireland and Switzerland, where tax and spending are relatively low, have chosen developmental paths quite distinct from the higher spending, higher tax Nordic nations. The structure of taxation across countries also varies significantly.
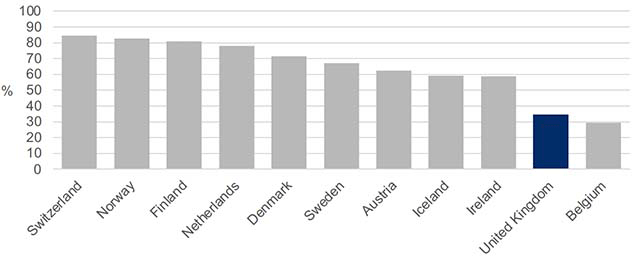
Why are most of the comparator countries able to sustain relatively high spending over the long-term? Evidence suggests that higher confidence in government is correlated with higher levels of willingness to comply with taxes[102] and, with the exception of Belgium, all the comparator countries are more successful in this respect:
Trust in government – percentage share of the population responding "yes" to the question "In this country do you have trust in national government?" – Switzerland 84.6%, Norway 82.9%, Finland 80.9%, Netherlands 78.1%, Denmark 71.6%, Sweden 67.1%, Austria 62.6%, Iceland 59.2%, Ireland 58.8%, UK 34.7% and Belgium 29.5%.[103] (See Figure 22.)
Source: OECD Trust in Government data
Since 1999, the Scottish Social Attitudes survey has found that, by a margin of 30 percentage points or more, adults in Scotland have been significantly more likely to say that they trust the Scottish Government to act in Scotland's best interests 'most of the time' or 'just about always', than to say that they trust the UK Government to do so.[104]
In a recent article for the Economics Observatory, the leading economist, Tim Besley, (also drawing on the Scottish Social Attitudes Survey data) noted that people in Scotland already have significantly more trust in Holyrood than UK citizens do in Westminster. He also notes that relatively high government revenues are not – as is often claimed – a barrier to growth and economic dynamism:
"Far from impeding prosperity, it is high-growth countries that tend to have a larger share of tax revenues in GDP. This is partly because governments with high fiscal capacity have strong incentives to invest in prosperity to maintain and build the tax base; and hence they tend to strengthen other branches of the state that support economic development. For example, investing in the health and education of citizens or regulating an economy in a way that supports growth will pay dividends in the form of higher tax revenue."[105]
Under independence, Scotland will have full control of fiscal powers and the ability to make its own choices on tax and spending. Of course, retaining the confidence of international financial markets requires all countries to be mindful of the impact of their policy choices on fiscal credibility. But Scotland will be able to chart a course on tax and public spending which, like the best performing comparator nations, can over the long-term help to balance social solidarity with economic dynamism.
B) Labour market policies
Denmark's 'flexicurity'[106] labour market has often been held up as a model for Scotland and others to seek to replicate.[107] A key feature of the flexicurity model is Denmark's very high spend on Labour Market Policies (LMPs). Denmark routinely spends more – often significantly more – on LMPs than any other advanced nation both in total[108] and on key LMPs such as 'training' and 'sheltered and supported employment and rehabilitation'.[109] Although Denmark is something of a positive outlier, all the other comparator nations spend significantly more than the UK where spend is exceptionally low.
The UK stopped participating in Eurostat and OECD surveys of LMP spend in 2011 and therefore up to date comparisons are impossible but in 2011 the UK was spending 0.5% of GDP on LMPs while, despite having a lower rate of unemployment, Denmark was spending 3.6%.[110] Denmark, Austria and Finland continue to spend significantly more on training than other OECD nations and Denmark is an outlier in terms of its spend on 'sheltered and supported employment and rehabilitation'.[111]
In these highly internationalised economies, it is accepted that some firms will fail to maintain competitiveness. However, public support for internationalisation is maintained in large part because of the strong support to displaced workers provided through relatively high benefits and access to quality retraining opportunities.[112]
Some LMP services are already the responsibility of the Scottish Government but it would be immensely challenging to fund a Danish-style LMP regime (costing between 3 and 4 % of GDP) under the limited fiscal powers of devolution.
Box 3: Sweden's Job Security Councils
The immediate and severe labour market impact of the COVID-19 pandemic provoked interest in the various institutions and mechanisms deployed in other countries to address employment insecurity and assist workers' transition into new jobs. Sweden's Job Security Councils (JSCs)[113] were highlighted by some but proposals for how similar bodies might be established in Scotland (or the UK) were often based on the erroneous assumption that JSCs are operated and funded by government. In fact, JSCs are an initiative of the social partners (trade unions and employers/employer federations) and function entirely independently of government. Therefore, considering the background to JSCs can help to illuminate some key differences between the approaches of the UK and comparator countries to labour market challenges and, more broadly, industrial transition.
What are Job Security Councils?
JSCs are non-profit foundations based on collective agreements between social partners. They provide support to employees who have lost – or are at risk of losing – their jobs due to collective redundancies (not dismissal on personal grounds). The JSC helps employees in their efforts to find new employment by providing advice and support on job search and application, training and business start-up support. JSCs:
- are funded through social partner contributions – there is no direct state funding. The premiums paid by participating companies vary between sectors and occupational groups. About 0.3% of the wage bill is paid by each affiliated company.
- are managed by a board of representatives from the different partners involved in the collective bargaining agreement, with the seats split equally between employer and worker representatives. The board decides on the scope and content of the support granted.
- cover most sectors, industries, occupational groups and types of companies.
- can provide support for extended periods of time – in some agreements, the support activities last for a maximum of five years, or until the employee has found a new job or chosen to discontinue their relationship with the council. However, support usually is provided for a period of six to eight months.
JSCs attract interest due to their success: as of 2019, 9 out of 10 active job-seeking clients found new jobs, entered education or training or became self-employed within seven months of their initial contact with the JSC. Around 7% of clients start own businesses and – crucially – 68% achieve an equal or higher salary earned in the job they were forced to leave.[114]
What can Scotland learn from Job Security Councils and other social partner-led initiatives?
In the UK, similar services are almost exclusively funded, and often provided, by the public sector. In Sweden – and other comparator nations – social partners are heavily involved in the design, delivery and funding of services which help to achieve excellent labour market outcomes. More generally, better resourced social partners, with high membership levels and relationships developed through sectoral collective bargaining, are well placed to contribute significantly to consensus-driven approaches to economic development and industrial transition.
C) Excellent business locations
The policy debate in the UK has often assumed a trade-off between the strength of social protections and the dynamism of the business environment – however the experience of the comparator nations confirms that this trade-off, if it exists at all, is a complex one. Indeed, recent research finds that a strong social safety net encourages the risk-taking that must be a necessary component of any successful innovation system.[115]
Data presented in earlier sections confirms that the comparator nations are productive, innovative and successful in international markets. Ireland, Denmark, Finland, the Netherlands, Sweden and Switzerland all have more tech start-ups per capita than the UK.[116]
Businesses in these nations are not heavily regulated or over-taxed.[117] OECD indicators of product and labour market regulation confirm that the UK is relatively deregulated but also that most of the comparator nations have levels of regulation below the OECD average.[118]
However, the comparator countries also benefit from a range of institutions that allow the economy to derive the benefits of a light regulatory regime whilst avoiding the potential downsides of, for example, low wage, insecure work.
D) Social partnership
Although different countries operate different models involving both formal and informal consultative mechanisms, all the comparator countries have (or in Ireland's case, has recently operated) highly developed forms of social partnership which has been defined as 'institutionalised co-operation between business and labour, sometimes overseen by governments'.[119] Social partnership refers primarily to a cooperative relationship between the central confederations of business and labour and to their joint involvement with government in the task of economic and social management. Social partnership is a major factor explaining the ability of the comparator nations to manage industrial change and pursue consensus-driven economic development.[120]
Social partnership reflects the fact that economic interests (employers and workers) are highly organised relative to the UK; both trade unions[121] and employer organisations[122] have much higher membership than their British counterparts and collective bargaining coverage is significantly broader.
Box 4: Danish Disruption Council
The Danish Disruption Council (DDC) provides a positive recent example of the consensus-driven approach to economic development that is a distinguishing characteristic of the comparator countries. In establishing the DDC, the Danish Government asserted that:
"We must carry on with the unique Danish tradition where solutions to major societal challenges are found in close cooperation between elected representatives, social partners, companies, civil society, experts and citizens. The Danish Disruption Council and the three most recent tripartite agreements on more apprenticeships, strengthened adult and continuing training, and integration of refugees to the labour market are good examples of that. The tripartite negotiations are based on a tradition that goes back more than a century, where the Government and the social partners have continually come together to take joint responsibility for balanced, responsible solutions to labour market challenges."[123]
The DDC's purpose[124] was to analyse, discuss and offer suggestions for:
- "The creation of a strong Denmark where we can optimally seize technological opportunities in a way that benefits all Danes."
- "Maintain and expand a labour market characterised by dynamism, well-regulated conditions and an absence of social dumping."
The DDC was chaired by the Prime Minister and comprised 8 Ministers and 32 permanent members including social partners (6 trade union representatives), business representatives and experts.[125] The Council met 8 times over 18 months between 2017 and 2018. It identified 15 objectives under 4 themes: a prosperous welfare state with only small social divisions; future education in a digital world; competitive companies that are digital frontrunners; a robust, safe and flexible labour market. Therefore, Denmark's approach benefitted from the knowledge and legitimacy conferred by close cooperation of all economic interests. Denmark currently tops the EU Commission's Digital Economy and Society Index.[126]
E) Business enterprise – ownership and governance
The ownership and governance of businesses across the comparator countries differ quite significantly from the UK: workers tend to be more involved in corporate governance and there is a higher prevalence of cooperative and mutual ownership.
Codetermination
Corporate governance in the UK is much more weighted towards the interests of shareholders and this contrasts with Europe where 'codetermination' (or 'works councils') – the practice whereby workers of an enterprise have the right to vote for representatives to the board of directors (on the first or second tier boards) – is generally the norm.[127] A variety of arrangements exist in the reference nations but only Belgium has no codetermination, although Ireland's codetermination rights are limited to state-owned commercial enterprises and Switzerland's works councils have no statutory basis. In Sweden, workers can elect 2 or 3 representatives to the (1-tier) board and in Norway one-third of the board is elected by workers. In Denmark, there is one-third board-level representation rights in firms with 35 or more employees.[128]
Benefits of codetermination can include higher productivity (albeit the effects are often small),[129] the embedding of a more long-term outlook relative to firms driven by shareholder value imperatives,[130] higher capital formation[131] and enhanced resilience[132] (for instance, recovering more quickly from the global financial crisis). Income inequality tends to be lower in countries with far-reaching codetermination rights.[133]
Cooperatives, mutuals and foundations
The comparator nations all have high levels of cooperative ownership relative to the UK. The World Cooperative Monitor 2021 assesses the UK as having only 5 of the top 300 Cooperatives in the world as measured by turnover. Despite all having significantly smaller populations, Belgium and Austria have 4 each, Norway and Sweden 7 each, Denmark 9, Finland 10 and the Netherlands 17. France and Germany have 35 and 31 respectively.[134]
Cooperatives also account for substantial market shares in industries:[135]
- Agriculture – 83% in the Netherlands, 79% in Finland
- Forestry – 60% in Sweden and 31% in Finland
- Banking – 35% in Finland, 31% in Austria
- Retail – 36% in Finland and 20% in Sweden
- Pharmaceutical and health care – 18% in Belgium
A range of studies associate employee ownership with better productivity, pay, job stability, the creation and anchoring of jobs in local communities and firm survival.[136]
Box 5: Danish Industrial Foundations
Industrial foundations[137] can be found all over the world and include Tata Group (India), Hershey (US), Bosch (Germany) and The Guardian (UK). However, foundations are particularly prevalent in northern Europe, especially in Denmark which has some 1300 foundations accounting for around 70% of the total market capitalisation of the Copenhagen Stock Exchange. Foundations own three of the four largest Danish companies: AP Moller-Maersk, Novo Nordisk and Carlsberg.
Foundation ownership is a unique governance structure arising when a controlling stake in a company is donated to a foundation. The specific approach of each foundation depends on the charter describing their purpose and governance. Foundation ownership is long-term by design. Industrial foundations hold on to their companies as long as they can – in principle forever. This long-termism is in stark contrast to the rapid buying and selling of shares on modern stock exchanges.
Defined as a foundation which owns one or more business companies, in legal terms industrial foundations are characterised by the following:
- Creation by donation (i.e. an irrevocable separation from the founder)
- Independence (a separate legal personality for the foundation)
- A non-selfish purpose (which goes beyond benefitting the founder)
- A foundation endowment (shares in a company plus, in most cases, a pool of liquid financial assets)
- A foundation organisation (i.e. a board of directors or trustees)
- A foundation charter (the constitution set up by the founder including goals and governance rules)
- Majority control (voting majority) of a business company
- Outside supervision (to ensure that the charter and the law are upheld, for example a regulator to whom the foundation is obliged to submit its annual reports)
Overall foundation-owned firms perform well in comparison with other firms:
- Larger foundation-owned firms have higher accounting profitability than the average Danish firm, although, some studies have found that industrial foundation-owned firms overall sometimes have lower profitability. However, the differences are not large and the same studies find that foundation owned firms take on less risk, have lower leverage and less volatile returns. Thus, risk adjusted returns may not be that different.
- Large foundation-owned firms have outstanding reputations which reflecting their commitment to social responsibility and long-termism.
- Foundation-owned firms achieve higher returns on their foreign direct investment and the high performing foundation-owned firms are more likely to be active in R&D.
- On the negative side, foundation-owned firms do tend to grow more slowly. One reason may be that they are more likely to be capital constrained i.e. less likely to borrow or issue new equity because they want to maintain control and ensure the survival of the company.
Foundations are simply another reflection of the different approaches to ownership and governance across comparator nations, approaches that contribute to better national outcomes. The Scottish Government recently established the Business Purpose Commission to advise on what might be achieved within devolved powers to further embed the purpose driven approaches which contribute to higher productivity and innovation as well as better social outcomes. Independence would significantly extend the scope for further approaches to shift Scotland away from the UK's prevailing short-termist business culture.