Independence in the modern world. Wealthier, happier, fairer: why not Scotland?
This paper sets out a detailed analysis of the UK’s performance across a range of economic and social indicators relative to that of ten European countries. It is the first in the 'Building a new Scotland' series, focusing on independence.
10 key facts on the UK's comparative performance
This paper compares the UK's performance across a range of economic and social indicators with that of Scotland's neighbours in Europe: Denmark, Sweden, Finland, Norway, Iceland, Ireland, Switzerland, Austria, Belgium and the Netherlands – referred to as 'the comparator countries'. The choice of comparator countries is explained in the Economic and Social Context section of this paper.
The evidence presented in this next section of the paper is clear-cut: these countries frequently outperform the UK, with the best performers creating virtuous cycles by which economic dynamism and social solidarity become mutually reinforcing.
The comparator countries are wealthier
The comparator countries are wealthier – some much wealthier – than the UK
In 2020[1] gross domestic product (GDP) per capita was as follows: Ireland ($87,735 – please refer to footnote),[2] Switzerland ($66,674), Norway ($60,912), Denmark ($51,772), Netherlands ($51,572), Iceland ($49,416), Sweden ($49,098), Austria ($48,908), Belgium ($45,559), Finland ($44,451) and the UK ($40,607). The UK's GDP per capita fell below the Organisation for Economic Co-operation and Development (OECD)[3] average ($40,941) in 2020 (measure: US Dollars, constant prices, 2015 Purchasing Power Parities (PPPs)).[4] (See Chart 1.)
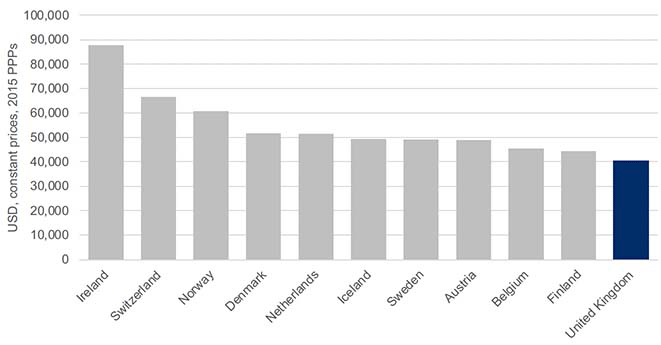
Source: OECD level of GDP per capita and productivity dataset
The comparator countries have maintained the wealth gap with the UK over time
With the exception of one country in one year (Finland in 2015), GDP per capita has been higher than the UK in all the comparator countries in every year since 2000.[5] (See Chart 2.)
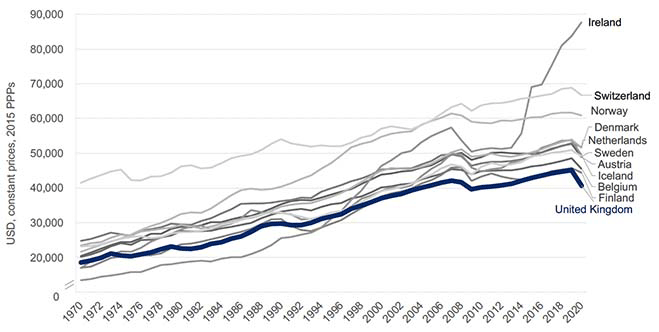
Source: OECD level of GDP per capita and productivity dataset
The comparator countries are fairer
Income inequality is lower in the comparator countries
All the comparator countries have significantly lower income inequality than the UK, with Iceland, Norway, Belgium, Denmark, Finland, Austria and Sweden among the ten most equal nations.[6] (See Chart 3.)
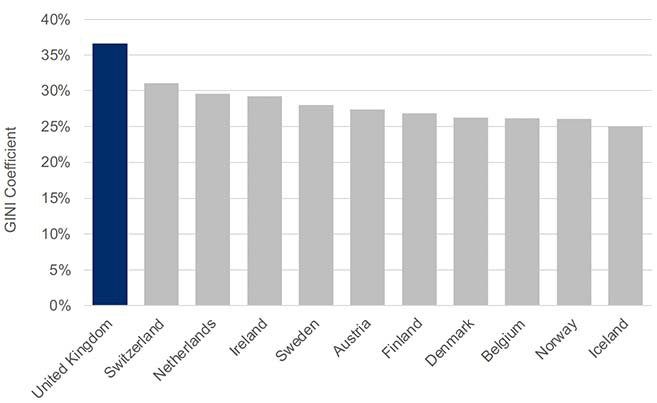
Source: OECD income inequality data
Poverty rates are lower in the comparator countries
In 2020, out of 40 countries in the OECD statistics, Iceland had the lowest rate of poverty followed by Denmark (3rd), Finland (4th), Ireland (5th), Belgium (8th), Netherlands (9th), Norway (11th), Sweden (13th), Austria (16th), Switzerland (17th) and the UK (23rd).[7] (See Chart 4.)
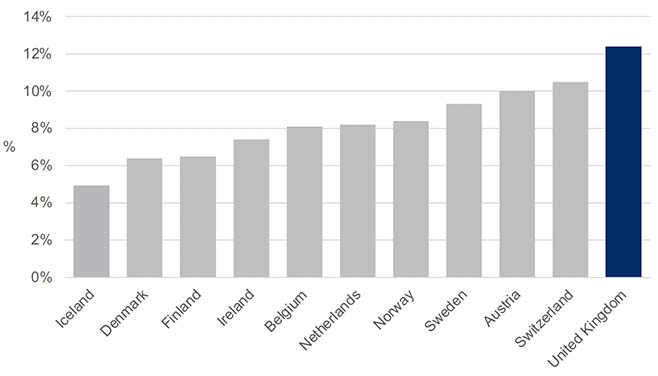
Source: OECD poverty rate data
There are fewer children and pensioners living in poverty in the comparator countries
In 2020, the poverty rates for children (aged 0-17 years) and pensioners (aged over 66 years) were lower in all the comparator countries than in the UK – with the exception of pensioners in Switzerland.[8] (See Chart 5.)
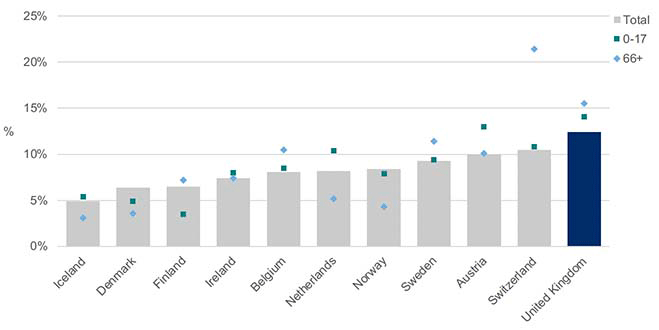
Source: OECD poverty rate data
The comparator countries have higher social mobility
Comparator countries account for the top nine places in the World Economic Forum's Social Mobility Index 2020 which ranks 82 countries; Ireland is 18th and the UK 21st.[9] (See Chart 6.)
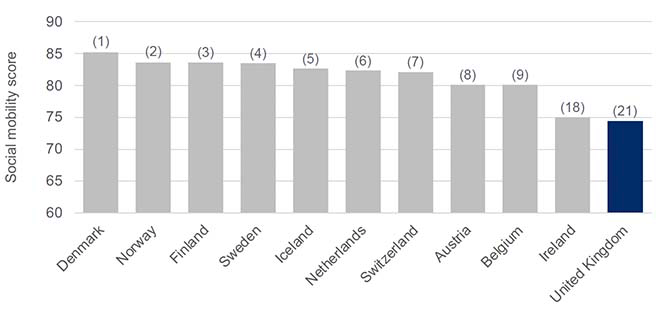
Source: Global Social Mobility Index 2020 | World Economic Forum (weforum.org)
Most of the comparator countries have a smaller gender pay gap
In 2018 – the most recent year for which Eurostat data for all countries are available – only Austria had a higher gender pay gap than the UK. Belgium had the lowest gap, at 5.8%, followed by Ireland 11.3%, Sweden 12.1%, Norway 13.2%, Iceland 13.8%, Denmark 14.6%, Netherlands 14.7%, Finland 16.9%, Switzerland 18.6%, UK 19.8%, and Austria 20.4%.[10] (See Chart 7.)
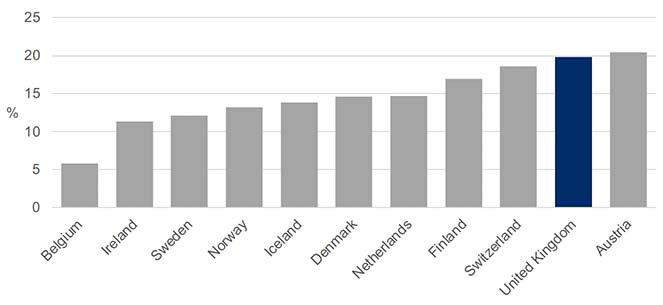
Source: Eurostat – Gender pay gap in unadjusted form statistics (europa.eu)
The comparator countries have more productive and innovative economies
The comparator countries have higher productivity – often significantly higher – than the UK
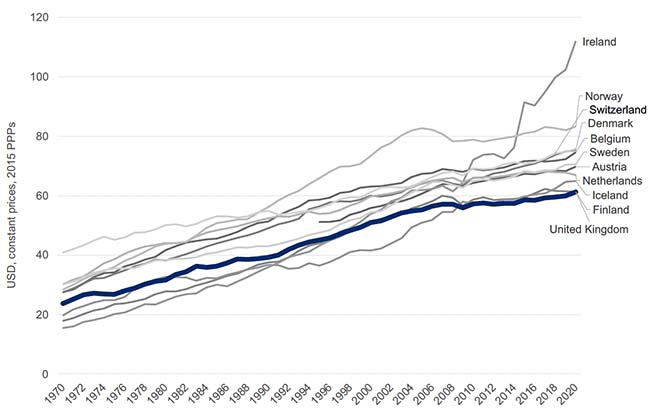
In 2020, GDP per hour worked (US Dollars, constant prices, 2015 PPPs) was as follows: Ireland (111.8),[11] Norway (83.2), Switzerland (75.7), Denmark (75.4), Belgium (74.5), Sweden (70.5), Austria (69.8), Netherlands (67.0), Iceland (64.9), Finland (61.3) and the UK (61.3).[12] (See Chart 8.)
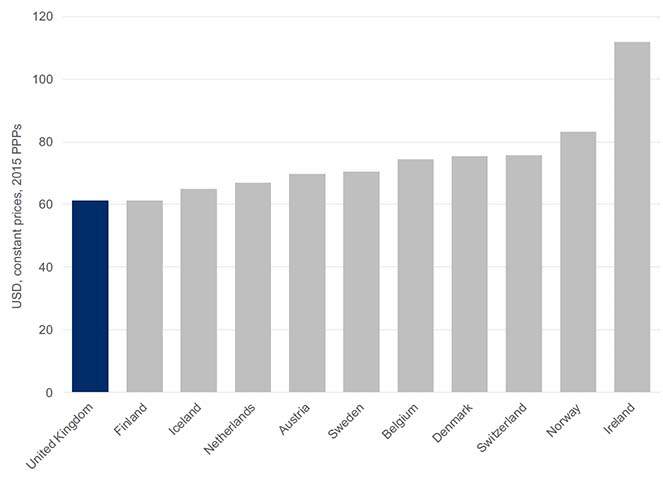
Source: OECD level of GDP per capita and productivity dataset
Again, the relatively better performance has been maintained over time. With the exception of Finland and Iceland in some years, productivity has been higher in all comparator countries in every year since 2000. (See Chart 9.)
Source: OECD level of GDP per capita and productivity dataset
Gross expenditure on research and development is higher
All the comparator countries except Ireland spend more on research and development than the UK. The full OECD dataset over time shows that the UK has spent below the OECD average in every year since 2000, while Denmark, Finland and Sweden have spent well above.[13] (See Chart 10.)
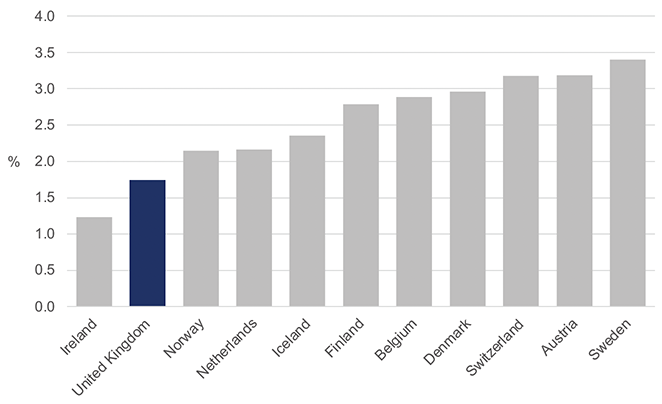
Source: OECD gross domestic spending on research and development (R&D) data
Business investment is higher
Business investment is higher in all the comparator countries for which we have data, in most years.[14] (See Chart 11.)
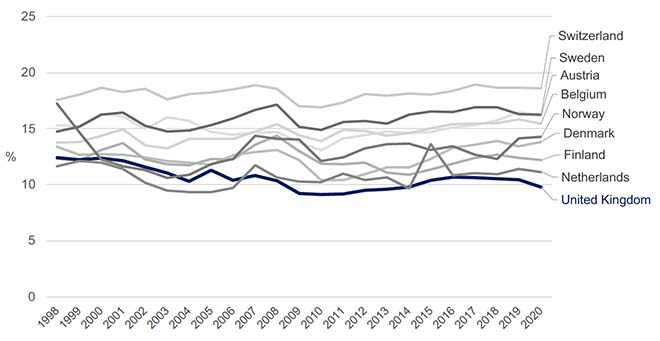
Sources: GDP and spending – Investment by sector – OECD Data and Gross fixed capital formation (% of GDP) | Data (worldbank.org). Business investment as a share of GDP has been calculated by multiplying Gross Fixed Capital Formation (GFCF) expressed as a percentage of GDP by the proportion of corporate investment in total GFCF for each country.
These 10 key facts, and their associated charts, are now considered in more detail in the main body of the paper.