Housing Statistics 2020 & 2021: Key Trends Summary
Annual statistics up to 31 March 2021 on total new housing supply in Scotland across all sectors, along with information on various elements of local authority housing such as stock, lettings, house sales, evictions, housing lists, and housing for older people and people with disabilities.
Local Authority Lettings
During 2020-21 there were 19,630 permanent lettings made, a decrease of 6,376 lets (25%) compared to the previous year, with the total number of lets made likely to have been impacted on by COVID-19 restrictions.
Note that some figures on the number of local authority lets across the 2020-21 financial year have been published by the Scottish Housing Regulator as part of monthly and quarterly COVID-19 Dashboard reporting since the beginning of the pandemic period. The figures being reported in this section therefore cover some of the trends already reported by the Scottish Housing Regulator over recent months, although there are some minor differences in the exact figures presented due to the different data collection and quality assurance processes undertaken.
Of all the local authority lettings made in 2020-21, 48% were to homeless households, a higher proportion than in 2019-20 (42%). Correspondingly, 29% of lets made in 2020-21 were to housing waiting list households, a lower proportion than in 2019-20 (34%).
Mirroring falling stock levels, the number of local authority lettings decreased each year throughout the 2000s (Chart 12) until 2008-09. The number of lettings increased slightly each year between 2011-12 and 2013-14, then decreased before remaining relatively steady each year until 2019-20.
During 2020-21 there were 19,630 permanent lettings made, a decrease of 6,376 lets or 25% on the 26,006 permanent lettings in 2019-20.
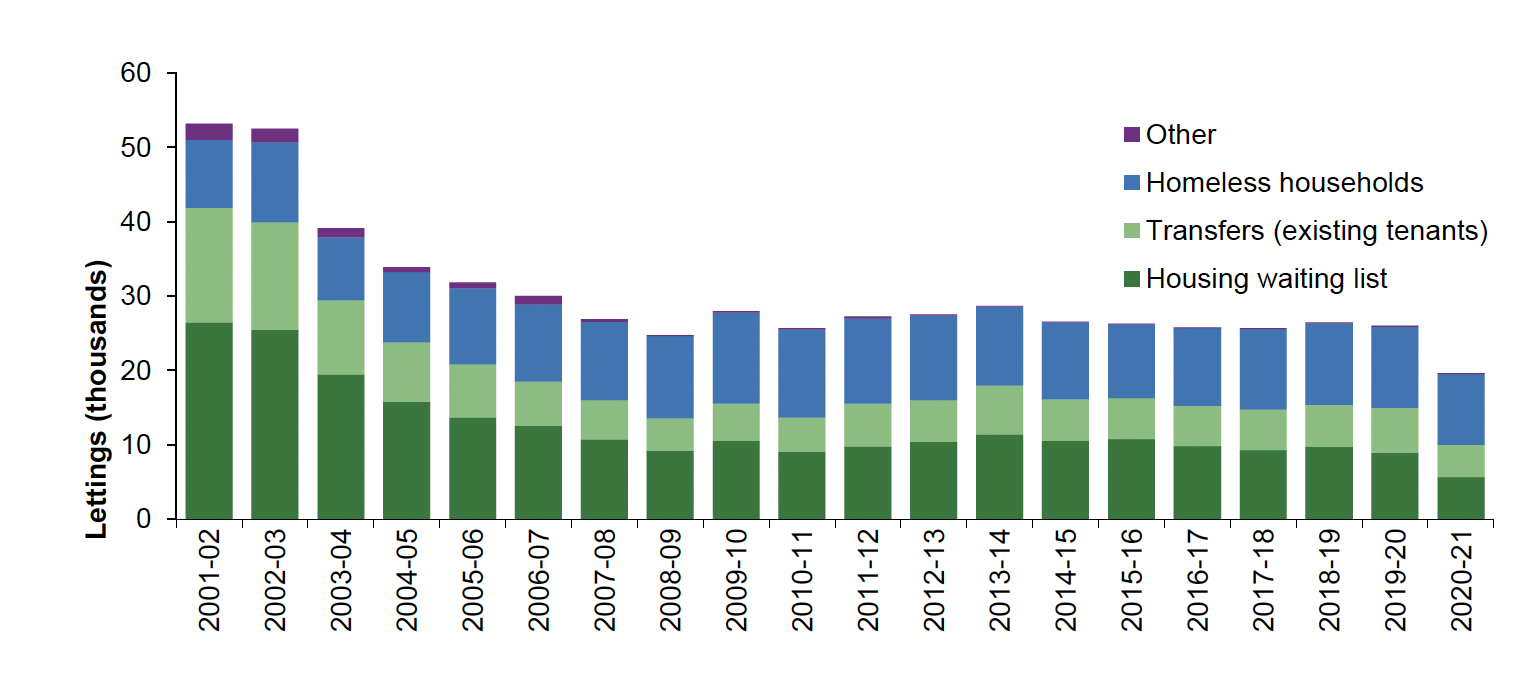
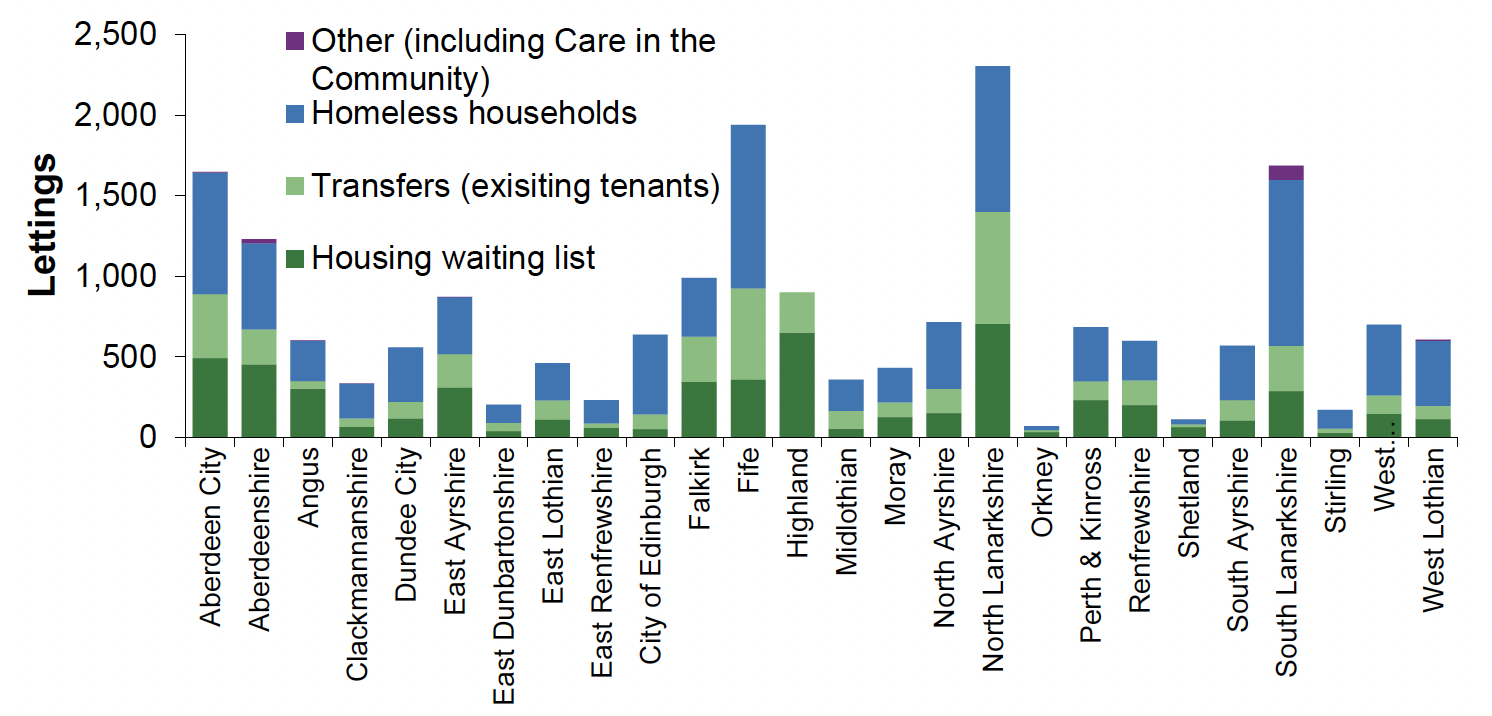
Chart 13 shows that there were some regional variations in the proportion of permanent lettings by source of tenant. For example, lets to homeless households made up 77% of all permanent lettings in Edinburgh, compared to 28% in Shetland. The proportion of lets made to housing waiting list applicants varied between 8% in Edinburgh, to 72% in Highland
Further detailed figures are available in the local authority lettings Excel webtables.
The Scottish Government also publishes a range of information on Homelessness Statistics, including the number of lets for homeless households, collected through the HL1 return.