Housing Statistics 2020 & 2021: Key Trends Summary
Annual statistics up to 31 March 2021 on total new housing supply in Scotland across all sectors, along with information on various elements of local authority housing such as stock, lettings, house sales, evictions, housing lists, and housing for older people and people with disabilities.
New Housing Supply
15,360 new houses were built, refurbished or converted in 2020-21, 7,687 homes (33%) fewer than in 2019-20. This is the first annual fall since 2012-13, and is the lowest figure recorded since 2012-13, reflecting the impact of COVID-19 restrictions on housebuilding. Before the pandemic, new housing supply had reached its highest point since the financial crisis in 2008, with 23,047 new homes built, refurbished, or converted in 2019-20. This was, however, 16% below the 27,594 new supply in 2007-08.
New housing supply comprises the following elements:
- new house building: houses completed by or for housing associations, local authorities or private developers for market sale, below market rent or low cost home ownership;
- rehabilitation: houses acquired by housing associations and refurbished either for rent or low cost home ownership. Refurbishment of private dwellings funded wholly or partly through the Affordable Housing Supply Programme (AHSP); and
- conversion: net new dwellings created by conversion from non-housing to housing use or by alterations to existing dwellings in all tenures.
Note that this measure of new housing supply doesn't take into account any dwellings removed from the housing stock through demolitions. Annual figures on demolitions are published in the Conversions and Demolitions Excel webtables. However these demolitions figures are not comprehensive and we advise that they should be considered as a minimum level of demolition activity in Scotland. This is due to local authorities differing in their ability to provide information on demolitions across tenures other than for local authority housing stock.
The total supply of new housing decreased by 7,687 homes (33%) between 2019-20 and 2020-21.
As reported on in previous quarterly housing statistics releases, there were 2,364 housing association new build completions in 2020-21, a decrease of 1,840 homes or 44% on the previous year. Local authority new build completions totalled 1,411 homes, a decrease of 57 homes (4%) compared with 2019-20.
A total of 11,023 homes were built by the private sector in 2020-21, a decrease of 5,344 homes (33%) from the 16,367 homes built in 2019-20.
The number of rehabilitations decreased from 333 in 2019-20 to 110 in 2020-21, and the net number of buildings converted to housing use decreased by 223 homes from 675 to 452 See Table 1 below and Chart 1 (page1).
| Private new build | Housing association new build | Local authority new build | Rehabilitation | Net conversion | Total housing supply | |
|---|---|---|---|---|---|---|
| 1996-97 | 17,492 | 2,963 | 241 | 936 | 1,244 | 22,876 |
| 1997-98 | 17,984 | 4,489 | 114 | 1,478 | 958 | 25,023 |
| 1998-99 | 18,784 | 1,753 | 120 | 344 | 958 | 21,959 |
| 1999-00 | 19,074 | 3,964 | 69 | 413 | 1,151 | 24,671 |
| 2000-01 | 18,195 | 3,804 | 112 | 971 | 1,103 | 24,185 |
| 2001-02 | 18,309 | 4,197 | 65 | 597 | 1,311 | 24,479 |
| 2002-03 | 18,938 | 3,715 | 94 | 514 | 1,305 | 24,566 |
| 2003-04 | 20,456 | 3,368 | 0 | 410 | 1,409 | 25,643 |
| 2004-05 | 22,449 | 4,024 | 0 | 677 | 1,336 | 28,486 |
| 2005-06 | 20,260 | 4,698 | 0 | 469 | 1,695 | 27,122 |
| 2006-07 | 21,043 | 3,231 | 6 | 437 | 1,702 | 26,419 |
| 2007-08 | 21,663 | 4,097 | 28 | 389 | 1,417 | 27,594 |
| 2008-09 | 16,111 | 4,577 | 336 | 427 | 923 | 22,374 |
| 2009-10 | 11,139 | 5,576 | 413 | 442 | 920 | 18,490 |
| 2010-11 | 10,713 | 5,111 | 614 | 297 | 591 | 17,326 |
| 2011-12 | 10,178 | 4,776 | 1,114 | 338 | 644 | 17,050 |
| 2012-13 | 9,892 | 3,244 | 963 | 291 | 550 | 14,940 |
| 2013-14 | 11,088 | 2,911 | 1,140 | 711 | 509 | 16,359 |
| 2014-15 | 12,565 | 3,064 | 1,116 | 224 | 644 | 17,613 |
| 2015-16 | 13,433 | 2,320 | 1,104 | 457 | 684 | 17,998 |
| 2016-17 | 13,424 | 2,754 | 1,018 | 599 | 791 | 18,586 |
| 2017-18 | 13,033 | 3,170 | 1,370 | 946 | 739 | 19,258 |
| 2018-19 | 15,789 | 4,086 | 1,392 | 316 | 665 | 22,248 |
| 2019-20 | 16,367 | 4,204 | 1,468 | 333 | 675 | 23,047 |
| 2020-21 | 11,023 | 2,364 | 1,411 | 110 | 452 | 15,360 |
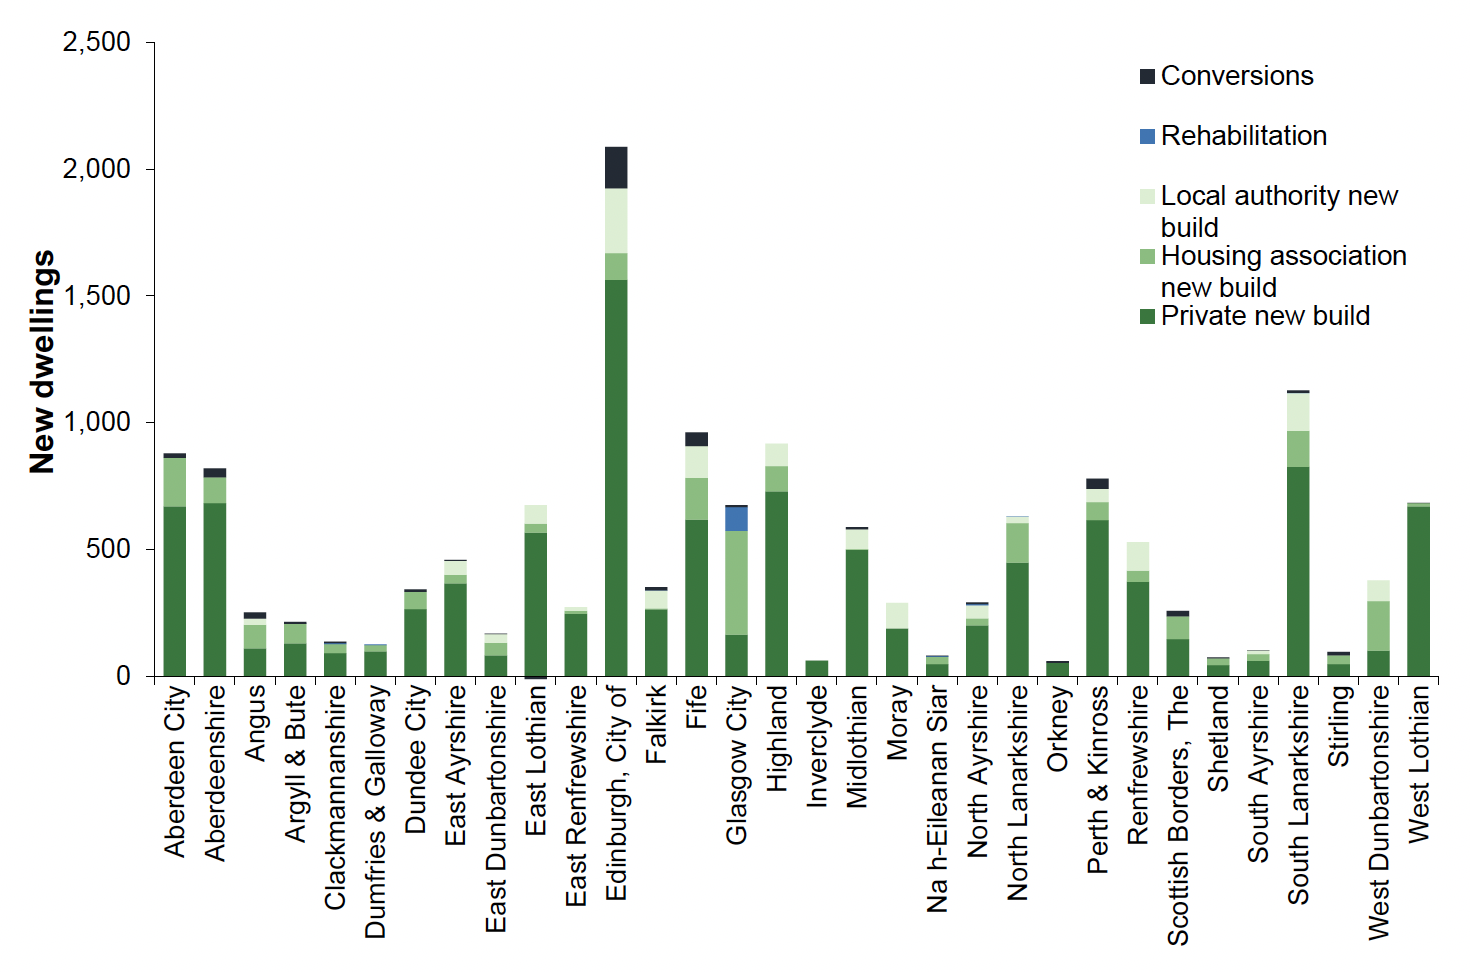
The components of housing supply within each local authority area for 2020-21 are shown in Chart 2. Together Edinburgh, South Lanarkshire, Fife, Highland, Aberdeen City, Aberdeenshire, and Perth & Kinross accounted for almost half (49%) of Scotland's new housing supply.
The proportions of housing supply accounted for by each grouping vary by local authority. For example, in Glasgow 61% of the new supply was housing association homes, 14% from rehabilitation, and 24% from private led construction. The majority (75%) of the new supply in Edinburgh was from private sector new build with a further 5% from housing association new build and 12% from local authority new build. Private sector new build accounted for 100% of Inverclyde's new housing supply. Moray (35%) had the highest proportions of their new supply as local authority new build housing.
Further detailed figures are available in the Housing Supply Excel webtables.