Housing Statistics 2020 & 2021: Key Trends Summary
Annual statistics up to 31 March 2021 on total new housing supply in Scotland across all sectors, along with information on various elements of local authority housing such as stock, lettings, house sales, evictions, housing lists, and housing for older people and people with disabilities.
New Housebuilding
The new housebuilding figures for 2020-21 have been included in this section to show the contribution of new housebuilding to new housing supply up to 2020-21, however note that these financial year based figures were first published in the Quarterly Housing Statistics update on 29th March 2022. This quarterly release also included the most recent figures up to end June 2021 for all-sector and private-led new housebuilding, and up to end September 2021 for social sector new housebuilding.
In 2020-21, 14,798 new build houses were completed in Scotland, a decrease of 7,241 homes (33%) on the previous year when 22,039 had been completed, the first fall after seven years of increasing completions since 2012-13.
During the same time period the number of new houses started decreased by 7,774 homes (31%) from 25,279 in 2019-20 to 17,505 in 2020-21.
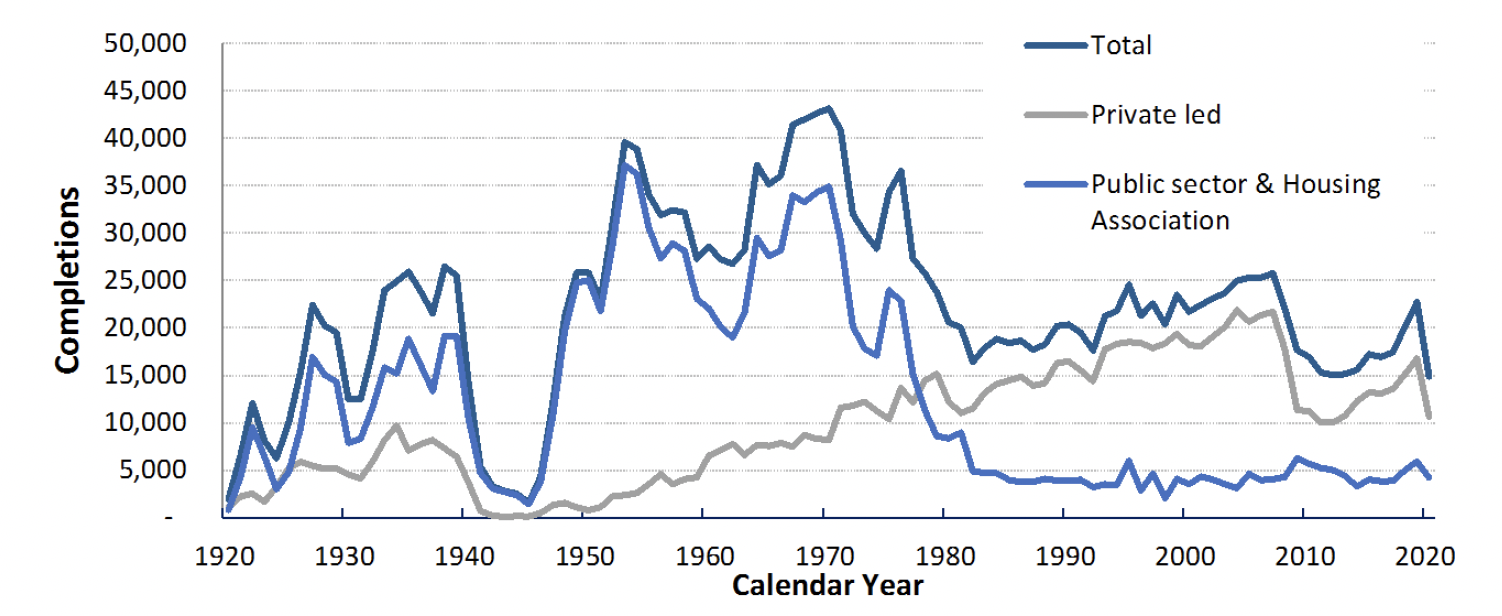
The late 1960s and early 1970s saw about 41,000 to 43,000 new houses completed each year. This was primarily due to programmes of post-war reconstruction and slum clearances which saw huge numbers of, predominantly public sector, housing being built.
Throughout the 1970s and early 1980s the level of new build fell and fewer than 20,000 homes were completed each year throughout much of the 1980s. This was caused by a large decline in the number of social sector houses being built. Meanwhile the number of new private houses was generally on the rise and continued to increase until the economic downturn in 2008. By 2007-08 private sector new build represented around 84% of all completions compared to between 3% and 7% in the early part of the 1950s.
The recession in 2008 hit the private house building industry particularly hard, and by 2012-13 starts and completions had fallen by 47% and 54% respectively since 2007-08. The numbers of homes completed by the private sector generally increased on an annual basis each year between 2012-13[1] and 2019-20, before falling by 33% to 11,023 in 2020-21 due to COVID-19 restrictions. The number of starts stands at 13,406, down by 21% from 2019-20.
There were 2,364 Housing Association new build completions in 2020-21, 44% less than in 2019-20. There were 2,759 Housing Association new build approvals in 2020-21, a decrease of 55% on 2019-20, reflecting the impact of coronavirus on housebuilding.
After years of very few local authority new build housing completions in Scotland the Scottish Government's introduction of the Council House Building programme in 2009-10 has seen significant numbers of new council houses being built, though this too has been impacted by COVID-19 in the most recent year. There were 1,411 local authority completions in 2020-21, which is 57 houses (4%) less than in 2019-20. There were 1,340 local authority starts in 2020-21, 905 houses (40%) fewer than the previous year.
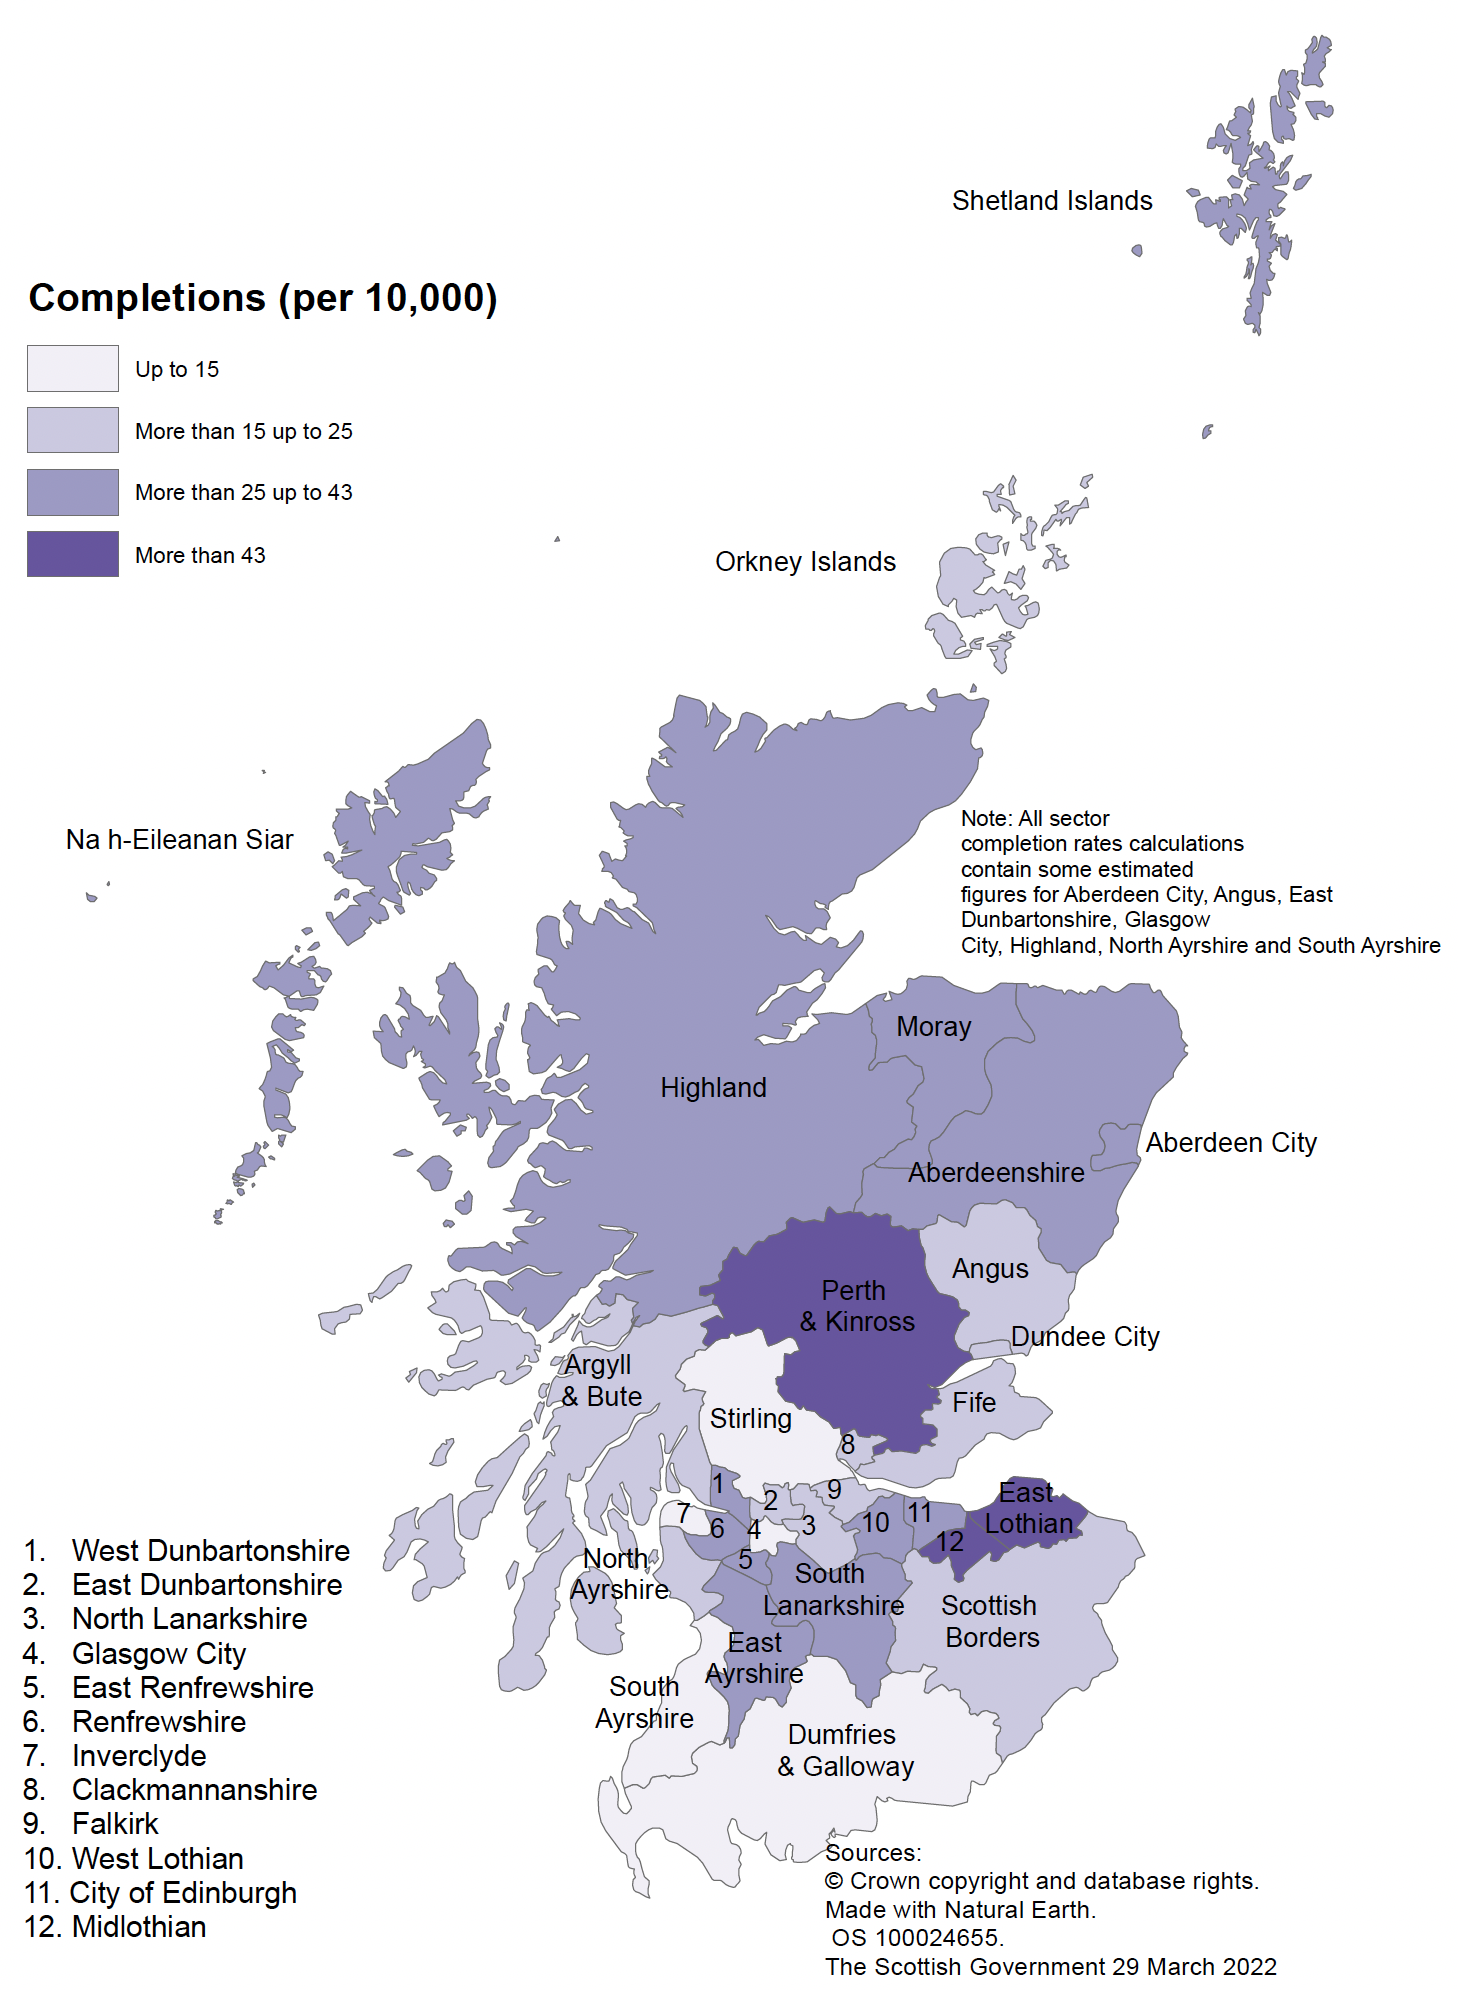
The map on the following page shows the rates of housing completions in 2020-21 (across all tenures) relative to the population size of each local authority in Scotland. The highest rates were observed in East Lothian, Midlothian, Perth & Kinross, and West Dunbartonshire, with rates of more than 40 homes per 10,000 of population. The lowest rates were observed in Inverclyde, Dumfries & Galloway, Stirling, Glasgow City, and South Ayrshire, with less than 10 completions per 10,000 people.
Further detailed figures are available in the new housebuilding Excel webtables, along with the new build housing starts and completions Open Data tables.
Latest commentary and charts on all-sector new build housing activity to end June 2021, including comparisons to other UK countries, is available in the Housing Statistics for Scotland Quarterly Update March 2022 publication.
The latest published quarterly figures show that there were 18,974 all-sector new build homes completed in Scotland in the year to end June 2021, an increase of 10% (1,751 homes) on the 17,223 completions in the previous year. Increases in the latest year were seen across private-led completions (12% or 1,495 homes) and local authority completions (83% or 876 homes). Housing association completions however dropped by 17% or 620 homes.