Housing Statistics 2020 & 2021: Key Trends Summary
Annual statistics up to 31 March 2021 on total new housing supply in Scotland across all sectors, along with information on various elements of local authority housing such as stock, lettings, house sales, evictions, housing lists, and housing for older people and people with disabilities.
Local Authority Housing Stock
Local authority stock levels have decreased since the 1980s, before beginnning to plateau in the 2010s, as shown in Chart 6 in the previous section. Following this, local authority stock levels have been increasing every year between 2018 and 2021. As of 31st March 2021 there were 318,369 local authority units, up by 1,461 units (0.5%) on the 316,908 units in 2020.
The drops in the years since the 1980s can be attributed to 3 main factors:
- tenants buying their homes under Right to Buy
- transfers of stock from public authorities to Registered Social Landlords (RSLs)
- a decline in the number of new local authority dwellings being built.
In general these factors have become less significant in recent years, and the provision to end Right to Buy with a two year notice period was included in the Housing (Scotland) Act which received Royal Assent on 1st August 2014, with the scheme subsequently closing to all new applicants on 31st July 2016. Further details of previous trends in Right to Buy sales are available in the Sales of Social Sector Housing Excel webtables.
In addition to this, the Scottish Government's introduction of the Council House Building programme from 2009-10 onwards has seen significant numbers of new council houses being built in the years since this. As a result, local authority stock levels have been increasing every year since 2018.
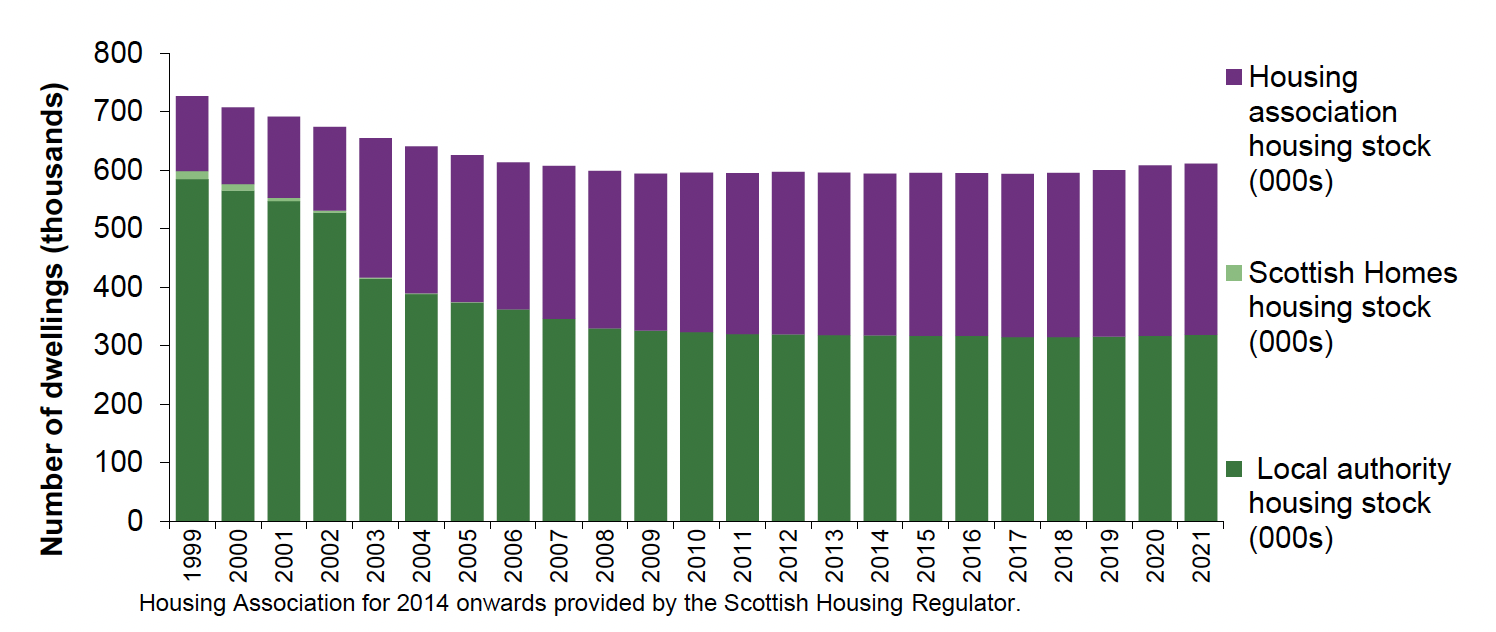
Local authority stock levels have increased by 1,461 units (0.5%) from 316,908 in 2020, to 318,369 units on 31st March 2021, and which compares to housing assocation stock of 292,951 as at 31st March 2021. This represents a substantial change since the mid-1990s when public authorities owned nearly 90% of the 783,000 units of social rented stock as at December 1995. The increased contribution of housing associations to the social rented sector is reflected in their rising stock levels since the late 1990s. Chart 8a below shows recent trends in the ownership of social rented housing stock.
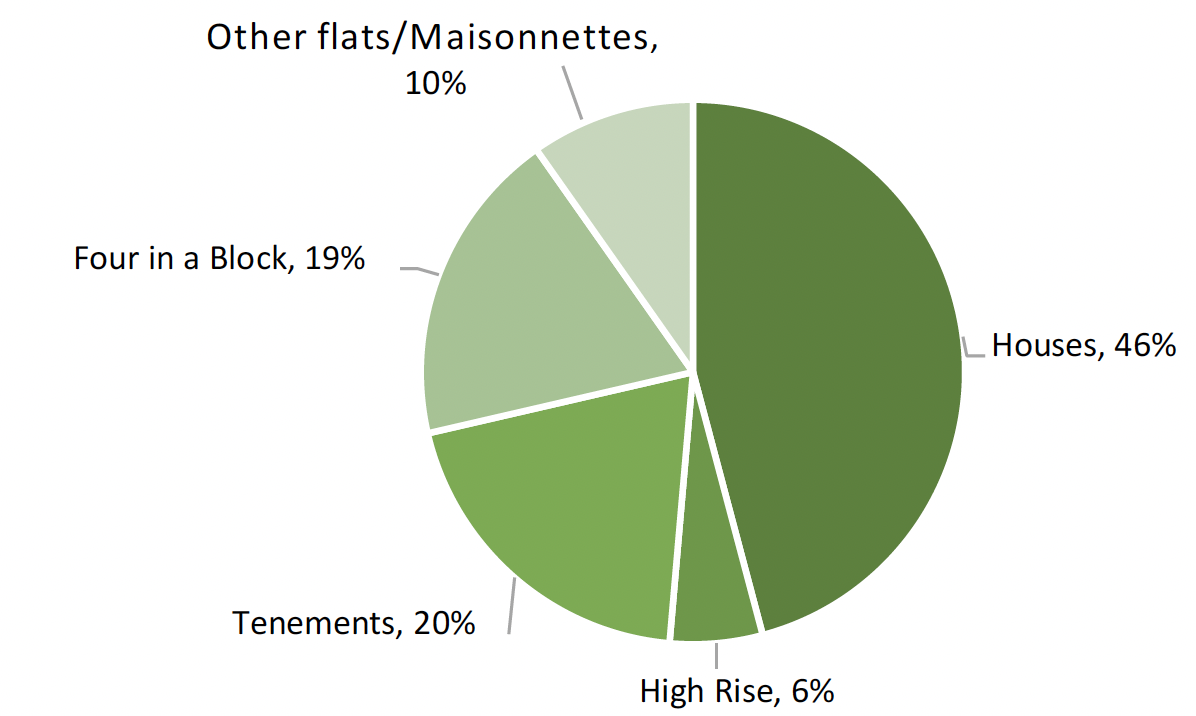
Looking at local authority owned housing stock by dwelling type, 46% of local authority housing stock at March 2021 were houses. The remaining stock consists of 4 in a block (19%), tenement flats (20%), high rise flats (5%), and other types of flats and maisonettes (10%).
There were some regional variations in the type of stock held by the different councils. Local Authorities with the highest percentage of houses were Shetland (84%), Orkney (83%), Moray (76%) and Highland (73%).
Edinburgh and Renfrewshire had relatively high percentages of their stock as flats (81% and 78% respectively).
The highest proportions of stock in high-rise flats were seen in Aberdeen City (18%), Edinburgh (15%), and West Dunbartonshire (11%), whilst tenement flats were relatively common in Dundee (52%) and Edinburgh (51%).
In West Dunbartonshire, 29% of stock was in 4 in a block flats with South Ayrshire and West Lothian following up with 28% and 27% respectively.
Further detailed figures are available in the local authority housing stock Excel webtables.