Housing Statistics 2020 & 2021: Key Trends Summary
Annual statistics up to 31 March 2021 on total new housing supply in Scotland across all sectors, along with information on various elements of local authority housing such as stock, lettings, house sales, evictions, housing lists, and housing for older people and people with disabilities.
Stock by Tenure to end March 2020
As at 31st March 2020, there were an estimated 2.6 million dwellings in Scotland, with an estimated 58% of dwellings being owner occupied, 4% being vacant or second homes, 15% being private rented or where the household is living rent free, and 23% being social rented properties.
Note within this section that figures presented on the number of privately rented and owner occupied dwellings should be treated as approximate estimates given that these are based on survey data from the Scottish Household Survey, from which there will be a margin of error associated with the results. In addition, estimates for the owner occupier and rented privately categories for the year 2020 are not directly comparable to previous years, due to the change in the methodology of the Scottish Household Survey in 2020 due to the pandemic period.
This differs from the figures presented on the number of social rented dwellings, which are based on administrative counts of units of stock held by local authorities and housing associations, and therefore are likely to be more accurate counts of the exact numbers of dwellings.
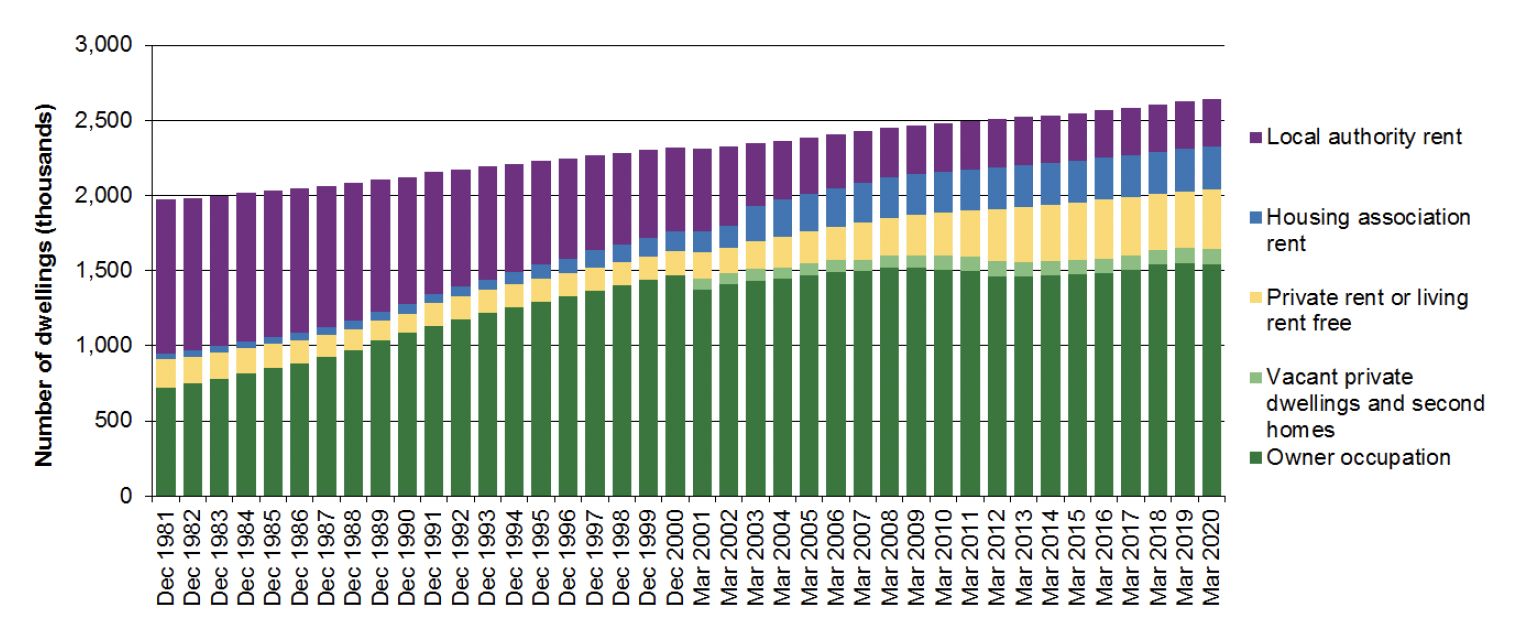
The number of dwellings in Scotland has increased by 675,000 (34%) over the last 4 decades, from 1.97 million in 1981 to 2.65 million in 2020. This has coincided with an increasing Scottish population and the increased prevalence of smaller households.
Chart 6 presents trends from 1981 across all tenure types. This shows the substantial increase in owner occupation between 1981 and 2001, and the corresponding decrease in local authority rented dwellings, with the reduction in local authority stock over this period generally attributed to tenants buying their homes under Right to Buy, transfers of stock to housing associations, and a decline in the number of new local authority dwellings being built.
Over the more recent period since 2008, it can be seen that the reduction in owner occupation between 2008 and 2014 has coincided with an increase in the number of households renting privately or living rent free from 10% (around 248,000 dwellings) in 2008 to 15% (around 382,000 dwellings) in 2015. This may have been partly caused by the economic downturn and the difficulty potential home owners have subsequently experienced in securing a mortgage. Although the number of households renting privately or living rent free has remained relatively stable over more recent years.
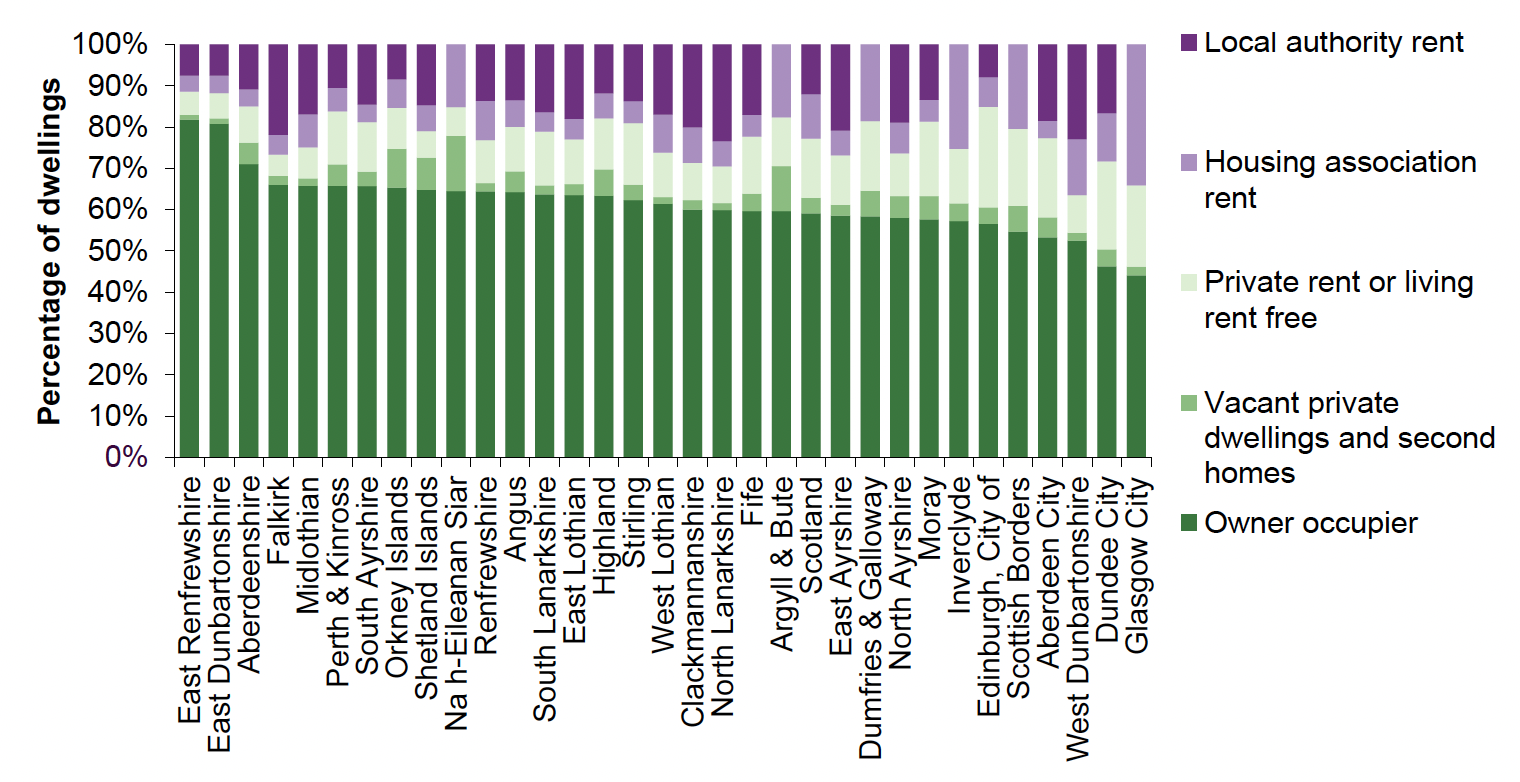
Local authority level tenure estimates are shown in Chart 7, based on latest available local authority level figures for the year 2019. The rate of owner occupation varies from 82% in East Renfrewshire to 44% in Glasgow City. In general, cities have lower owner occupation rates.
The proportion of dwellings rented privately is estimated to range from 5% in Falkirk to 24% in Edinburgh, with cities tending to have higher rates of households in the private rented sector.
Percentages of households that are social renting range from 11% in East Renfrewshire to 34% in Glasgow and 36% in West Dunbartonshire.
Further detailed figures are available in the Stock by Tenure Excel webtables.
Separate Scottish Household Survey estimates of the proportions of households by tenure up to the year 2019 are published in the SHS Data Explorer. In addition, Scottish Household Survey results for the year 2020 have recently been published, although these results can't be directly compared to previous years due to the impacts of the change to a telephone survey approach due to the pandemic. There are also no local authority level results available for the year 2020, due to the much smaller sample sizes achieved in this survey year.