Family Nurse Partnership: 10 year analysis
To mark the first ten years of the Family Nurse Partnership in Scotland, we have undertaken a review of data from the programme over this time.
Section 4: Child Outcomes
This section uses data about clients who completed the programme (graduates) only. Data for those that left prior to completion is excluded as the data is incomplete. Data is collected at various points in the FNP journey and is collated across all graduates from the programme inception to the 31st March 2021. This analysis does not include the data from the pilot of FNP.
Summary
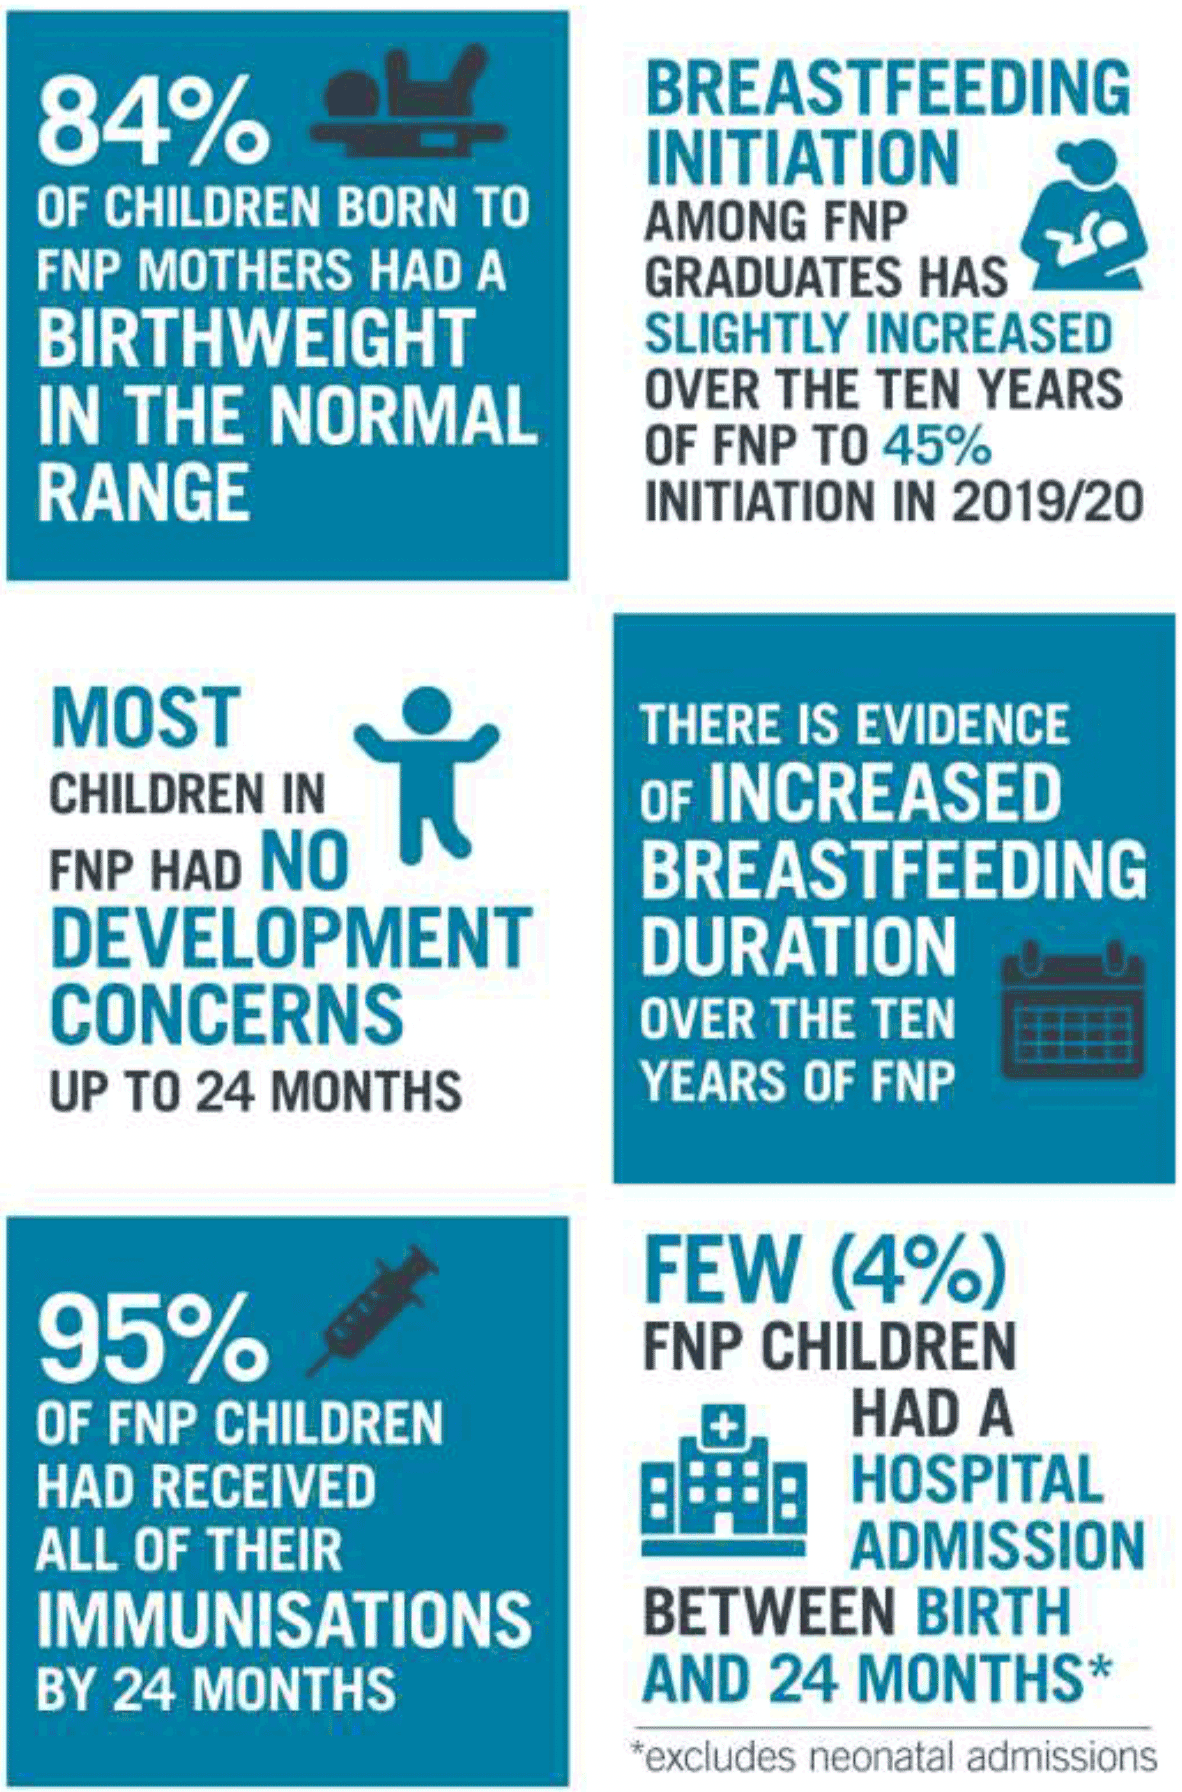
- Overall, 84% of babies born to FNP mothers had a birth weight in the normal range, while 8% had a low birthweight and 8% had a high birthweight.
- Almost half (44%) of all FNP graduates had initiated breastfeeding. Clients graduating between 2019-21 were slightly more likely to have initiated breastfeeding (45%) than those graduating in earlier cohorts - 43% prior to March 2017. Breastfeeding initiation rates were higher amongst clients who had received at least the benchmark number of FNP visits during pregnancy.
- FNP clients that had themselves been breastfed were three times more likely to intend to breastfeed their child (59%) than those that were not (19%). They were also more likely to initiate breastfeeding.
- Within FNP there has been an increase in breastfeeding rates at different time-points measured (6 weeks post-birth, 6, 12, 18, 24 months) and this increase has generally been seen across each client age group, deprivation quintile and region of Scotland. This suggests that as well as the overall increase in breastfeeding initiation in FNP clients over time, there has been an increase in maintenance of breastfeeding.
- The majority of FNP children did not have a child development concern noted at any point where the ages and stages questionnaire (ASQ:3) was used.
- Just over one in twenty (5.4%) FNP children had at least one developmental concern noted at 4 months and a similar proportion at 14 months (5.5%). Just over one in ten (11.5%) FNP children had a developmental concern at 20 months.
- Overall 95% of FNP children had received all of their immunisations by 24 months, in line with the national average for all children.
- Overall, 192 children (4%) had a hospital admission recorded between birth and 24 months.
The early years, from pregnancy to age three, are the most critical period of human development[82]. Parent and child interactions in the early years are the cornerstone for future child development. In a range of research using Growing Up In Scotland data, maternal age has rarely emerged as a factor independently associated with child outcomes. Those findings suggest, instead, that child outcomes are influenced more by the behaviours, experiences and circumstances of parents than by their age. As such, younger mothers who exhibit protective behaviours – such as frequent reading to their child and a healthy lifestyle, and who provide a secure and stable environment, have similar chances of raising children with positive outcomes as older mothers who do the same. The key difference is that their more challenging starting point – a pregnancy which is often unplanned, an unstable relationship, lack of educational qualifications, and a peer group who largely do not have children – makes it considerably more difficult for mothers under 20 to achieve the security and stability necessary to develop and support positive child outcomes[83].
In the five RCTs conducted to date the following child outcomes have been show to be affected by FNP in two or more trials[84]:
- Reduced child behavioural problems (Elmira Trial, Memphis Trial)
- Reduced Internalising Behaviour problems (Memphis Trial and Dutch Trial)
- Improved child receptive language (Memphis Trial and English Trials)
- Reduced child abuse and neglect (Elmira Trial, Dutch Trial)
- Reduced arrests in adolescence (Elmira Trial, Memphis Trial)
Birth Weight
Babies weighing between 2500g and 3999g at birth are generally considered to have a 'normal' birthweight. A birthweight of less than 2500g is considered low, and a birthweight of 4000g, or sometimes 4500g, or more is considered high. A baby's weight at birth reflects both their gestation and how well they have grown whilst in the womb.
Babies who are both preterm and small for their gestational age are at particular risk of short and long term health problems[85]. Many factors that increase the risk of preterm birth also increase the risk of poor growth in the womb and low birthweight.
The age of the mother is a factor in birth weight. The incidence of low birthweight is higher among mothers under the age of 18 or over the age of 35. Early childbearing can increase risks for newborns as well as young mothers. Babies born to mothers under 20 years of age face higher risks of low birth weight, preterm delivery and severe neonatal conditions.[86]
An adequate supply of nutrients is essential for the normal progression of healthy fetal growth and development. Several factors that can help identify nutritional risk in a pregnancy include: adolescence, anemia, abnormal pre-pregnancy weight, multiple gestation, medical illness or medication that interferes with absorption of vitamins and minerals, cigarette smoking, alcohol abuse, and low socioeconomic status[87].
Variations in infant birth weight, even within normal range of weight, have a significant effect on child health and social outcomes[88]. Social conditions during pregnancy have a strong influence on birth outcomes, including birth weight[89].
Despite a decrease in smoking rates and a decrease in births to mothers under 20 years, the proportion of babies with low birthweight in Scotland overall has shown little change since records began in the mid-1970s. In 2020/21, overall 5.2% of all singleton babies had low birthweight; this was higher in mothers under 20 years at 7.8%[90]. However, the proportion of singleton babies that are born preterm has also increased over time. Underlying reasons are likely to include more women having babies at older ages and increasing use of assisted reproduction techniques such as in vitro fertilisation (IVF) bringing associated increases in multiple births. In addition, developments in maternity and neonatal care have led to increases in non-spontaneous preterm deliveries. There is a relationship between low birthweight and deprivation, with higher proportions of low birthweight babies born to mothers living in the most deprived areas. This has not changed markedly over time in Scotland[91].
While FNP trials have looked at birthweight as an outcome for FNP there has been no findings that indicate FNP influences birthweight.
Overall, 8% of babies in FNP had a low birthweight, 8% had a high birth weight, and 84% had a normal birthweight. These findings are comparable to the Building Blocks Trial[92] where 84% of babies in both the intervention group and control group had a normal birth weight (while 6.5% has a high birthweigh overall and 9% a low birthweight).
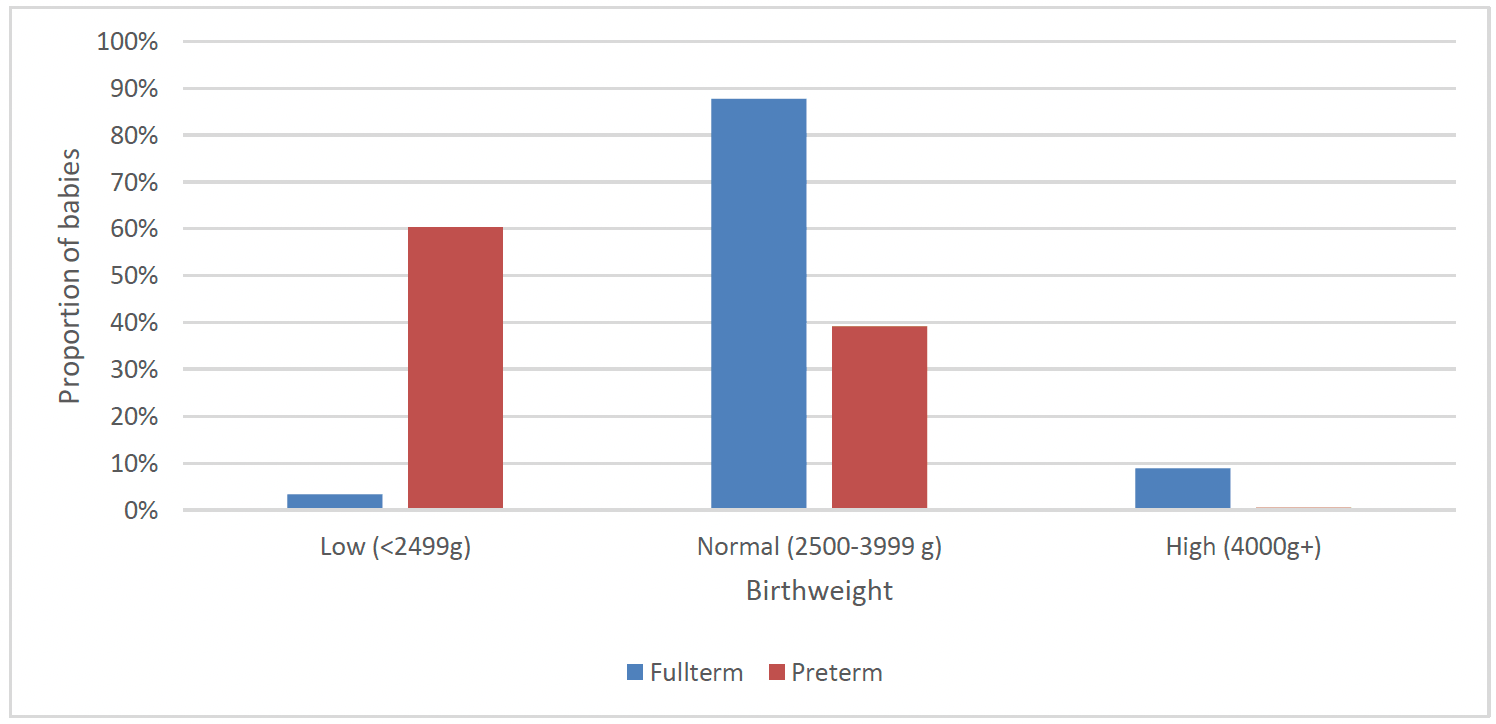
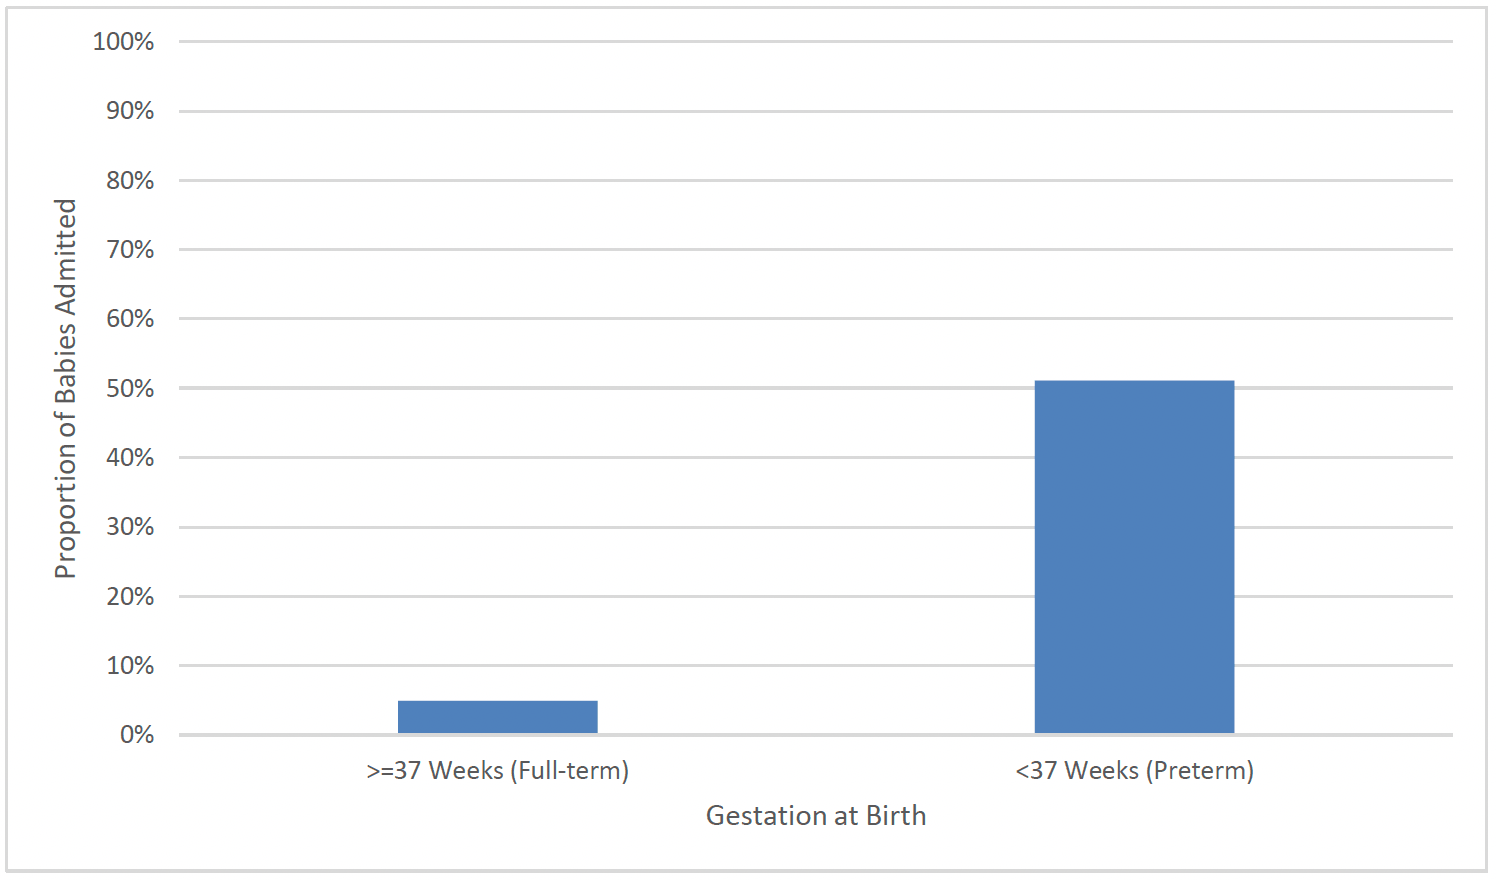
Three in five babies born preterm had a low birthweight[xix] (60%) compared to a very small proportion of full-term births (3%). Almost one in ten babies born full-term had a high birthweight (9%) (Chart 28).
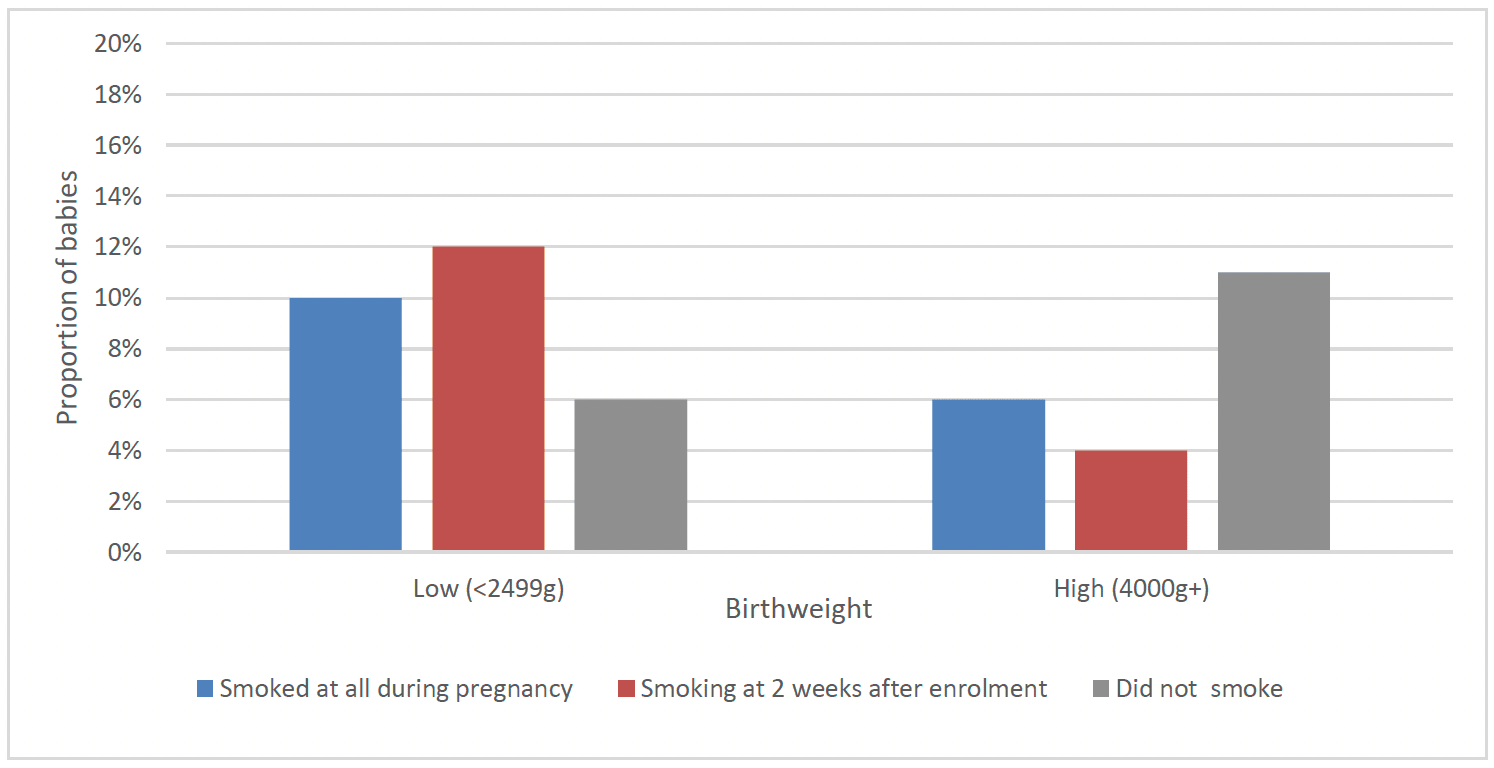
A higher proportion of babies of clients who had smoked at all during pregnancy (10%) and those who were smoking two weeks after enrolment (12%) had a low birthweight, compared to 6% of those who had not smoked. A lower proportion of babies of clients who had smoked at all during pregnancy (6%) and those who were smoking at two weeks after enrolment (4%) had a high birthweight, compared to those who had not smoked (11%) (Chart 29).
A lower proportion of children of clients who did not speak English as their primary language at enrolment (4%) had a high birthweight compared to clients who spoke English as their primary language (8%), although there was a similar proportion with a low birthweight in the two groups (7% and 8% respectively). A lower proportion of children in the most deprived (SIMD 1) areas had a high birthweight (6%) than those in the least deprived (SIMD 5) areas (11%), though these groups had a similar proportion with a low birthweight (9% and 7% respectively).
Infant Feeding
Infant Feeding In Scotland
Breastfeeding provides the best nutrition for babies and supports children's health in the short and longer term. Current guidance recommends that babies should receive just breast milk for the first 6 months of life, then, after introduction of solid foods, breastmilk should continue to be provided up to their second birthday or for as long as the mother and baby wish[93]. The benefits of breastfeeding for both baby and mother are seen across the world, and are advocated by the World Health Organisation (WHO).
Rates of infant feeding for all children in Scotland are captured routinely at national level in child health reviews as part of the Child Health Survellience Programme (CHSP). Data on the proportion of children ever breastfed (breastfeeding initiation) as well as the overall breastfeeding rates (exclusive and mixed feeding) and exclusive breastfeeding rates at First Visit (10 to 14 days after birth), 6 to 8 weeks after birth, and 13 to 15 months after birth is reported on annually in the Public Health Scotland Infant Feeding Statistics Publication[94].
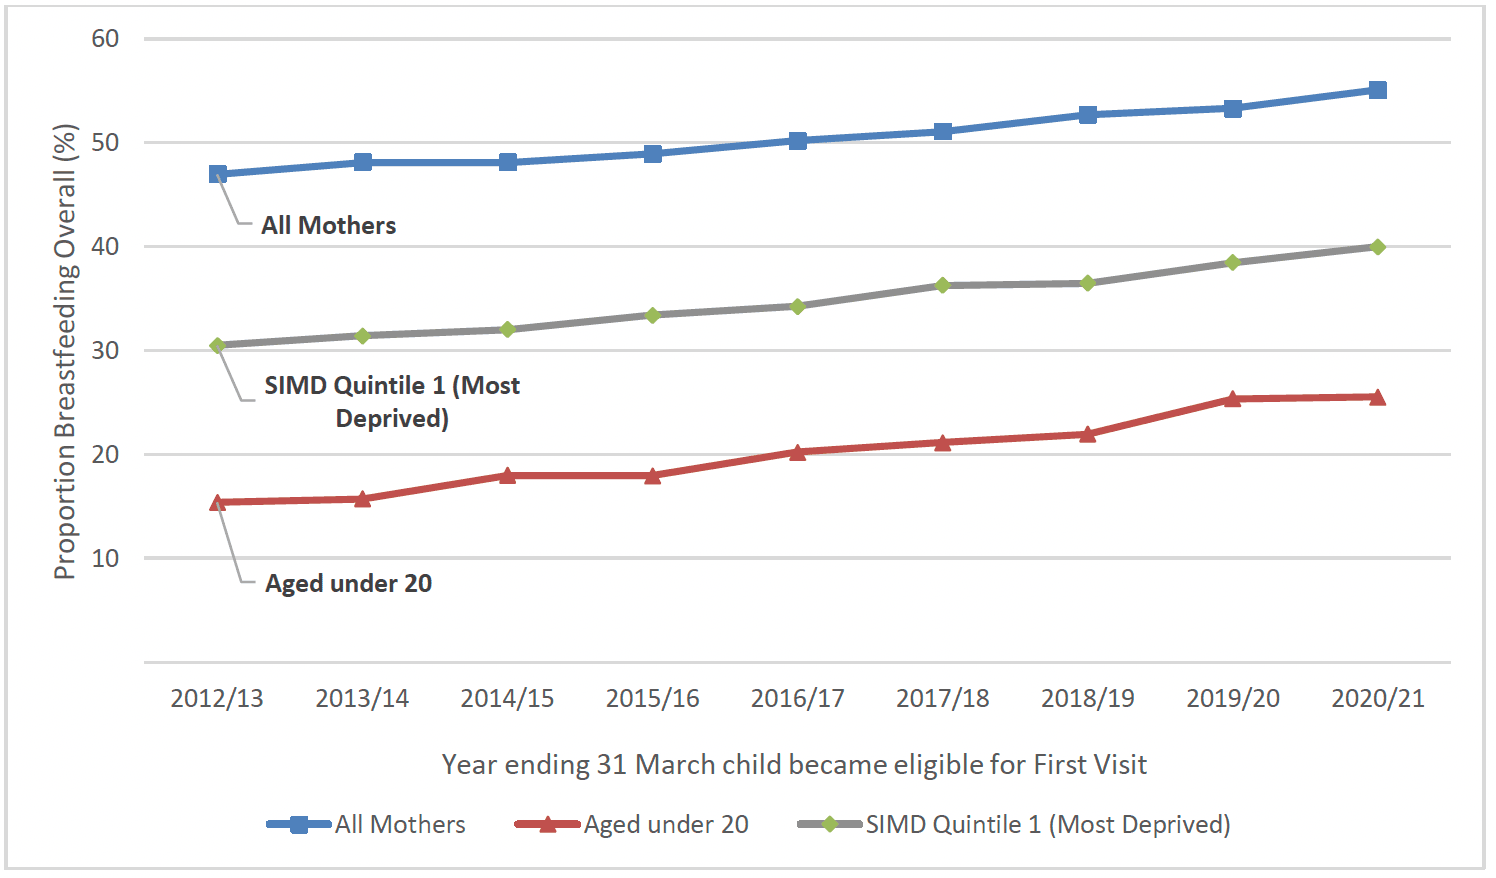
Breastfeeding rates have been consistently lowest for younger mothers and those living in the most deprived areas over many years and at each of the time-points where this is measured nationally, exacerbating health inequalities. However, this gap has narrowed in recent years and breastfeeding rates have increased nationally between 2012/13 and 2020/21. The largest proportional increases in breastfeeding rates have been seen for mothers aged under 20 (+10%) and those living in SIMD 1 areas (+9%), particularly at the First Visit time-point (Chart 30).
Data on infant feeding behavior is captured throughout a client's time on FNP. Clients are initially asked at enrolment whether they intend to breastfeed their child and are subsequently asked about actual feeding at birth, when the child is 6 weeks, 6 months, 12 months, 18 months and 24 months old.
Infant Feeding Intention
Women's intention to breastfeed is influenced by cultural norms and context, and is strongly associated with both initiation[95] and duration[96,97] of breastfeeding. Many studies have shown that positive intentions to breastfeed and the intention to feed for longer are associated with both increased initiation and duration of feeding.
At enrolment onto FNP, clients are asked to indicate whether they intend to breastfeed their child. Of clients who went on to graduate from FNP, 31% stated that they definitely intended to breastfeed, 38% stated that they would possibly breastfeed and 31% stated that they definitely would not. Breastfeeding intention varied largely between demographic and socioeconomic groups - intention to breastfeed was lower amongst clients living in the West of Scotland (25%), clients living in the most deprived areas (SIMD 1) (28%), and clients aged 17 and under (26%). Clients from minority ethnic backgrounds and those who did not speak English at enrolment were much more likely to state that they intended to breastfeed (80%).
Clients are also asked at enrolment whether they themselves were breastfed as a child, those that had been breastfed were three times more likely to intend to breastfeed their child (59%) than those that were not themselves breastfed as a child (19%).
Ever Breastfed
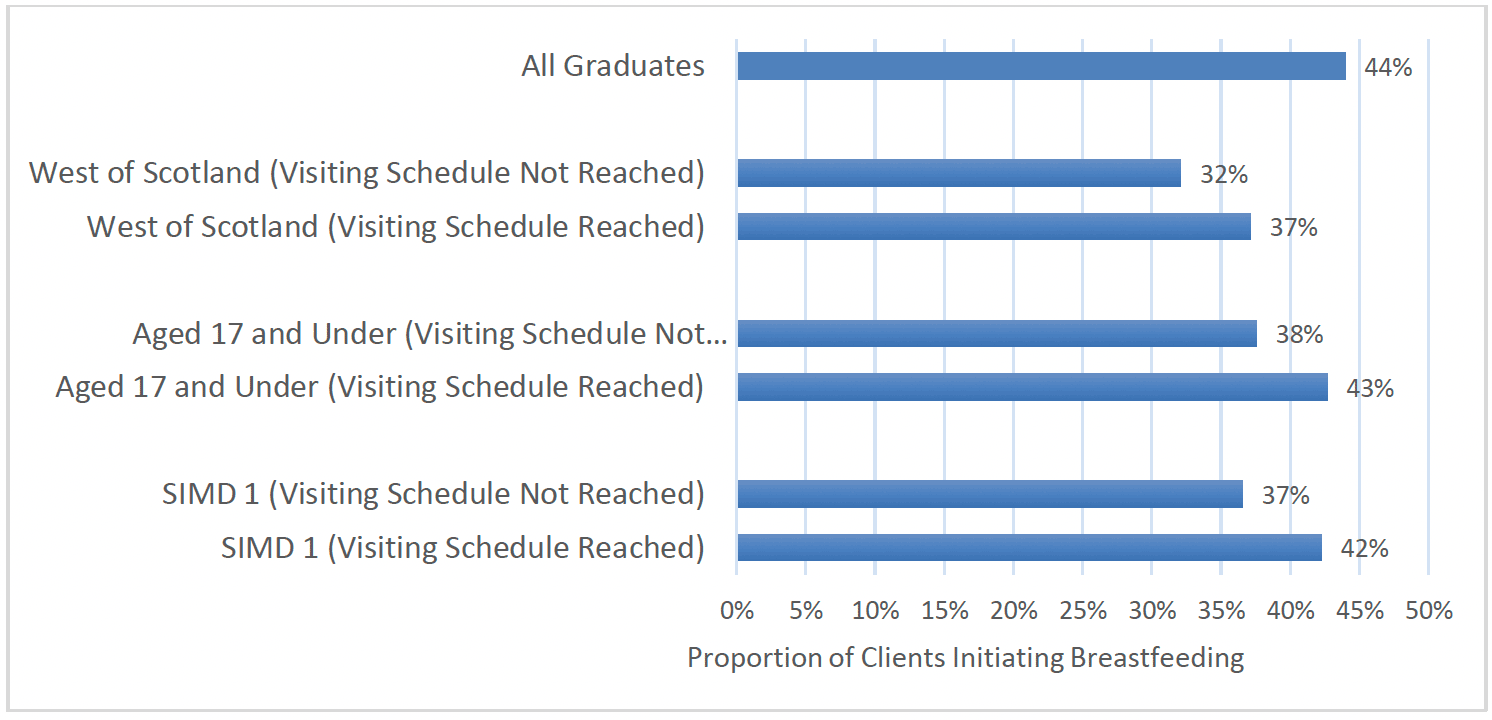
When their baby is born, clients are asked whether their child has ever received breastmilk (breastfeeding initiation). Almost half (44%) of all clients who went on to graduate had initiated breastfeeding. Again, this varied amongst client groups, with clients from the West of Scotland (34%) and those living in the most deprived areas (SIMD 1)(39%), as well as clients aged 17 and under (40%) less likely to have initiated breastfeeding. This aligns with national data on breastfeeding rates more generally.[98] Again, clients from minority ethnic backgrounds (78%) and those who did not speak English as their primary language at intake (80%) were two groups who were more likely to have initiated breastfeeding.
There was an increase over time in the proportion of clients initiating breastfeeding. Clients graduating from FNP between 2019-21 were slightly more likely to have initiated breastfeeding (45%) than those graduating between 2017-19 (44%) and those graduating up to 2017 (43%).
Breastfeeding initiation rates were also higher amongst clients who had received the benchmark number of FNP visits during pregnancy, as per the standard visiting schedule. Almost half (49%) of clients in this group reported initiating breastfeeding compared to 40% of those who had not received the benchmark number of visits. This was found even for client groups who had lower overall breastfeeding initiation rates: clients from the most deprived areas were more likely to initiate breastfeeding if they had received the benchmark number of visits in pregnancy, as were clients aged 17 and under, and clients living in the West of Scotland (Chart 31).
As with breastfeeding intention, there was a noticeably higher rate of breastfeeding initiation amongst clients who were themselves breastfed as a child (71%) when compared to those who were not (32%).
Continuation of Breastfeeding
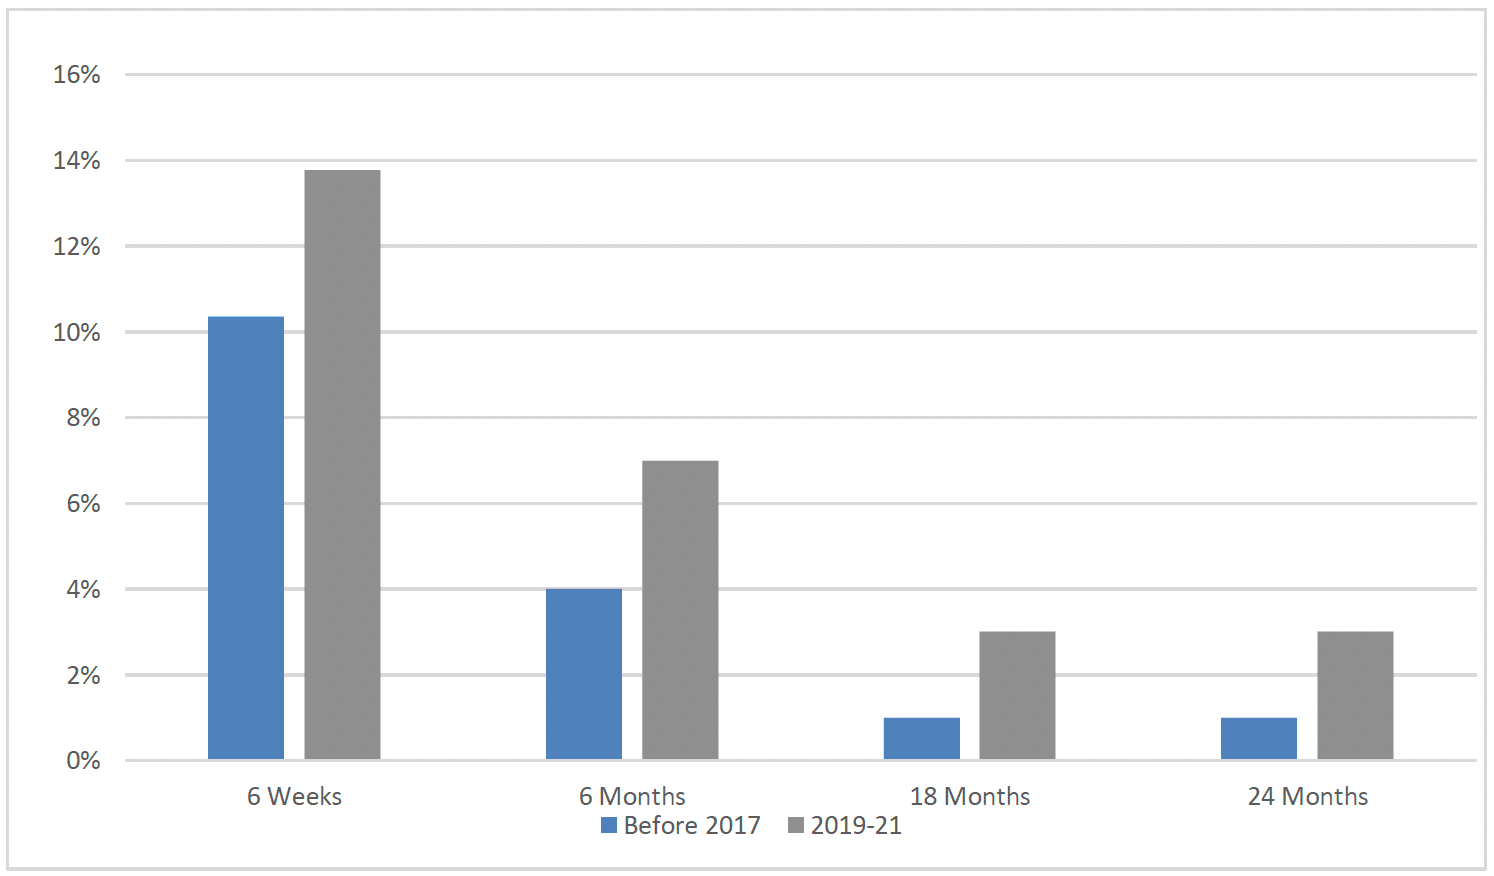
Since the commencement of FNP in Scotland, breastfeeding rates in clients that graduate from FNP have increased over time. As outlined earlier, low breastfeeding rates are influenced by a range of factors, so this shift is significant in terms of the overall effect, although it is acknowledged that rates generally remain low within this population group when compared to more affluent groups or older mothers (Chart 32).
Breastfeeding for longer than six months has been shown to protect babies against certain childhood diseases.[99] In Scotland as a whole, duration of breastfeeding has slightly increased in recent years. Furthmore, breastfeeding duration, which is viewed as having positive implications for longer term health of children, has also slightly increased overall in Scotland.
It is clear from the child health review data that the most rapid drop off in breastfeeding occurs over the first 2 weeks after birth, with a more gradual decline seen thereafter[100].
Within FNP there has been an increase in breastfeeding rates at each time-point measured and this increase has been seen across each client age group, deprivation quintile and region of Scotland. This suggests that as well as the overall increase in breastfeeding initiation in FNP clients over time, there has been an increase in maintenance of breastfeeding.
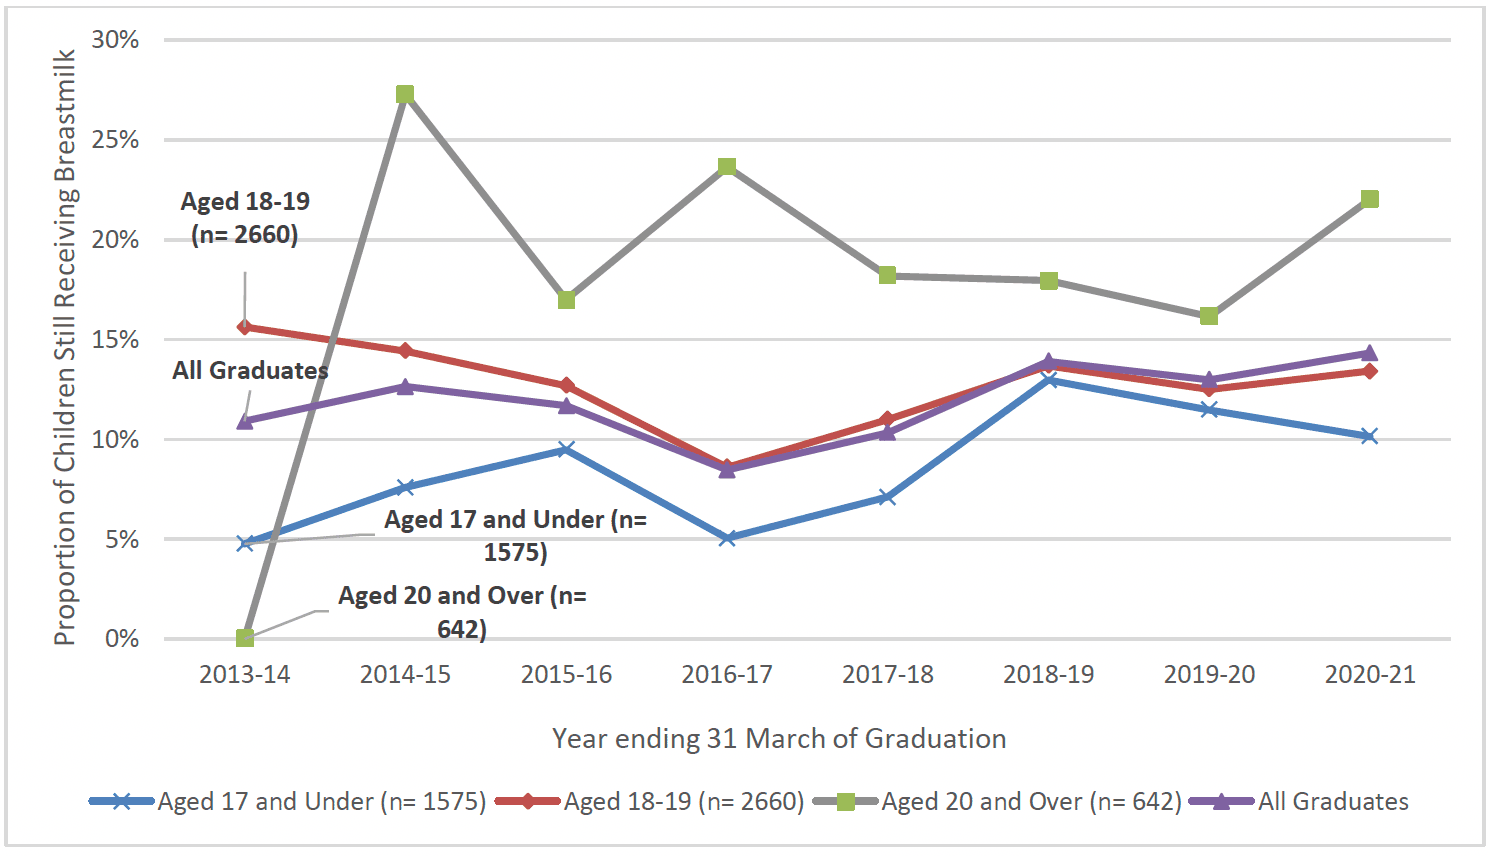
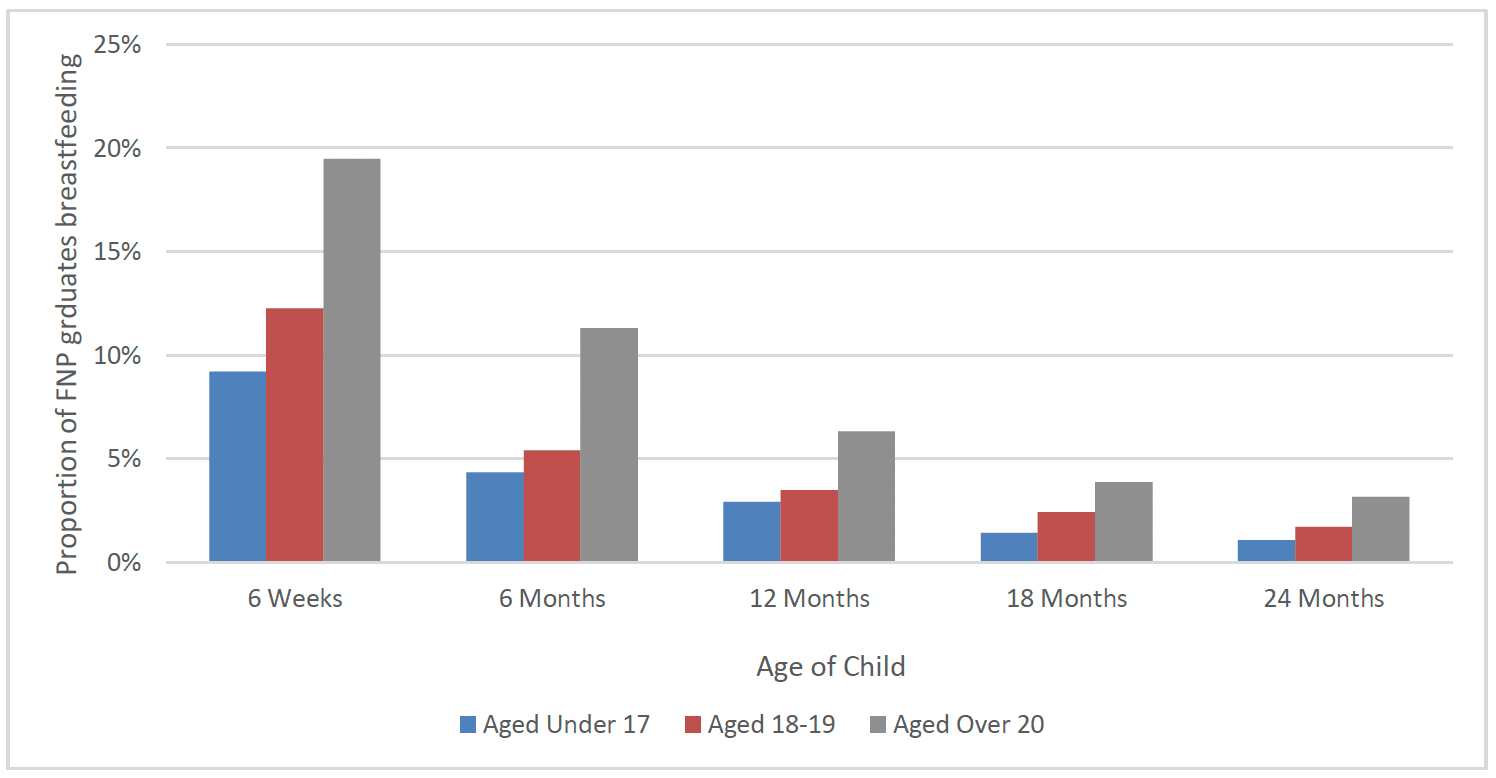
When viewing the FNP data in conjunction with the National Infant Feeding Statistics[101], the improvements in breastfeeding rates for the youngest age groups (under 20 years) is apparent and is in line with the overall rising rates of breastfeeding in Scotland nationally (Charts 34 to 36).
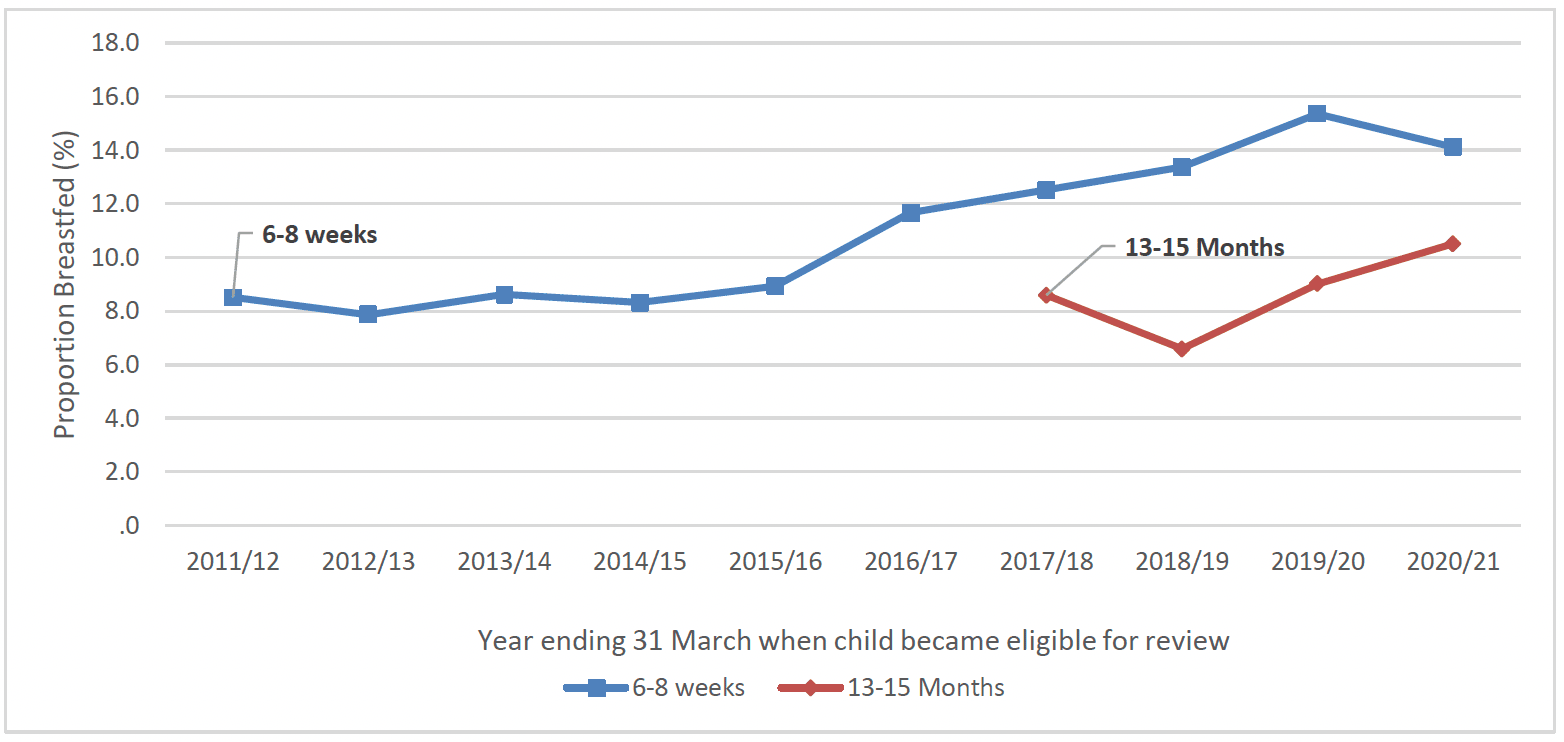
* Data for the 13-15 month review only available from 2017/18 due to lower coverage rates in earlier years
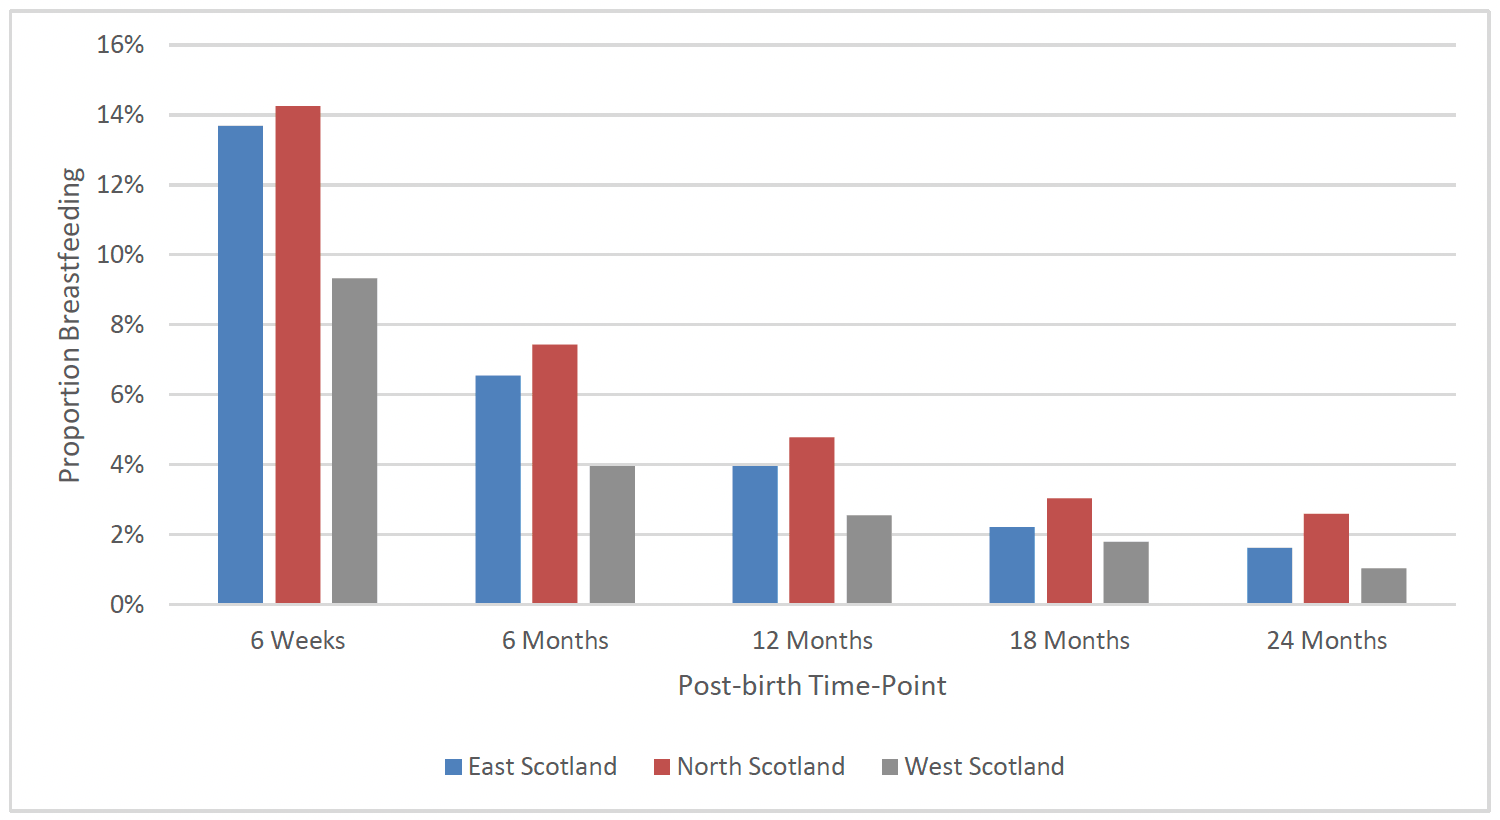
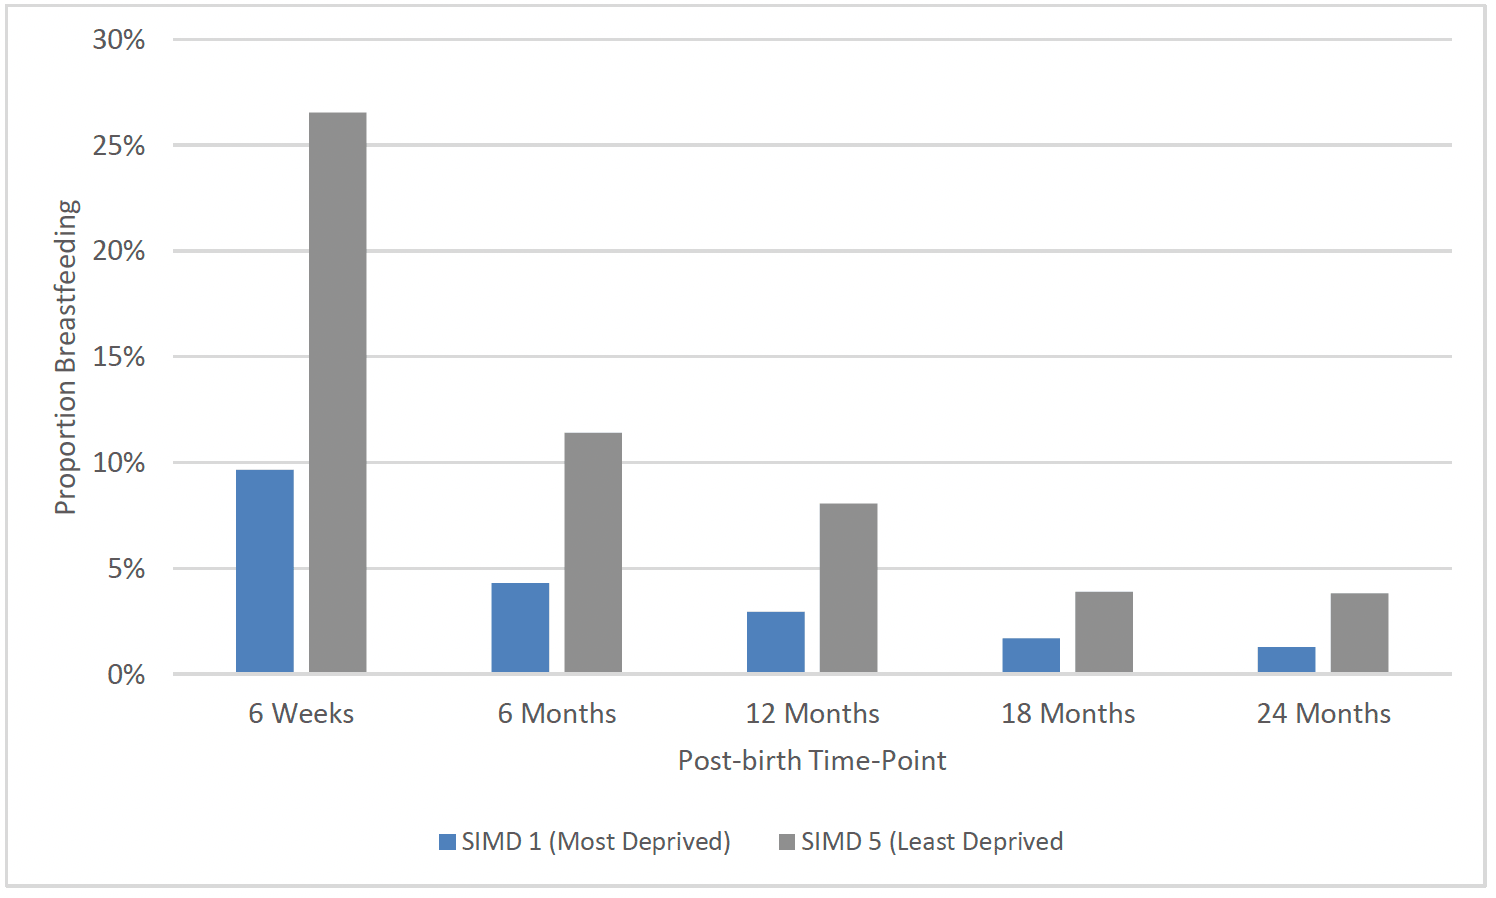
Despite improvement across the regions and deprivation quintiles there remains a clear difference between rates in the West region, among the youngest clients and across deprivation quintiles (Charts 35 to 37).
* Breastfeeding includes exclusive breastfeeding and mixed feeding (formula and breastmilk)
After the birth, around the time when the child is 6 weeks old, clients are asked whether their child had ever been exclusively breastfed, as opposed to mixed breastfed and formula-fed. Overall, 16% of all clients who went on to graduate stated they had breastfed exclusively. Again, clients from the West of Scotland (12%) were less likely to have exclusively breastfed as were those from the most deprived areas (SIMD 1)(15%). However, despite younger clients being less likely to breastfeed overall, exclusive breastfeeding rates were similar amongst all client age groups. As with overall breastfeeding initiation rates, exclusive breastfeeding was higher amongst those that were breastfed as a baby (27%), when compared to those that were not (12%).
Clients graduating from FNP in more recent years (2019-21) were slightly more likely to have ever exclusively breastfed (17%), when compared to those graduating prior to 2019 (16%).
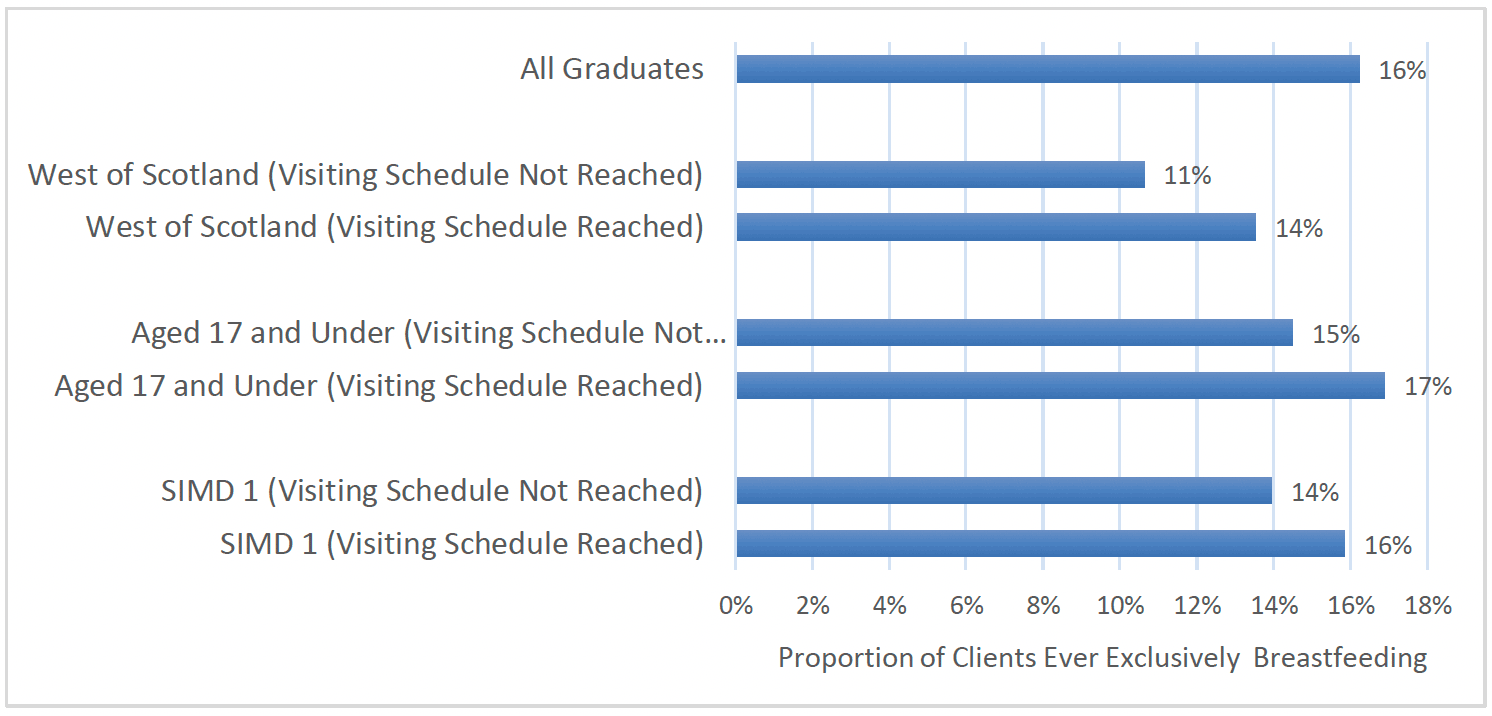
As with overall breastfeeding initiation, exclusive breastfeeding was higher amongst clients who had received the benchmark number of visits during pregnancy, as per the standard visiting schedule. Almost one in five (19%) clients who had received the benchmark number of visits reported having ever exclusively breastfed, as compared to 14% of those who had not received the benchmark number of visits (Chart 38).
Evidence from other studies within FNP has been mixed in terms of findings on breastfeeding rates. An early pilot study in England found breastfeeding initiation was higher in FNP than the national rate for same age group (FNP = 63%, UK under 20s=53%)[102]. However in the later RCT in England, while more pregnant participants in FNP expressed an intention to breast feed, there was no difference in the proportion of participants in the FNP arm that initiated breastfeeding compared to those that did not receive FNP, nor in the duration of breast feeding reported at six months by participants.
However, in the Dutch trial findings indicated that significantly more women in the FNP group were still breastfeeding their baby at six months post–birth compared to those that did not receive FNP.[103]
Child Development
Early child development is influenced by both biological factors (such as being born premature) and environmental factors (such as the parenting babies and children receive and the opportunities for play and exploration). Identification and prevention of early child development concerns are important as there is a strong association with long-term health, educational, and wider social difficulties, although this is not pre-determined.
Detecting developmental problems early provides the best opportunity to support babies, children and families to improve outcomes. There is good evidence that parenting support and enriched early learning opportunities can improve outcomes for children with, or at risk of, developmental delay.[104]
All children in Scotland are offered a series of reviews as part of the CHSP which includes an assessment of children's development at 13-15 months, 27-30 months and 4-5 years[105]. The Ages and Stages Questionnaire (ASQ:3)[106] is the developmental screening tool used in Scotland to assess child health. It is the single validated tool within the Universal Health Visiting Pathway[107] and is also used in FNP. In addition to the local clinical patient record, the child's development is captured on local and national CHSP data reporting system across Scotland.
Family Nurses use a combination of supporting parents to complete ASQ:3, clinical assesment and professional judgement to determine whether an area of a child's development is of concern or not, and this is measured across five domains – communication/speech and languagexx, fine motor, gross motor, problem solving and personal/social development. For each domain, there is a cut-off score, and a child scoring below this indicates a possible developmental concern. The ages at which ASQ:3 has typically been measured in FNP are 4 months, 8 months[xxi], 14 months, and 20 months, however the coverage of data captured in the FNP data system varies widely between these age groups.
Child Development at 4 months
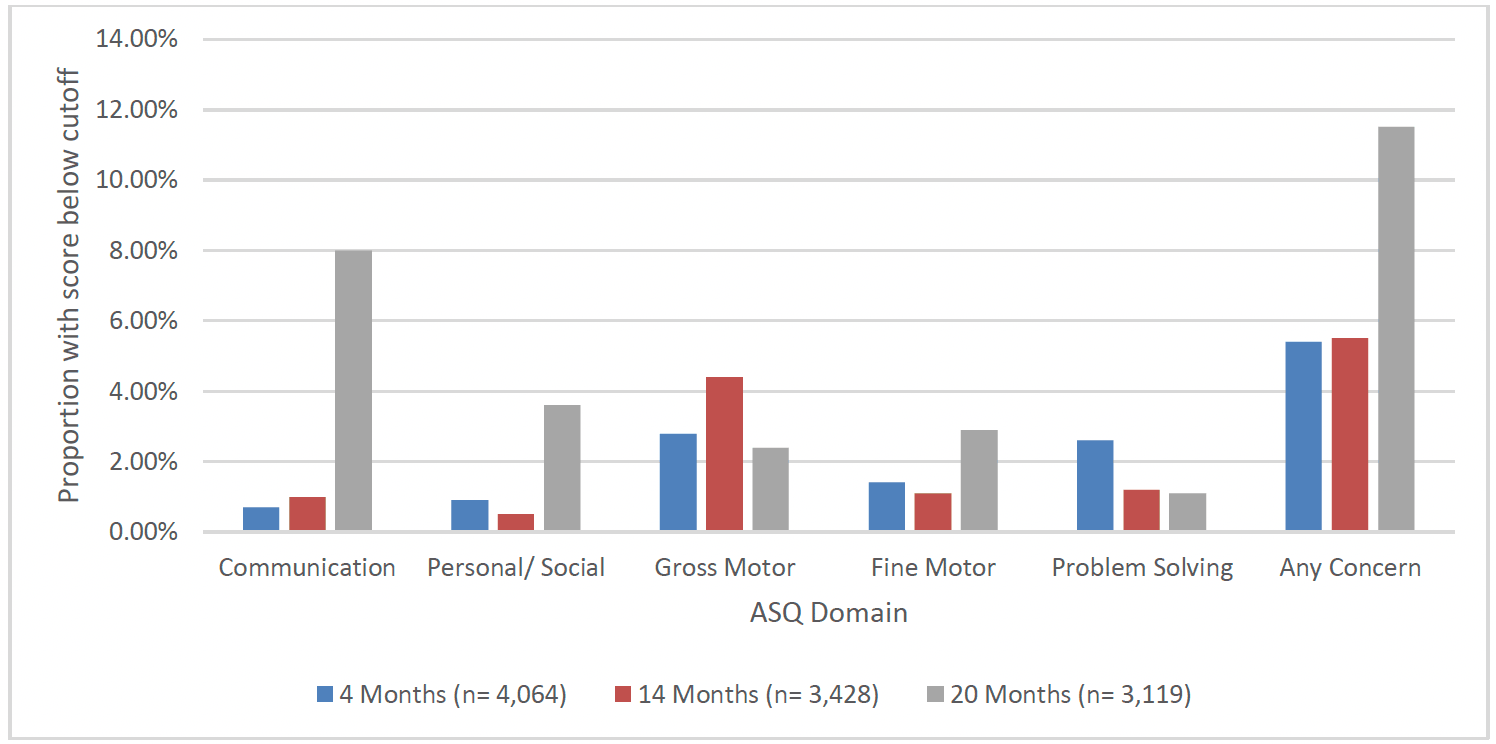
Overall, the majority of children (80%) of clients who went on to graduate from FNP had ASQ:3 data recorded for the 4 month time-point (4,064 children). Of the children assessed, the majority (94.6%) did not have a score indicating a developmental concern[xxii]. Just over 1 in 20 (5.4%) children had a score indicating a developmental concern for at least one of the five ASQ:3 domains at 4 months. The domains for which children most frequently had a concern recorded at 4 months were gross motor (2.8%) and problem solving (2.6%), followed by fine motor (1.4%), personal/social (0.9%) and communication (0.7%) (Chart 43).
The proportion of children with at least one concern noted at 4 months was consistent geographically, across time and across deprivation quintiles. There was a slightly higher proportion of children with at least one concern at 4 months for children of clients aged 20 and older (7.7%), compared to clients aged under 20 (5.1%).
Child Development at 8 months
Within FNP, ASQ:3 is now measured at 8 months (to better align with the Health Visiting Pathway Child Health Reviews), however in some cases this data was previously captured at 10 months rather than 8 months. As such, the migration of data to the Turas FNP system has been problematic due to the differing time points.
Overall, just under one in four children (23%) of clients who went on to graduate from FNP have ASQ:3 data recorded at 8 months (1163 children). Of the children assessed at 8 months, the majority (90.2%) did not have a developmental concern. However, (9.8%) had a concern noted for at least one of the five ASQ:3 domains.
Child Development at 14 months
At 14 months, two thirds (67%) of children of clients who went on to graduate from FNP had ASQ:3 data recorded (3,428 children). Of the children assessed the majority did not have a developmental concern recorded (94.5%). One in twenty (5.5%) had a developmental concern noted for at least one of the five ASQ:3 domains. At 14 months gross motor skills was the domain with the most children having a concern recorded (4.4%), while fine motor skills (1.1%), problem solving (1.2%), personal/social (0.5%) and communication (1.0%) domains each had a relatively low proportion with a concern.
When observing the CHSP data captured nationally for all children at the 13-15 month child health reviews between 2017/18 and 2019/20, overall coverage was 70%, with an increase in uptake over time. The most common domain in which developmental concerns were recorded was gross motor (5.8%), followed by speech, language and communication (4.2%), problem solving (2.9%), fine motor (2.8%), and personal/ social (2.2%). This is similar to the FNP ASQ:3 data in respect to gross motor concerns being the most common at this time-point, however there is a notably higher prevalence of speech, language and communication concerns noted in the nationally captured CHSP data than was observed in the FNP ASQ:3 data.
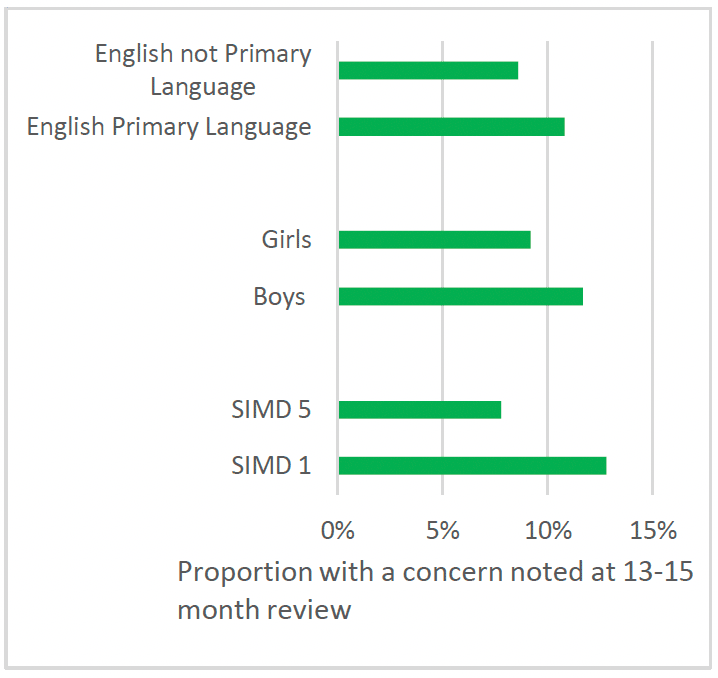
In the CHSP data captured nationally at 13-15 month child health reviews between 2017/18 to 2019/20, there was a higher proportion of children with a concern recorded across any domain in SIMD 1 (12.8%), than SIMD 5 (7.8%), and a higher proportion of boys (11.7%) with a concern than girls (9.2%) (Chart 39).
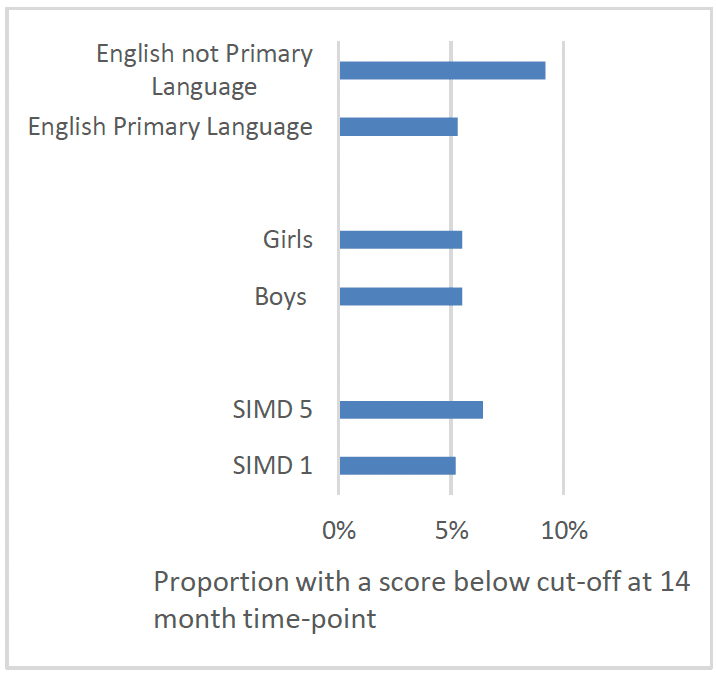
Contrary to data captured in 13-15 month reviews, in the FNP ASQ:3 data, there was a similar rate of concerns recorded for children in SIMD 1 (5.2%) and SIMD 5 (6.4%) and amongst boys (5.5%) and girls (5.5%) (Chart 40). There was also a higher proportion of concerns amongst the children of clients who spoke a language other than English at intake (9.2%) in the FNP data, but this difference was not observed in 13-15 month reviews captured in the CHSP for children who lived in households where English was not the main language spoken.
Child Development at 20 months
At 20 months almost two thirds (63%) of children of clients who went on to graduate from FNP had ASQ:3 data recorded (3,119 children). Of the children assessed, the majority did not have a developmental concern noted (88.5%). However, of the 11.5% that did have a developmental concern, this was most likely to be for communication than any other domain (8.0%). This was followed by personal social (3.6%), fine motor skills (2.9%), gross motor skills (2.4%), and problem solving (1.1%)
The proportion of children with at least one developmental concern at 20 months was consistent geographically, across deprivation quintiles and between boys and girls.
Again, the proportion with at least one concern was also higher amongst children of mothers who did not speak English as their primary language (13.6%). Children of mothers aged 20 and over at enrolment were also slightly more likely to have a concern noted (13.7%) than those whose mothers were aged 18-19 (11.1%) or 17 and under (11.4%) at enrolment.
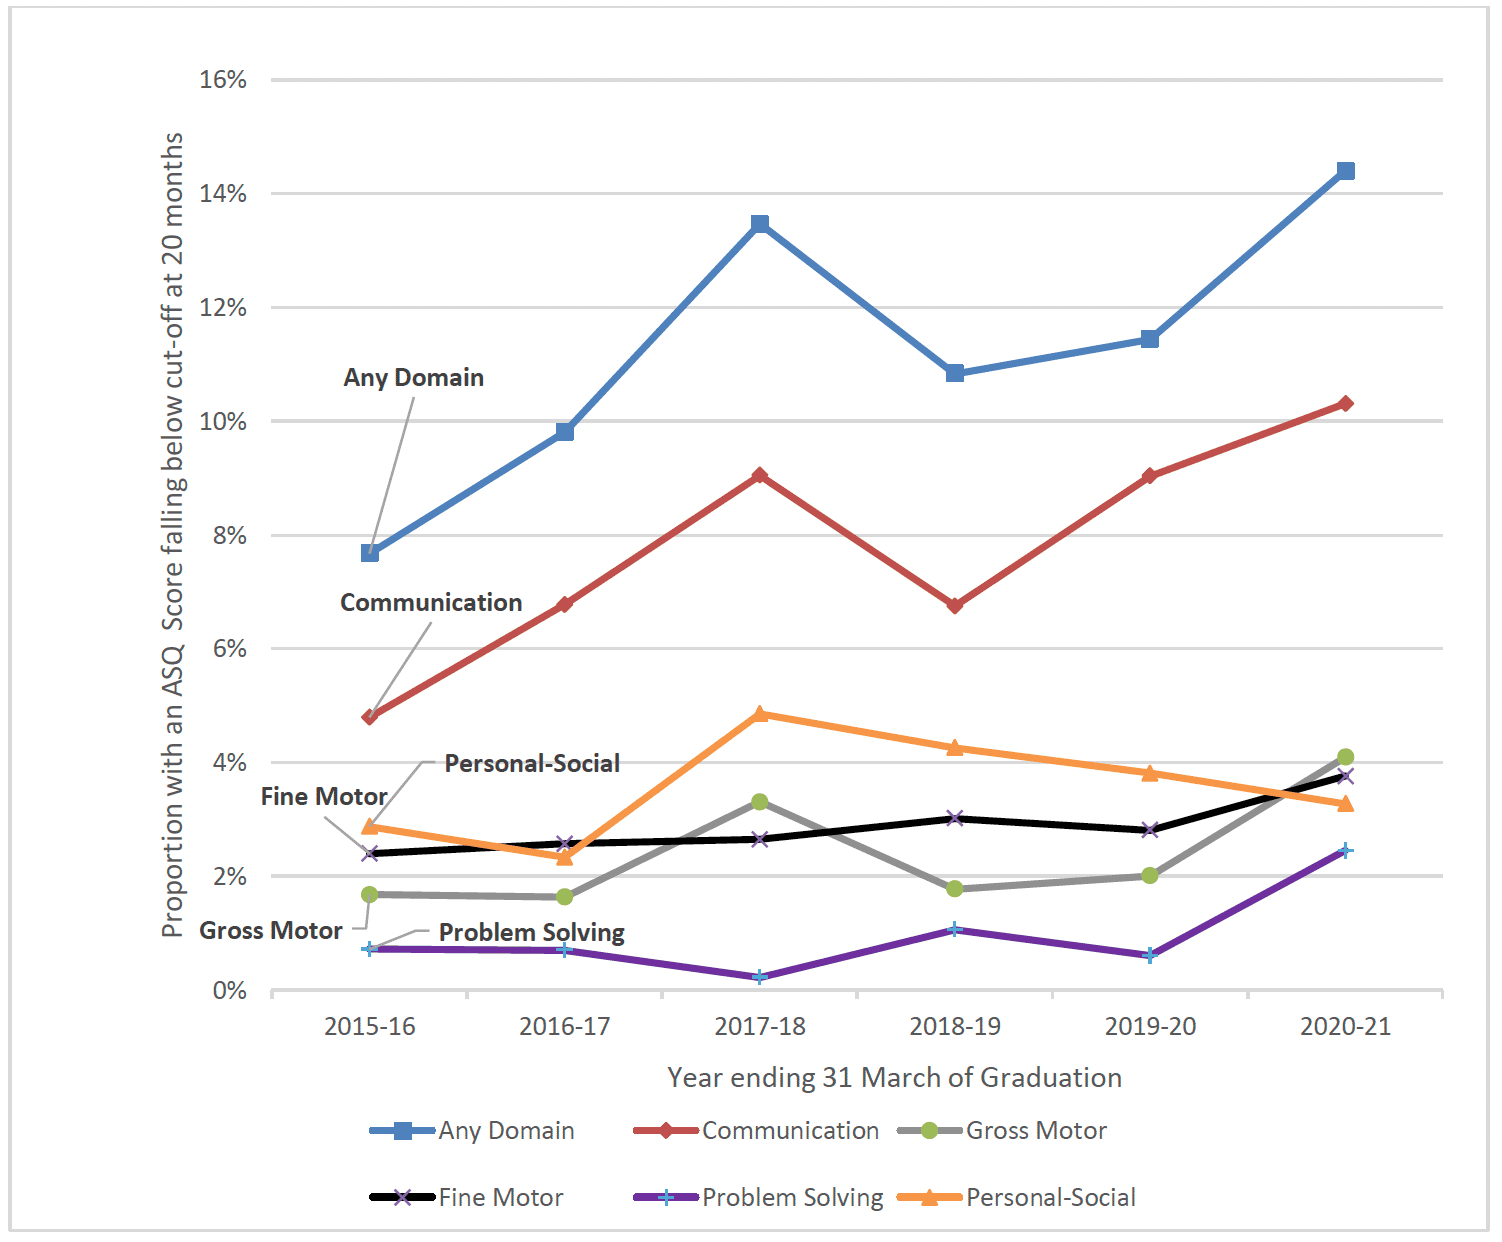
At the 20 month review a slightly higher proportion of children of clients graduating between 2019-21 (13.1%) had a developmental conccern noted, compared with those graduating prior to 2017 (9.3%). This was particularly the case for children of clients who graduated in the most recent year (2020-21), for whom 14.4% had a concern at this time-point. There was also an increase in the proportion of children with a concern at 20 months in each individual domain, apart from personal-social, with a particular increase in the communication domain (Chart 41).
COVID-19 pandemic and Child Development
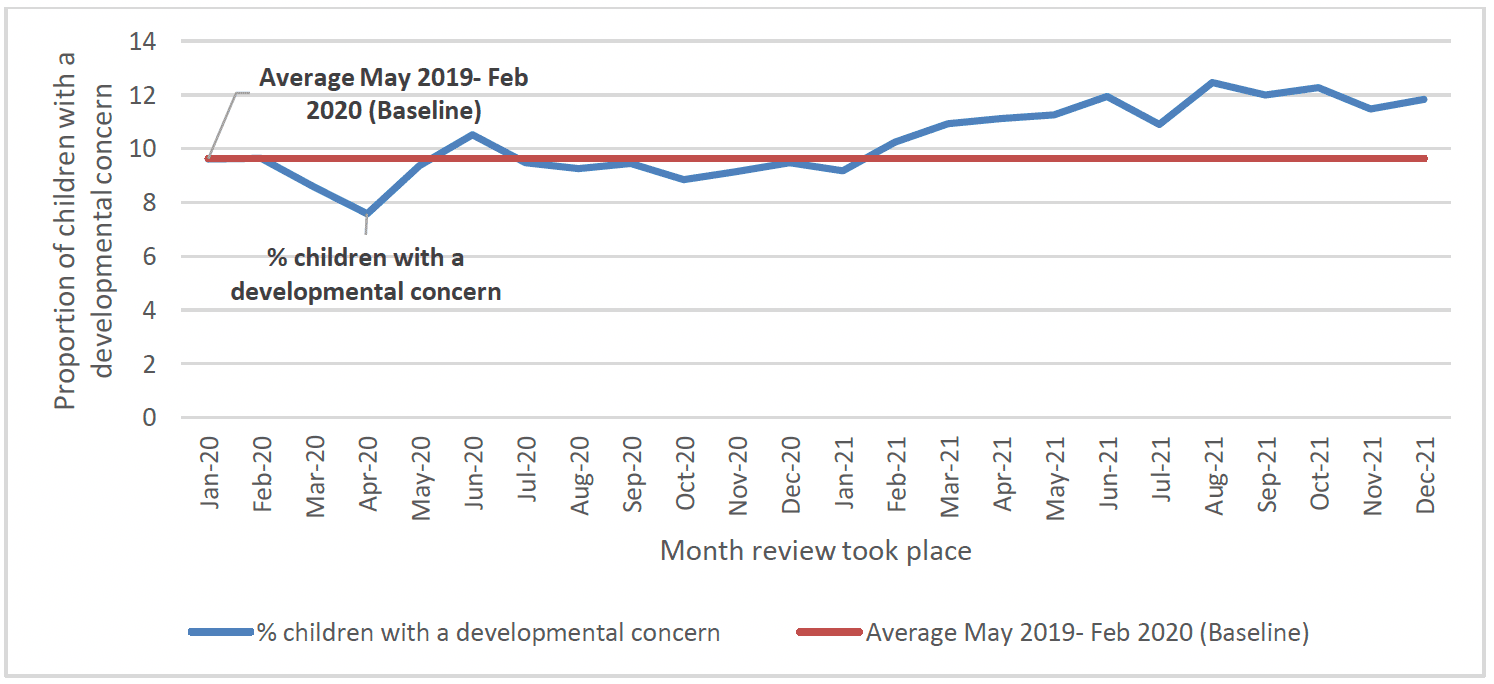
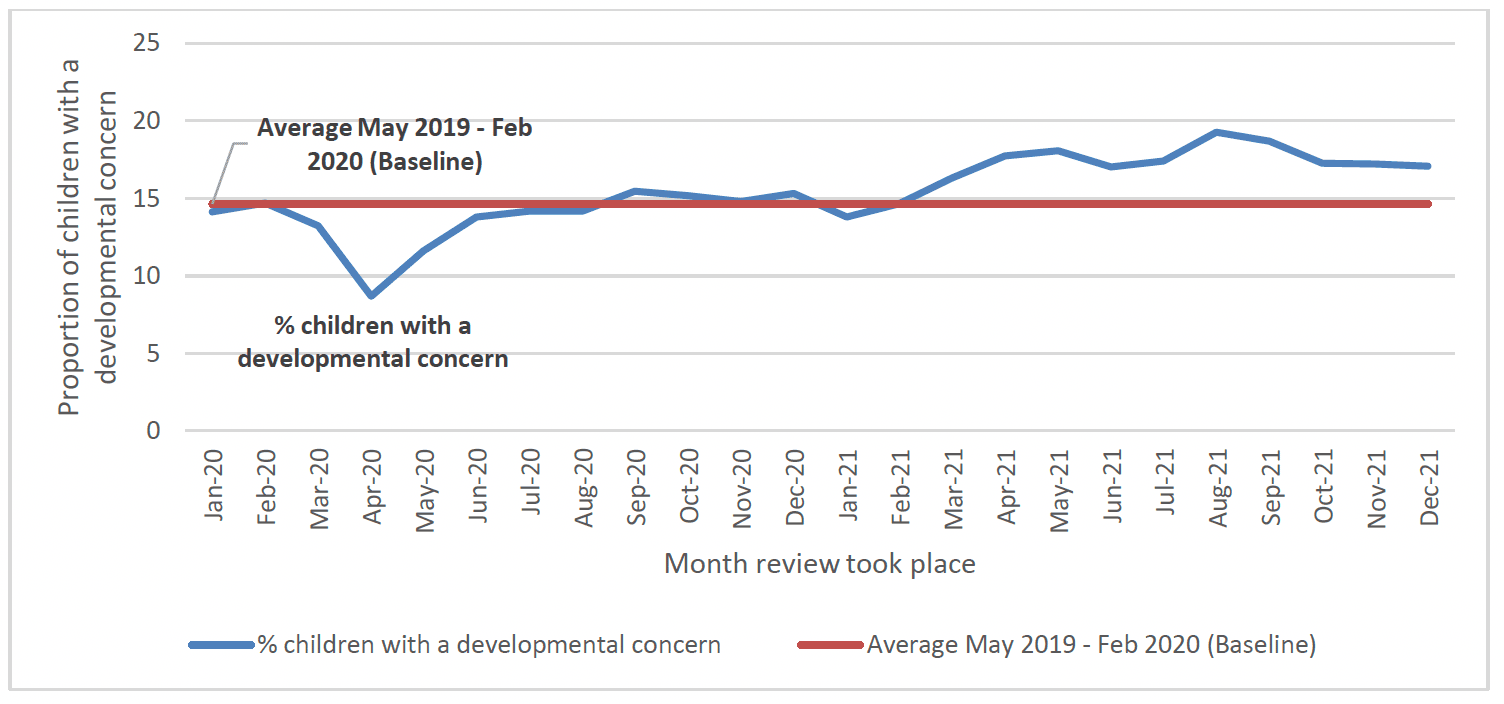
The findings above noting an increase in the proportion of children with a developmental concern at 20 months in 2020/21 are consistent with other findings more broadly in terms of developmental concerns recorded during the COVID-19 pandmic. For example, in Scotland overall there has been evidence of an increase in developmental concerns at the 13-15 month and 27-30 months review point during the pandemic. The proportion of children with a developmental concern recorded during 2021 increased to 11.3% at the 13-15 month review (up from a pre-pandemic baseline of 9.6%) (Chart 43) and to 17.0% at the 27-30 month review (up from a prepandemic baseline of 14.6%) (Chart 44)[108].
Child Development Social and Emotional Measures
The Ages and Stages Questionnaire: Social-Emotional (ASQ:SE) is another tool used in FNP which specifically measures 7 areas of social-emotional development of the child: self-regulation, compliance, social-communication, adaptive functioning, autonomy, affect, and interaction with people. This includes how well the child can regulate their emotions, understand the emotions of others and their general level of empathy. This tool can be used to help parents to identify their child's strengths and areas of problem behaviours, which can help support decisions regarding referrals for additional support.
In FNP, ASQ:SE is completed at 6 months, 12 months, 18 months and 24 months. While this tool can be used in health visiting it is not routinely completed at certain time points like it is in FNP, which means there is no national data to compare to. Of the children of clients who went on to graduate from FNP, there was a higher and more consistent proportion of valid data recorded for ASQ:SE assessments than for ASQ:3 assessments, with 85-89% having valid ASQ:SE data recorded on the FNP data system.
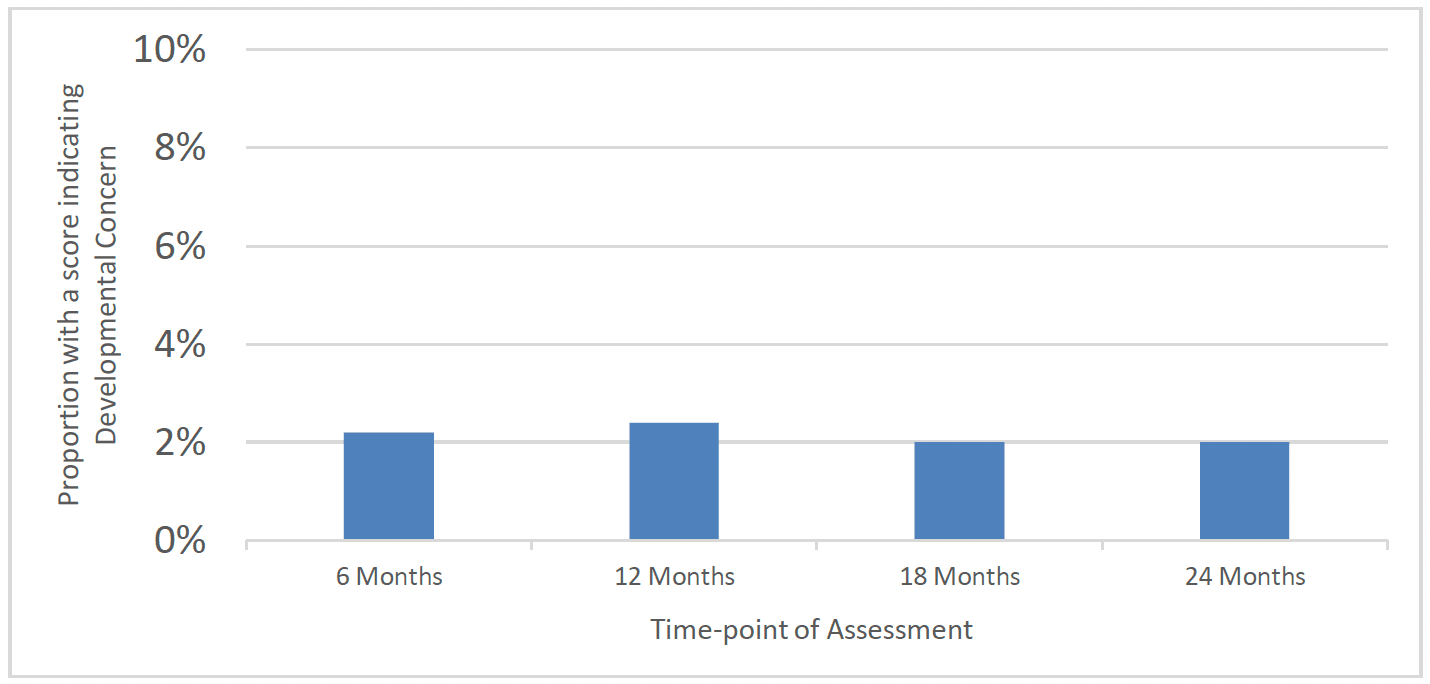
There was also a relatively low proportion of children with a score indicating a developmental concern indicated for each time-point of ASQ:SE assessment. 2.2% of children had a score indicating a concern in social-emotional development at 6 months, 2.4% at 12 months, 2.0% at 18 months and 2.0% at 24 months (Chart 45). This was also largely consistent across demographic groups, geographical areas and over time
Immunisations, Hospital Attendances and Admissions
Immunisations
The routine immunisation programme for children and young people in Scotland includes a series of vaccinations at 8 weeks, 12 weeks, 16 weeks, 12 to 13 months and two years old. Annex 3 provides a summary of the vaccines offered at each time point up to two years old and the diseases they protect children against.
Public Health Scotland's quarterly and annual Childhood Immunisation Statistics publications provide information on the proportion of children receiving scheduled immunisations by 12 months old and 24 months old. The latest publication of these statistics reported that, in the year ending 31 March 2021, immunisations offered between birth and 12 months old had uptake rates of between 94.2% and 97.1%, and that immunisations offered between birth and 24 months old had uptake rates of between 94.5% and 97.3%. At a national level, uptake rates appear to have remained consistently high across the immunisations offered and across the time period within which FNP has been offered in Scotland, with rates typically exceeding 95%[109].
In FNP, data is captured on whether or not a child has received all scheduled vaccinations by 6 months, 12 months, 18 months and 24 months old.
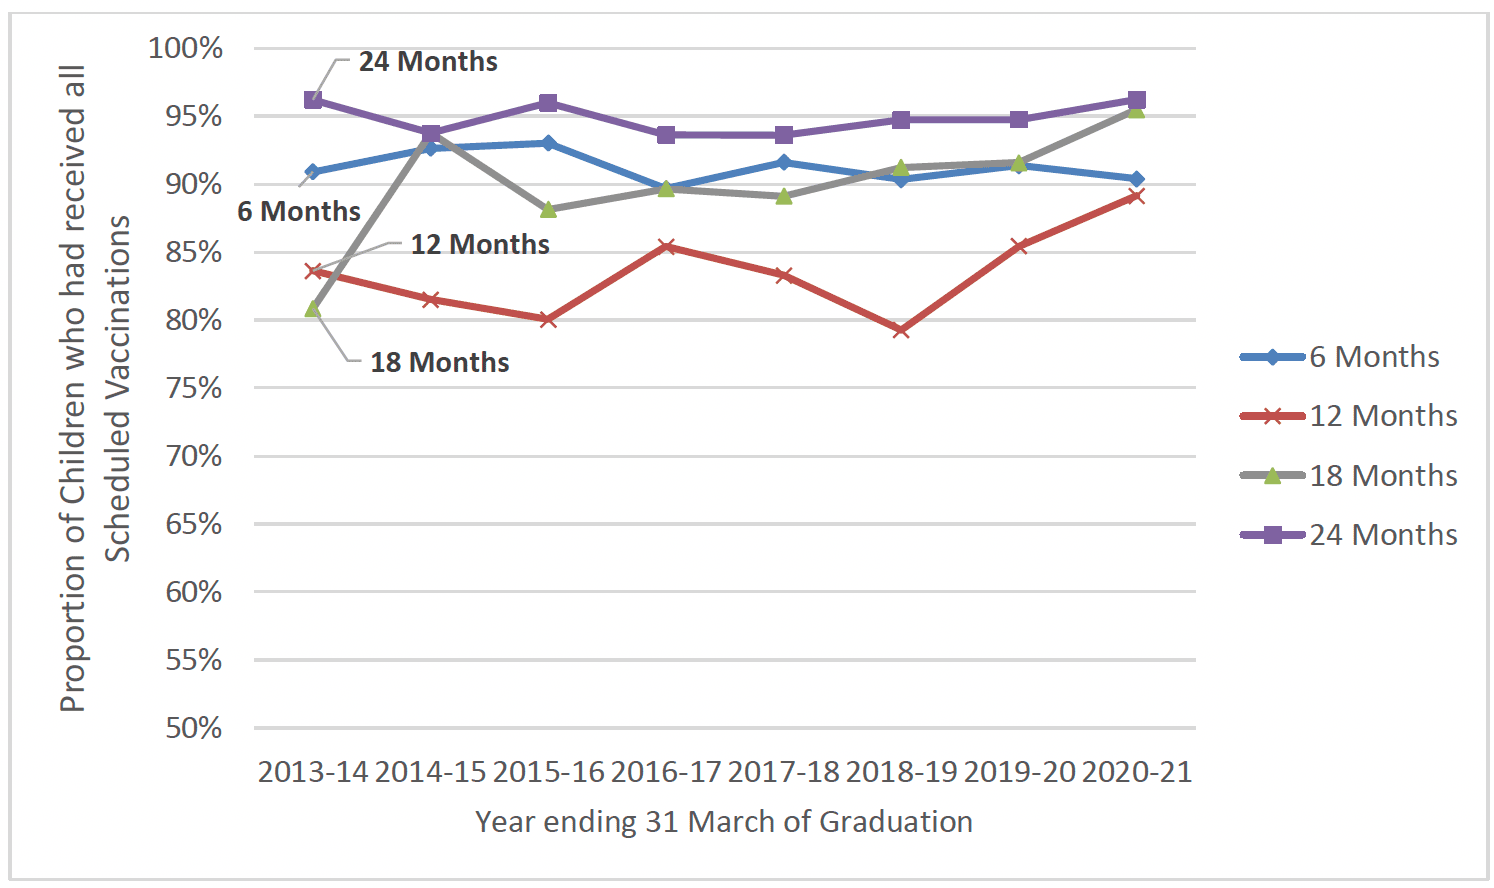
As shown in Chart 14, the proportion of children in FNP who had received all scheduled vaccinations at the 6, 12, 18 and 24 month timepoints varied. Children were least likely to have received all scheduled vaccinations at the 12 month time-point, however there is a known issue with this data in that vaccinations are often completed at 13 months and the data at 12 months can often experience a data lag.
Vaccine uptake by 6 months and 18 months was consistently around or just above 90% across most years of FNP. Children were most likely to have received all scheduled immunisations by 24 months old – with uptake typically exceeding 95%, in line with national uptake rates. This suggests that most of the small group of children who had not received particular immunisations at earlier time-points had caught up with their immunisations by 2 years old (Chart 46).
Although there was no substantial geographical variation between regions of Scotland when comparing the likelihood of children having received all scheduled immunisations by 24 months, there were some differences across demographic groups. At 6 months, 18 months and 24 months, there is a correlation between maternal age and the likelihood of children recieiving all scheduled immunisations. Children of FNP clients who were aged 17 and under at enrolment were less likely to have received all scheduled immunisations than children of mothers aged 18-19, who were in turn less likely than children whose mothers were aged 20 and over.
Children of clients who did not speak English as their primary language were less likely to have received all scheduled immunisations by 6 months and 18 months. Children from more deprived areas were slightly less likely to have received all scheduled immunisations at each time-point, but only notably so at 12 months. (Table 10).
| Time-point | 6 Months | 12 Months | 18 Months | 24 Months |
|---|---|---|---|---|
| All Graduates | 91% | 84% | 91% | 95% |
| English Primary Language | 91% | 84% | 92% | 97% |
| English not Primary Language | 87% | 82% | 83% | 94% |
| Aged Under 17 | 87% | 83% | 90% | 95% |
| Aged 18-19 | 93% | 84% | 91% | 95% |
| Aged 20 and over | 95% | 86% | 94% | 96% |
| SIMD Quintile 1 (Most Deprived) | 90% | 83% | 91% | 94% |
| SIMD Quintile 5 (Least Deprived) | 92% | 90% | 93% | 97% |
Neonatal Unit Admissions
Every year, over 100,000 babies in the UK are cared for in neonatal units because they have either been born prematurely (before 37 weeks of pregnancy), or full term (after 37 weeks) but require additional care. This means that around 1 in 7 (14%) babies born in the UK are admitted to a neonatal unit each year. The majority of babies who receive neonatal care are born full term. In 2016, of the 100,762 babies who received neonatal care in England, Scotland and Wales, only 1.2 per cent were born before 25 weeks[110].
Overall in Scotland around 9-12% of all babies were admitted to neonatal unit or special care baby units (SCBU) between 2008 and 2021. Babies born to mothers living in the most deprived areas were around 3% more likely to be admitted than those in the least deprived areas[111].
In FNP, data about admission to neonatal or SCBU is collected at 6 weeks post-birth. Overall, 430 babies had been admitted to a neonatal unit or SCBU, representing 9% of babies born during FNP programme delivery.
There was a much higher proportion of preterm babies (gestation under 37 weeks) who were admitted to a neonatal unit. Over half of preterm births (51%), compared to just one in twenty full-term births (5%) were admitted. Despite less than one in ten babies being born preterm (9%), they represented almost half of neonatal unit and SCBU admissions (49%) (Chart 47).
The proportion of babies overall who were admitted to a neonatal unit or SCBU was largely consistent across demographic groups, deprivation quintiles geographically and over time, and this was the case for both preterm and full-term births.
Hospital Attendances and Admissions
Overall few children are admitted to hospital in their earliest years, however for those that are studies have shown that the risk of accidents and hospital admissions decreased with increasing maternal age. For instance, analysis of the Millenium Cohort data showed that at nine months, the risk of a child with a 20 year old mother having an accident was 9.5%; this fell to 6.1% for a mother of 40. This decline continued for three and five year olds[112]. Similarly, at nine months, the risk of a child with a 20 year old mother being hospitalised was 16% which fell to 10.7% for a mother of 40. This trend continued to three year olds, but was not statistically significant for five year olds[113].
Accident and Emergency Attendances
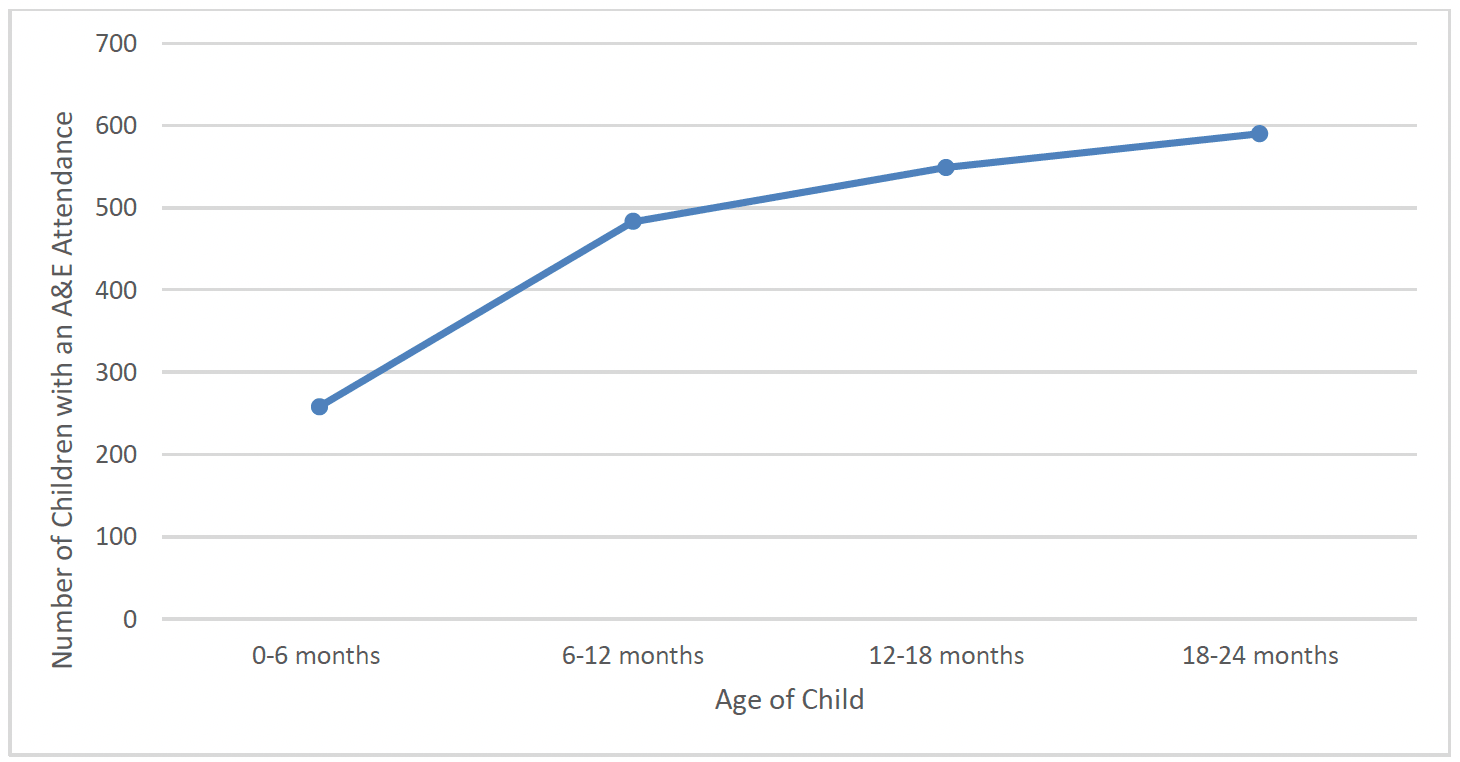
FNP clients were asked at 6 months, 12 months, 18 months and 24 months post-birth whether their child had attended Accident and Emergency (A&E) at any time in the previous 6 months (Chart 48).
In total, 672 children (13%) had attended A&E between birth and 12 months old. There was a higher proportion of children of clients who spoke English as a primary language at intake (14%) who had attended than those who did not (5%). There was a slightly higher proportion of children from the least deprived areas (SIMD 5) (18%) who had attended A&E up to 12 months old than other deprivation quintiles (13%). There was also a slightly higher proportion of children of clients aged 17 and under (15%) who had attended A&E when compared to those aged 18-19 (13%) and 20 and over (12%). The proportion of children attending A&E up to 12 months old was broadly similar across regions of Scotland and over time.
In total, 981 children (20%) had attended A&E between 12 months and 24 months old. There was a higher proportion of children of client's who spoke English as a primary language at intake (20%) who had attended than those who did not (7%). The proportion of children attending A&E between 12 and 24 months old was broadly similar across regions of Scotland, deprivation quintiles, client age groups and over time.
When viewing the total number of children who had attended A&E at any time between birth and 24 months old, 1423 children (28%) had attended. There was a higher proportion of children of clients who spoke English as a primary language at intake (29%) who had attended than those who did not (12%). There was a slightly higher proportion of those from the least deprived areas (32%) who had attended than those from the most deprived areas (28%). Children of clients aged under 20 (29%) were slightly more likely to have had an attendance than those aged 20 and over (25%). The proportion of children attending A&E up to 12 months old was broadly similar across regions of Scotland and over time.
The findings above are similar to those found in the Growing Up in Scotland study, which found that accidents requiring medical attention were relatively uncommon at 10 months, but doubled in the following year (from 10% to 23%)[114].
Hospital Admissions
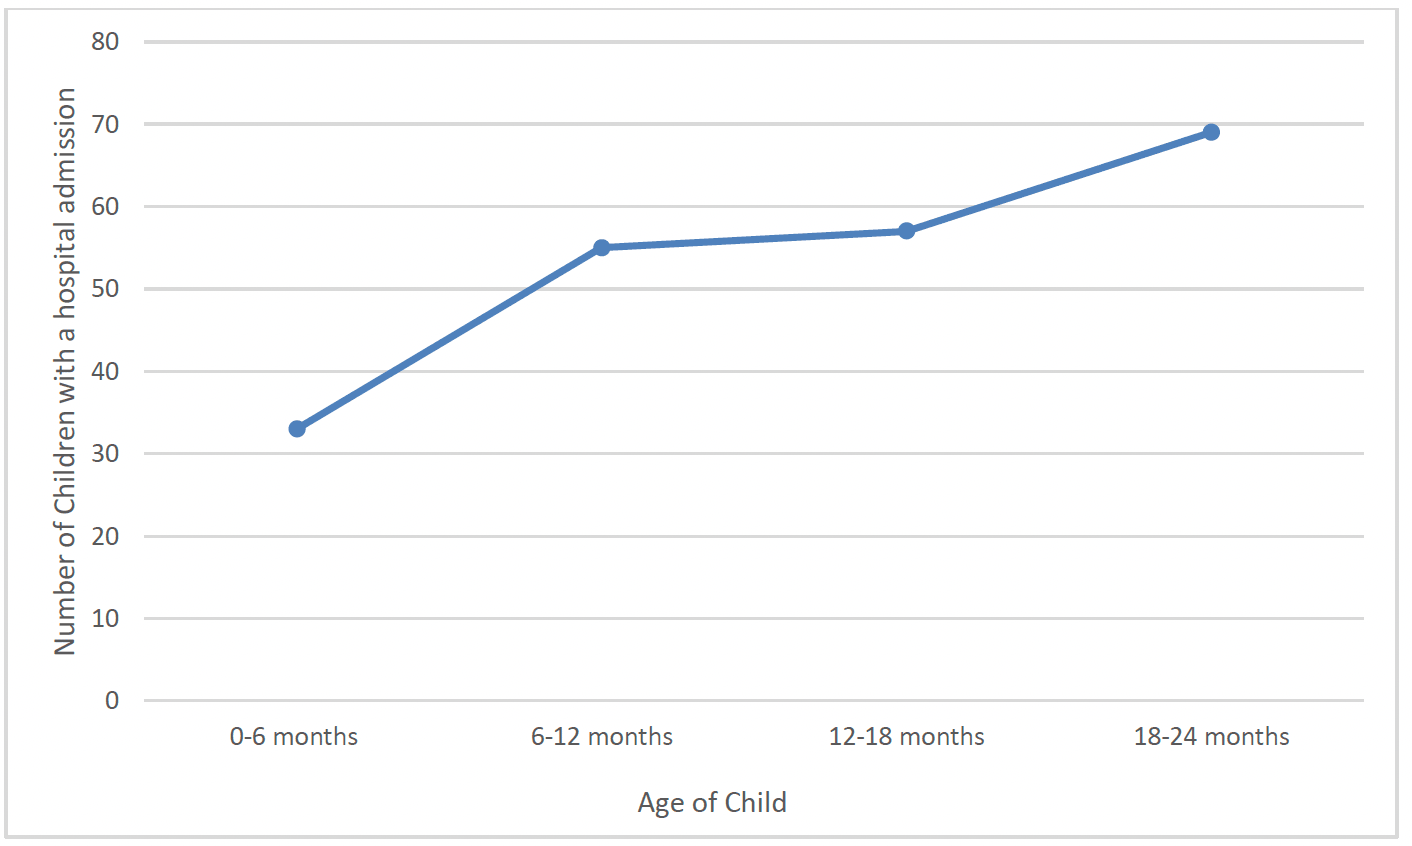
FNP clients were also asked at 6 months, 12 months, 18 months and 24 months post-birth whether their child had been admitted to hospital at any time in the previous 6 months (Chart 49).
Other than Neonatal Unit and SCBU admissions noted above, 33 children had a hospital admission recorded between birth and 6 months old. This increased at subsequent time-points, to 55 children being admitted between 6 and 12 months old, 57 being admitted between 12 and 18 months old, and 69 being admitted between 18 and 24 months old (Chart 49).
Overall, 3.8% (N=192) children had a hospital admission recorded between birth and 24 months. The rate of children with a hospital admission recorded appears to be similar across client age groups, deprivation quintiles, geographically, and over time. However, as with A&E attendances, there appeared to be a lower rate of hospital admission amongst children of mothers who did not speak English as a first language at intake.
Contact
Email: Justine.Menzies@gov.scot