Fair Start Scotland Evaluation Report - Year 6: Phone Survey with Service Participants - March 2026
Research report detailing findings from the fifth Wave of a phone survey undertaken to capture the experiences of Fair Start Scotland (FSS) participants. The report is one element of an evaluation programme of FSS, and focuses on evaluating Year 6 (April 2023-March 2024) of FSS delivery
Chapter Six: Working Status and Quality of Work
Overall summary
This chapter explores the employment status and job quality of Fair Start Scotland (FSS) participants within the 2023-24 cohort[26]. It provides an overview of job quality by looking at participants’ current work situations, including types of contracts worked, working hours, and income levels. The chapter also examines progression indicators such as training opportunities, pay increases, and job satisfaction, providing insights into how FSS support may have influenced participants’ employment journeys and experiences. Comparisons to previous cohorts were not made due to participants in the 2023-24 cohort completing the survey at a later point in their journey (see Technical Appendix).
Key findings:
- almost two-thirds of participants were unemployed and looking for work before receiving support, and a quarter had been out of work for five or more years prior to FSS
- two-fifths of participants were in paid employment at the time of the survey (not including those who were self-employed)
- male participants were more likely than female participants to be unemployed and looking for work
- participants who had achieved a degree or higher were more likely than those with no qualification to be in paid employment
- those who had left FSS early were less likely to be in paid employment than those who had not left early
- over three-fifths of participants who were in work or in education were working or studying 30 or more hours per week
- participants who were actively searching for work before they started receiving support were more likely than those who were economically inactive to be working or studying 30 or more hours per week
- those without a health condition were more likely than those with a health condition that limits their day-to-day activities to report working or studying 30 or more hours per week
- most commonly, participants in work were working in elementary occupations (low-skilled or manual jobs) followed by caring, leisure and other service occupations
- the large majority of working participants reported earnings that suggested they earned at least the National Living Wage, with a substantial proportion (just over two in five of those aged 21 and over) who reported earnings that suggested they earned the Real Living Wage
- among the small number of participants who reported earnings that suggested they earned under the National Living Wage, some were self-employed, in education or training or on temporary or zero hour contracts
- only a small proportion of participants in work reported being under the age of 21. Of these, over nine in ten reported earnings that suggested they earned at least the National Minimum Wage
- most employed participants had permanent contracts, though a small proportion were on temporary or zero-hours contracts, or were self-employed
- minority ethnic participants were more likely than white participants to be employed on a temporary contract
Employment history
The 2023-24 cohort were asked what their main activity was before they started receiving support from FSS. Most participants were unemployed and looking for work (63 per cent). As shown in Figure 20 below, one in ten (10 per cent) reported that they were not in employment because they were in education or training. Eight per cent of participants indicated they were not in employment due to sickness or disability. One in 25 (4 per cent) said that they were caring for an adult relative or friend with a disability or long-term illness, while one in 50 said they were looking after the home or family full-time (2 per cent). The remaining participants were working in a voluntary or unpaid role (2 per cent), retired and/or claiming a pension (less than 1 per cent) or answered other (11 per cent).
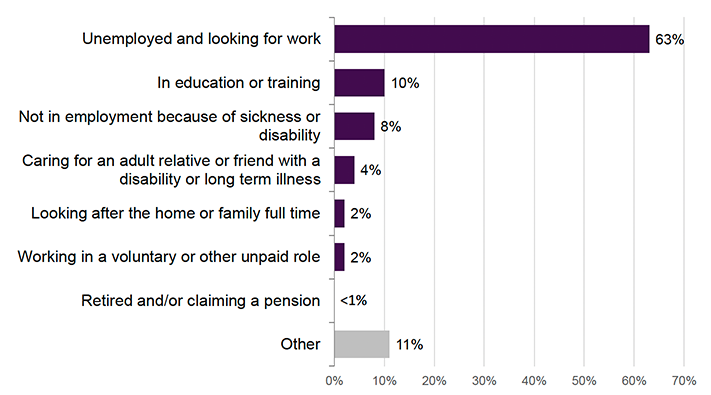
Source: IFF Research telephone survey of FSS customers, B1a: Can you tell me what your main activity was before you began receiving support? Were you [statement]? Base: All (469)
Participants who were not currently employed or self-employed were asked if they had been in employment (either paid or unpaid) at any point in the last five years. Almost two-thirds (64 per cent) indicated they had been in employment at some point during that time. Participants aged between 16 and 24 were more likely to be in employment in the last 5 years than those aged 25 or over (78 per cent compared to 60 per cent).
Participants in the 2023-24 cohort were also asked how long they had spent out of work in the past 5 years, prior to joining Fair Start Scotland. As shown in Figure 21 below, participants had most commonly been out of work for the full five years (26 per cent). A fifth (20 per cent) of participants had been out of work for less than 6 months, and over one in eight (14 per cent) had been out of work for less than a year, but more than 6 months.
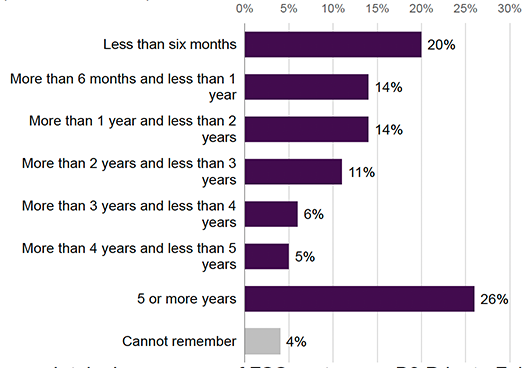
Source: IFF Research telephone survey of FSS customers, B3 Prior to Fair Start Scotland, approximately how long have you spent out of work in the past 5 years? Base: All (469)
There were some differences between groups regarding the length of time participants had been out of work in the last five years, as follows:
- younger participants (aged between 16 and 24) were less likely than participants aged 25 or older to have been out of work for less than 6 months (11 per cent compared to 22 per cent)
- male participants over 50 were less likely than male participants aged 25 to 49 to have been out of work for less than 6 months (9 per cent compared to 26 per cent)
- participants who reported their health limits their day-to-day activities were more likely than participants with a health condition that does not limit them and participants with no health condition, to have spent five or more years out of work (33 per cent, compared to 16 per cent and 20 per cent respectively). They were also less likely than those with health conditions that did not limit their day-to-day activities to have been in work more recently
- female participants without health conditions were more likely than female participants with limiting health conditions to have been out of work for less than 6 months (34 per cent compared to 8 per cent)
- participants with a degree level qualification or higher were more likely to have only been out of work for less than 6 months compared to participants with a National SCQF 1 to 5 qualification or equivalent (28 per cent compared to 15 per cent)
- early leavers of FSS were more likely to have been out of work for five or more years prior to joining FSS than those who did not leave early (34 per cent compared to 23 per cent)
- those in paid employment reported having been out of work for less time prior to joining FSS compared to those who were actively looking for a job or economically inactive (31 per cent said they had been out of work for less than 6 months compared to 13 per cent among those actively looking for a job, and 7 per cent among those who were economically inactive). They were less likely than those actively looking for a job and those economically inactive to have been out of work for 5 or more years (9 per cent compared to 38 per cent and 42 respectively)
- parents were more likely than those who were not parents to have been out of work for less than six months (27 per cent compared to 17 per cent)
- participants from ethnic minorities were more likely than white participants to be out of work for less than 6 months (33 per cent, compared to 15 per cent for white participants)
- participants who were economically inactive prior to joining FSS[27] were more likely to have been out of work for five or more years than participants who were actively searching for work (38 per cent compared to 24 per cent)
- re-joiners were more likely than non-re-joiners to have been out of work for 5 or more years (29 per cent compared to 20 per cent among those who had not re-joined the service)
- those who were part of a priority family were less likely than participants who were not part of a priority family to have been out of work for between 2-3 years (4 per cent compared to 13 per cent)
Finally, participants from the 2023-24 cohort were asked how long ago they stopped working in their most recent role. Twenty-two per cent indicated that it had been five or more years since their most recent role, as shown in Figure 22 below. For around one in ten (8 per cent), it had been less than six months since they stopped working in their most recent role.
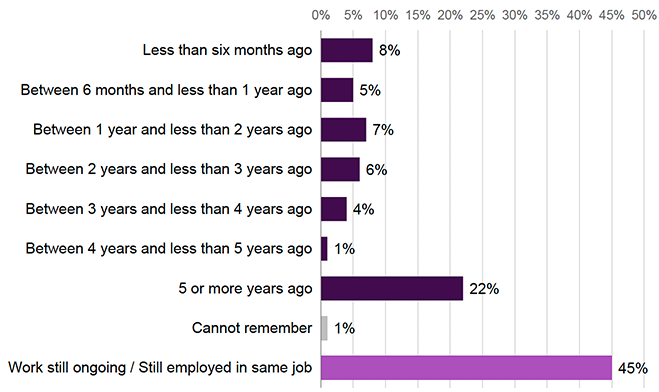
Source: IFF Research telephone survey of FSS customers, B4 How long ago did you stop working in your most recent role? Base: All (469)
Employment status[28] of the 2023-24 cohort at the time of the survey
The rest of this chapter will look at the working status of the 2023-24 cohort at the point of survey and the quality of work that they undertake. This is a snapshot of participants’ activities in June-July 2025 when the survey was conducted and does not represent FSS employment outcomes. A person joining FSS can expect to receive up to 12-18 months of pre-employment support, so for example, a person that joined in October 2023 could have been due to receive pre-employment support up until October 2024 or in some cases until March 2025. Statistics for employment outcomes for FSS can be found in Scotland's Devolved Employment Services statistics published quarterly.
At the time of the survey, 44 per cent of the 2023-24 cohort were either working for an employer or were self-employed (see Figure 23 below). Twenty-nine per cent were unemployed and looking for work (of those who were not employed, self-employed or confirmed not working, 4 per cent had done some paid work in the week leading up to the survey). Around one in ten (11 per cent) were not in employment due to sickness or disability. A small number of 2023-24 cohort participants were in education or training (6 per cent). A further 1 per cent were not working but due to start work within the next month.
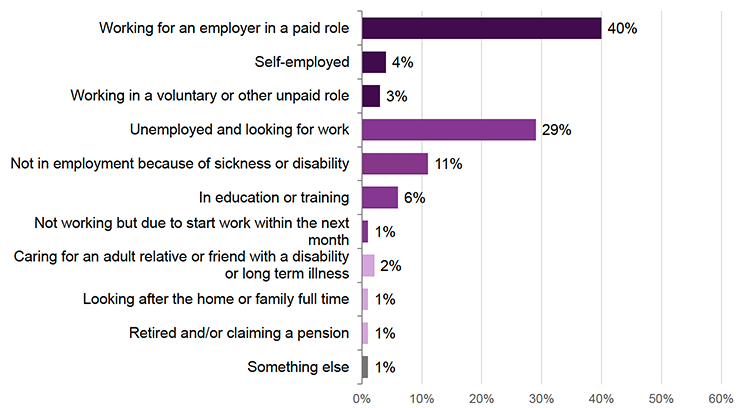
Source: IFF Research telephone survey of FSS customers, A1 Which of the following best describes what you are doing at the moment? Base: 2023-24 cohort (469)
There were several factors linked to participants’ employment status, as follows:
- male participants were more likely than female participants to be unemployed and looking for work (33 per cent compared to 20 per cent)
- participants who had achieved a degree or higher were more likely than those with no qualification to be working for an employer in a paid position (58 per cent compared to 34 per cent), they were also more likely than those with a National SCQF 1-5 or equivalent qualification (31 per cent) and Highers/Advanced Highers (40 per cent)
- older participants (aged 50 and over) were less likely to be working for an employer in a paid position than younger participants (aged 25-49) (30 per cent compared with 48 per cent)
- participants from a minority ethnic group were more likely to be working for an employer in a paid position (58 per cent) than white participants (33 per cent). This is likely because participants from a minority ethnic group had a younger age profile than participants from a white background
- participants from white backgrounds were more likely than minority ethnic participants to be working in a voluntary or unpaid role (4 per cent compared to 0 per cent) and not be in employment due to sickness or disability (14 per cent compared to 4 per cent)
- participants who had not worked in the last 5 years prior to joining FSS (26 per cent of those surveyed) were far less likely to be working for an employer in a paid position than those who had worked in the last 5 years (14 per cent compared to 50 per cent). They were more likely to be in education or training (10 per cent compared to 4 per cent), not in employment because of sickness or disability (17 per cent compared to 9 per cent), looking after the home or family full-time (4 per cent compared to 1 per cent), and be unemployed and looking for work (43 per cent compared to 25 per cent)
- participants who reported no health conditions were more likely to be working for an employer in a paid position than participants who reported a health condition that limits their day-to-day activity (50 per cent compared to 24 per cent). Those with a health condition that limited their day-to-day activities were more likely to be caring for an adult relative or friend than those with no health condition (5 per cent compared to less than 1 per cent)
- whether or not participants left the service early was also a contributing factor, with those leaving early less likely to be working for an employer in a paid position than those who did not (22 per cent, compared to 45 per cent). Early leavers were also more likely to not be in employment because of a sickness or disability than those who did not leave FSS early (25 per cent compared to 8 per cent). They were also more likely to be looking after the home or family than non-early leavers (4 per cent compared to 1 per cent), or caring for an adult friend or relative (7 per cent compared to 1 per cent)
- those who had re-joined FSS were less likely to not be in employment because of sickness or disability (6 per cent compared to 15 per cent among those who were not re-joiners)
Figure 24 below shows that among the 2023–24 cohort who had worked or were in education in the past week, just over one in ten (12 per cent) were working or studying for fewer than 16 hours per week. A quarter (25 per cent) were working or studying between 16 and 29 hours per week, while nearly three-fifths (63 per cent) were working or studying 30 or more hours per week.
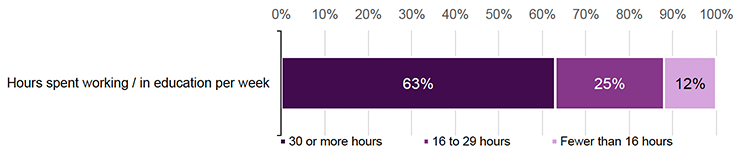
Source: IFF Research telephone survey of FSS customers. A3 How many hours per week do you usually work, or spend in education? Base: 2023-24 cohort in employment, self-employment, education or have worked in the last week (229)
Regarding number of hours usually spent working/studying per week by those in employment, self-employment or education:
- those who were actively searching for work before they started receiving support were more likely than those who were economically inactive to be working/studying 30 or more hours a week (68 per cent compared to 49 per cent)
- those without a health condition were more likely than those with a health condition that limits their day-to-day activities to report working 30 or more hours per week (41 per cent compared to 19 per cent)
- early leavers were more likely than non-early leavers to be working/studying fewer than 16 hours per week (22 per cent compared to 10 per cent), and less likely to be working/studying 30 or more hours (46 per cent compared to 66 per cent)
Participants who had done some paid work in the week prior to the interview were asked when they began their job: 36 per cent said they had started working in their current job less than 6 months ago; 31 per cent said they had started between six months and a year ago; and, 29 per cent said they had started more than one year ago.
The vast majority of FSS participants who were employed, self-employed or who had worked in the last week at the time of the interview had one job (94 per cent), with only 6 per cent saying they had two jobs, and less than 1 per cent saying they had three jobs or more.
Quality of work
The survey asked participants about their job roles, how much they earned and the type of contract they were employed on. These questions were asked of all participants who were employed at the time of the survey.
Occupation
Figure 25 below shows the profile of participants that were either employed, self-employed or had worked in the last week, by occupation. The occupations are colour-coded based on the broad occupational group they fall into[29].
The most common occupations of the 2023-24 cohort were elementary occupations (low-skilled or manual jobs) (28 per cent) followed by caring, leisure and other service occupations (19 per cent). A further 15 per cent worked in sales and customer service occupations and one in ten (10 per cent) worked in process, plant and machine operatives. This meant that nearly two-fifths (38 per cent) of participants worked in labour intensive occupations.
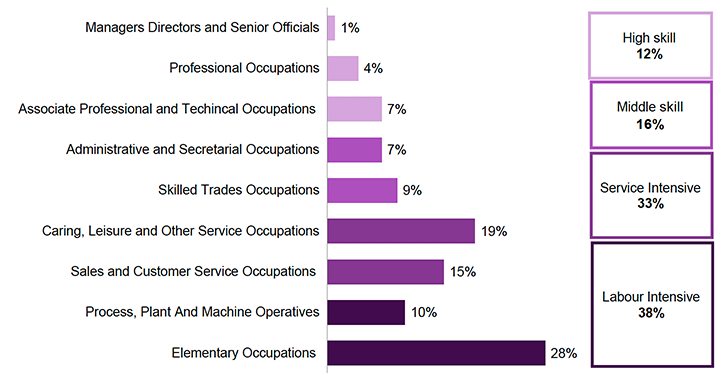
Source: IFF Research telephone survey of FSS customers. Taken from collating and coding answers from A5: What is/was your job title? And A6: What do/did you mainly do in your job? Base: 2023-24 cohort that were employed, self-employed or had worked in the last week (218)
Several factors had an impact on the type of occupations in which participants were working, as follows:
- female participants were more likely than males to work in service intensive occupations (55 per cent, compared to 21 per cent for male participants), and were less likely to work in labour intensive occupations (19 per cent, compared to 49 per cent for male participants)
- male participants aged 25-49 were more likely to work in labour intensive occupations than females aged 25-49 (47 per cent compared to 19 per cent)
- female participants who were not parents were more likely to work in service intensive occupations (59 per cent) than male participants who were not parents (16 per cent)
- qualification level was also a factor and those with National SCQF level 1 to 5 or equivalent were more likely than those with a degree or above to work in labour intensive jobs (53 per cent, compared to 34 per cent), and less likely to work in service intensive occupations (16 per cent, compared to 38 per cent). Those with a National SCQF Level 1 to 5 or equivalent were also more likely to work in labour intensive occupations than those with Higher/Advanced Highers or equivalant (20 per cent)
- those with health conditions that do not limit their day-to-day life were more likely than those with health conditions that limit their daily activities to work in labour intensive jobs (61 per cent, compared to 39 per cent with limiting health conditions)
- male participants with limiting health conditions (56 per cent) and without health conditions (46 per cent) were both more likely than female participants without health conditions to work in labour intensive occupations (16 per cent)
- white participants were more likely than participants from ethnic minority backgrounds to work in middle skill professions (22 per cent compared to 6 per cent), but less likely to be employed in service intensive occupations (20 per cent compared to 50 per cent)
- there were no differences in type of occupation between participants who had worked or not worked in the last five years, participants who were early leavers and those who were not, whether or not participants were from a priority family, or whether participants had re-joined
Income
FSS participants who were employed, self-employed or who had reported in the survey having done paid work in the last week were asked what their usual pay was including overtime, bonuses or tips, but before tax and other deductions are taken out. This information on their usual gross earnings (i.e. pay before tax or any other deductions) reported by survey participants was classified by pay range bands in the survey[30]. This data was then analysed to benchmark participants’ reported usual pay against the thresholds for the National Living Wage and the Real Living Wage rates (see Figure 26 below)[31]. Since this analysis is based on participants’ reported earnings rather than on official PAYE data, this analysis represents an estimate of whether participants were earning the National Living Wage and Real Living Wage at the time of the survey.
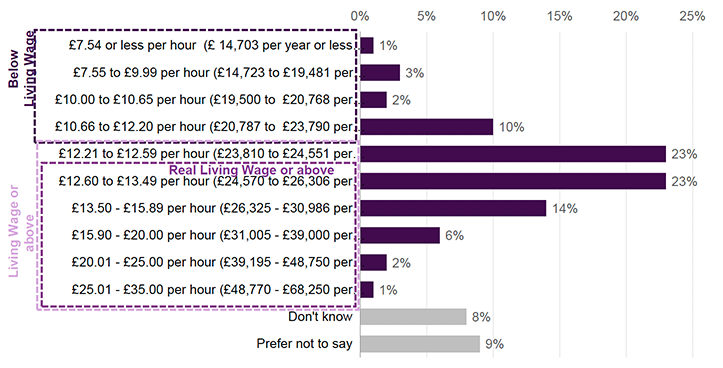
Source: IFF Research telephone survey of FSS customers, A7: Can you tell me your usual pay including overtime, bonuses, or tips (but before tax and other deductions are taken out)? Base: All employed self-employed or had worked in the last week aged 21 and over (197)
*Please note that the National Living Wage is the legal minimum employers must pay workers if they are aged 21 or above. The Real Living Wage is a voluntary wage rate set by the Living Wage Foundation each year and is a rate that employers sign up to pay (i.e. it is not a legal minimum wage rate).
National Living Wage
At the time of the survey, individuals classed as ‘workers’ who were aged 21 or above were legally entitled to the National Living Wage[32]. This has changed since the previous survey, when only those aged 23 or over were legally entitled to the National Living Wage. At the time of the current survey, the National Living Wage was £12.21 per hour.
Over nine in ten (91 per cent) of the 2023-24 cohort who were in work (those who were employed, self-employed or who had done paid work in the last week) stated that they were aged 21 or over. Of this group (21 or over and in work), the majority (69 per cent) reported earnings that indicated they were earning at least the National Living Wage rate, 16 per cent reported earnings that suggested that they earned below the National Living Wage rate and 17 per cent did not provide earnings information.
The 16 per cent of those aged 21 or over who reported earnings that suggested they earned below the National Living Wage rate comprised 29 participants (none of whom were apprentices), as follows:
- five of these participants were self-employed. Those who are self-employed are not entitled to the National Living Wage[33]
- one of these participants was in education or training. Some placement or work experience employers may offer students a stipend, although those undertaking certain types of internships are not necessarily entitled to the National Minimum Wage[34]
- the remaining twenty-three participants aged over 21 who reported earnings that suggested they earned below the National Living Wage were working for an employer in a paid role. Of these:
- 16 were on a permanent employment contract
- 6 were on a temporary employment contract
- 1 was on a zero hour contract
It is important to note earnings are self-reported and subject to human error or recall issues. Employer-reported figures are not available.
National Minimum Wage
At the time of the survey, individuals who were classed as ‘workers’ and who were aged between 16 and 20 were legally entitled to the National Minimum Wage[35]. This has changed since the previous survey, where those aged between 16 and 22 were previously entitled to the National Minimum Wage. At the time of the current survey, the National Minimum Wage was between £7.55 and £10 (depending on the individual’s age).
Only five per cent of those in work stated that they were aged under 21. Of the 11 survey respondents who were aged under 21 and in work, 10 reported earnings that suggested they were paid at least the National Minimum Wage for their age. The other individual was 18 years old and reported earning between £7.55 and £9.99 (they reported being employed in a paid role and having a permanent contract).
Real Living Wage
The Real Living Wage is a wage rate based on the cost of living (£12.60 at the time of the survey). It is set annually by the Living Wage Foundation based on a basket of household goods and services. Employers are not legally required to pay their workers this wage.
Of participants aged 21 and over and in work, 45 per cent reporting earnings that suggested that they were earning at least the level of the Real Living Wage.
Comparisons of income level between early leavers and those who didn’t leave the service early could not be made due to a low sample size among early leavers in work.
Type of employment contract
Participants in the 2023-24 cohort who had worked within the last week were asked what type of employment contract they had. The results can be seen in Figure 27 below. Three in five (60 per cent) had a permanent employment contract, while one in eight (12 per cent) had a temporary contract, 14 per cent were employed on a zero hours contract[36] and 7 per cent were self-employed.
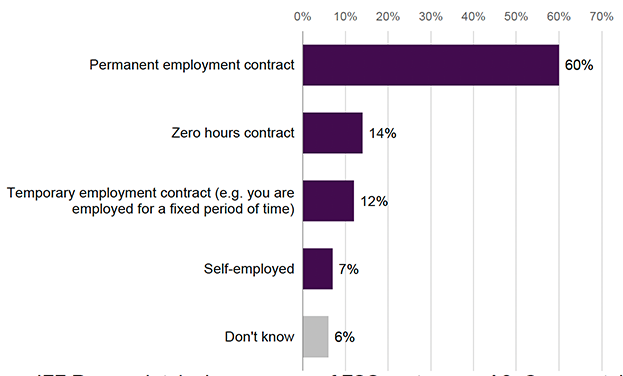
Source: IFF Research telephone survey of FSS customers, A8: Can you tell me what type of employment contract you have? Base: All employed, self-employed or have worked in the last week (218)
There were some subgroup differences between the types of contracts that participants held, as follows:
- minority ethnic participants were more likely than white participants, to be employed on a temporary contract (20 per cent compared to 9 per cent for white participants)
- female participants were more likely to hold a permanent contract than male participants (70 per cent compared to 54 per cent)
- participants aged between 16 and 24 were more likely than those 25 and above to be employed on a zero hours contract (27 per cent compared to 12 per cent)
- participants who were qualified to degree level or above were more likely than those with National SCQF 1 to 5 qualifications or equivalent to have a temporary employment contract (19 per cent compared to 5 per cent)
- those actively searching for work before FSS were more likely than those who reported not actively searching for work/being economically inactive before FSS, to be on a permanent employment contract by the time of the survey (65 per cent compared to 43 per cent)
- the type of employment contract held by participants did not significantly differ whether they belonged to a priority family, whether or not they were an early leaver of FSS, and whether they were a new joiner or had re-joined FSS