Fair Start Scotland Evaluation Report - Year 6: Phone Survey with Service Participants - March 2026
Research report detailing findings from the fifth Wave of a phone survey undertaken to capture the experiences of Fair Start Scotland (FSS) participants. The report is one element of an evaluation programme of FSS, and focuses on evaluating Year 6 (April 2023-March 2024) of FSS delivery
Chapter Three: Profile of Participants
Overall summary
This chapter provides an overview of the participants who joined the service between October 2023 and March 2024, referred to throughout as the 2023-24 cohort. It sets out the profile of participants by gender and age, qualification level, and ethnicity. The proportion of participants who were classified as being in “priority family groups” is also presented. Analysis has been undertaken to identify any notable differences in profile of participants between the 2023-24 cohort, and previous cohorts surveyed in previous waves.
Key findings:
- around two-thirds of the 2023-24 cohort surveyed were male, and around a third were female
- just over half of participants were aged 35 or older, with just under half being younger
- a notable portion of participants held degree-level qualifications, while a minority (less than one in ten) had no formal qualifications. Younger participants were more likely to be qualified to Scottish Credit and Qualification Framework (SCQF) Level 1 to 5, whilst older participants were more likely to hold no qualifications
- the majority of participants identified as white, with some representation from minority ethnic backgrounds
- just under two-fifths of participants had a health condition which limits their day-to-day activities, a similar proportion had no health condition, and just over one in ten had a health condition but no limitations
- around one in five participants were parents, and most of these belonged to priority family groups, most commonly lone parents or parents with a disability or health condition
- a third of participants had previously engaged with the service, and over half of these had accessed support multiple times. Some groups were more likely to be re-joiners, for example those who were aged 25 and over
Participant characteristics
Gender and age
Around two-thirds (66 per cent) of the 2023-24 cohort were male, and a third were female (34 per cent), as shown in Figure 3 below. Less than 1 per cent of participants identified in another way.
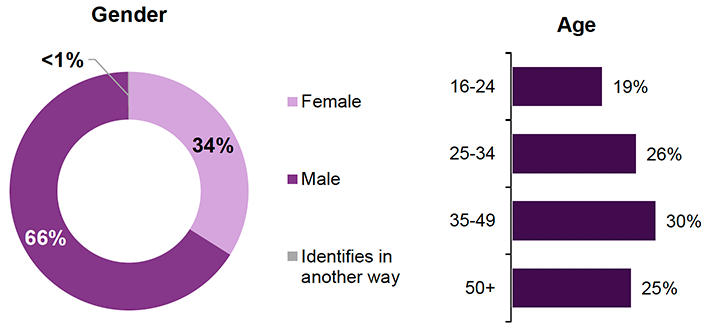
Source: IFF Research telephone survey of FSS customers, sample information: H1_W5 Do you identify as...? H2. Which of the following age bands do you fall into? Base: All 2023-24 cohort (469)
The majority of participants were aged 35 or above, 30 per cent were aged 35 to 49 and 25 per cent were aged 50 or above. Just over a quarter (26 per cent) were aged 25 to 34, and the remaining 19 per cent were aged 16 to 24.
Qualification level
As shown in Figure 4 below, just over a quarter (28 per cent) of the 2023-24 cohort held a qualification at Scottish Credit and Qualifications Framework (SCQF) Level 8 or above (e.g. a Degree), 16 per cent of participants held their highest qualification at SCQF Level 6 to 7 (e.g. Highers), and 32 per cent were qualified no higher than SCQF Level 5.
Of those remaining, 8 per cent of participants held no qualifications, 5 per cent had an other qualification, 9 per cent did not know, and 2 per cent were unwilling to report them.
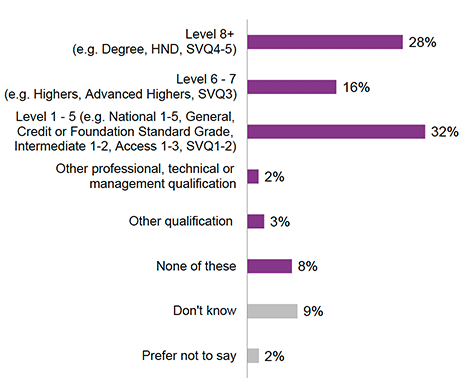
Source: IFF Research telephone survey of FSS customers: H3. What is the highest level of qualification that you have achieved? Base: All 2023-24 cohort (469)
Younger participants were more likely to be qualified to SCQF Level 1 to 5 (48 per cent of those under 25 compared to 28 per cent of those 25 or older), whilst older participants were more likely to hold no qualifications (18 per cent of those aged 50 or above compared to 3 per cent of those aged under 35).
Participants aged 25 or above were over three times more likely to have SCQF Level 8+ qualifications (32 per cent compared to 9 per cent of younger participants).
Ethnicity
Almost two-thirds (65 per cent) of the 2023-24 cohort described their ethnic background as white, as shown in Figure 5 below. This includes those who described their background as white Scottish (47 per cent), white other British (13 per cent), and other white minority groups (white Polish 1 per cent and other white ethnic groups 3 per cent). Among those who described their ethnic background as white, 68 per cent were male and 32 per cent were female.
Around one-fifth of participants (21 per cent) were from other minority ethnic groups. Over a tenth (11 per cent) were from an African, African Scottish, African British or any other African background. Participants from Asian or Asian British backgrounds accounted for 7 per cent of the cohort (of these almost half were from an Indian, Indian Scottish or Indian British background). Less than 1 percent of participants were from a Caribbean or Black, Black Scottish or Black British background. Among those who were from a minority ethnic group, 59 per cent identified as male and 41 per cent identified as female.
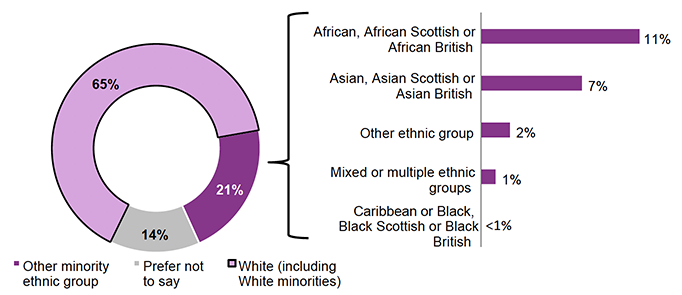
Source: IFF Research telephone survey of FSS customers: H4. Which of the following best describes your ethnic background? Base: All 2022-23 cohort (469)
Participants from a minority ethnic background were more likely to be aged 25 to 49 (78 per cent compared to 48 per cent among white participants). White participants were more likely to be aged 50 and over (31 per cent compared to 12 per cent among participants from a minority ethnic background). Participants from a minority ethnic background were also more likely to be qualified to SCQF Level 8+ (58 per cent compared to 16 per cent of white participants)[14].
Priority families
The Scottish Government has identified a number of priority family groups. These are family types that have a higher-than-average risk of child poverty. These include lone parents, young parents (under 25 years old), parents from minority ethnic groups, parents with a disability/health condition, families with three or more children, and families with a child under 12 months of age. There is a desire to further understand the impact of employability support on tackling child poverty, to help develop future policy provision.
Twenty-two per cent of the 2023-24 cohort were parents. Of these, only five participants (or 5% of all parents) did not belong to a priority family. As shown in Figure 6 below, of those who belonged to a priority family group this was most commonly because they were lone parents (10 per cent) or parents with a disability or a health condition (10 per cent). Of those who were members of a priority family, three in five (60 per cent) met two or more qualifying criteria, and 15 per cent met three or more criteria (hence the total “Type of priority family” % in Figure 6 being greater than 22%).
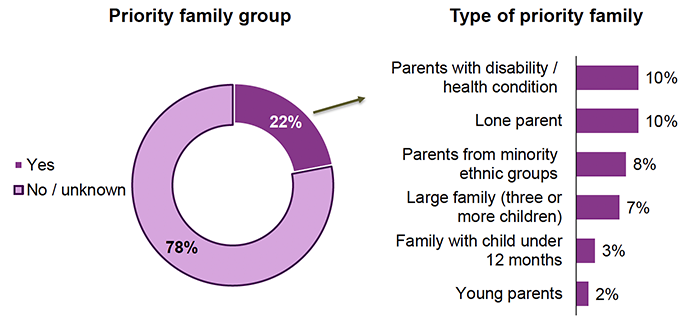
Source: IFF Research telephone survey of FSS customers, W5. Base: 2023-24 cohort (469)
Re-joining the service
Of the 2023-24 cohort, just under a third (32 per cent) were “re-joiners”, of which 44 per cent had received support twice from FSS, and 56 per cent had received support three times or more.
Within the 2023-24 cohort, the following groups were more likely to be re-joiners:
- participants aged 25 and over (34 per cent) compared to participants aged 16 to 24 (23 per cent)
- participants who were currently in paid employment (37 per cent) compared to those who were economically inactive (24 per cent)
- male participants who are parents (37 per cent) compared to male participants who are not parents (34 per cent)
- female participants who are not parents (36 per cent) compared with female participants who are parents (18 per cent)
Differences in profile of participants
The 2023-24 cohort had similar gender, age and priority family profiles to previous cohorts. The proportion of the 2023-24 cohort who were female (34 per cent) was consistent with the 2021-22 cohort (37 per cent), 2019 and 2018 cohorts (both 36 per cent), but less than the 2020 cohort (40 per cent).
A quarter (25 per cent) of the 2023-24 cohort were aged 50 or older, compared to 28 percent of the 2021-22 and 21 per cent of the 2020 cohort. Almost a fifth (19 per cent) of the 2023-24 cohort were under 25, which is in line with the 2021-22 cohort (16 per cent), but lower than the proportion of under 25-year-olds in the 2020 cohort (25 per cent).
Given that the 2020 cohort included relatively more female and younger participants, comparisons to the 2020 cohort should be treated with caution.
The proportion of the 2023-24 cohort who were in priority family groups in (22 per cent) was similar to previous cohorts (21 per cent in 2021-22, 19 per cent in 2020, 21 per cent in 2019). The 2023-24 cohort were less likely to report having long-term conditions than previous cohorts (this is explored further in Chapter 4).