US Export Plan
The USA Export Plan has been developed to provide targeted, state-level insights that highlights where Scotland’s export strengths most effectively align with specific United States (US) market demands. This is delivered through robust evidence-backed deliverables including sector summaries.
Sector-to-State Matrix
Drawing on over 100 KPIs and using Multi-Criteria Decision Analysis (MCDA), this visual matrix maps Scotland’s priority export sectors against US states, highlighting where the best overall fits exist between Scottish strengths and state-level opportunities. This results in a shortlist of five US states per sector that are top priorities for Scotland. This has been stress tested with key stakeholders to ensure that the short list is robust and grounded in the practical insights. Alongside this, sensitivity analysis was carried out to test the robustness of the results against changes in weights of scoring criteria. The tool’s flexibility and adaptability enable the Scottish Government to update it in future years and adjust weightings as needed, ensuring it remains responsive to the evolving trade landscape and emerging export priorities.
Screenshot of Matrix tool
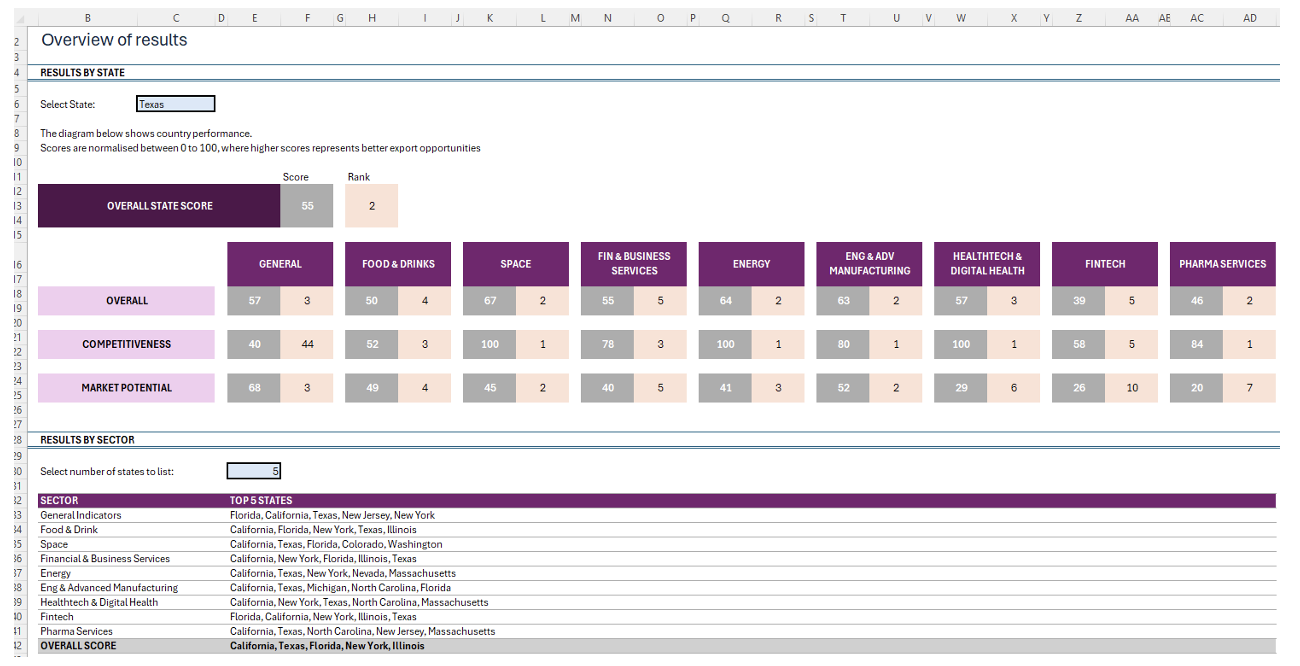
Approach to matrix
The Matrix indicators are grouped into three broad categories:
General – This category captures measures reflecting the overall population and broad business environment including population, population growth, Gross Domestic Product (GDP), a Connectivity composite score and CNBC’s ‘Ease of Doing business’ index.
Competitiveness – These indicators assess the strengths and openness of the market. Includes measures on import concentration, presence of trade enablers such as MOU’s and percentage of imports sourced from the UK.
Market potential – Includes size of market opportunity including wide range of measures that varies by sector such as GDP by sector, number of businesses in sector, Venture Capital deals by sector. This category also includes more niche sector-specific measures such as number of spaceports (Space), Food and drink sales (Food & Drink), percentage of power by renewables (Renewables), presence of regulatory sandboxes (FinTech) and health insurance premiums (HealthTech and Digital Health).
Overall performance combines results across all sectors and the general indicators, applying a weighting of 10% for each sector and 20% for the general indicators.
Sector-to-State Summary Matrix
The table below provides a visual of the sector-to-state Matrix for all US states. The numbers reflect the ranked position relative to all other states – with 1 indicating greatest opportunity overall.
| Overall Rank | State | General | Food and Drink | Space | Financial & Business Services | Renewables and Low-carbon energy | Engineering and Advanced Manufacturing | HealthTech and Digital Health | FinTech | Pharma |
|---|---|---|---|---|---|---|---|---|---|---|
| 1 | California | 2 | 1 | 1 | 1 | 1 | 1 | 1 | 2 | 1 |
| 2 | Texas | 3 | 4 | 2 | 5 | 2 | 2 | 3 | 5 | 2 |
| 3 | Florida | 1 | 2 | 3 | 3 | 27 | 5 | 6 | 1 | 9 |
| 4 | New York | 5 | 3 | 20 | 2 | 3 | 7 | 2 | 3 | 13 |
| 5 | Illinois | 16 | 5 | 25 | 4 | 6 | 10 | 7 | 4 | 7 |
| 6 | Massachusetts | 11 | 12 | 17 | 6 | 5 | 14 | 5 | 22 | 5 |
| 7 | North Carolina | 8 | 34 | 13 | 7 | 17 | 4 | 4 | 7 | 3 |
| 8 | New Jersey | 4 | 8 | 34 | 16 | 11 | 9 | 12 | 29 | 4 |
| 9 | Washington | 18 | 6 | 5 | 10 | 18 | 11 | 8 | 14 | 12 |
| 10 | Colorado | 14 | 10 | 4 | 8 | 13 | 18 | 19 | 20 | 20 |
| 11 | Georgia | 7 | 9 | 19 | 9 | 40 | 8 | 21 | 15 | 21 |
| 12 | Indiana | 15 | 7 | 28 | 19 | 19 | 6 | 9 | 33 | 10 |
| 13 | Ohio | 23 | 35 | 8 | 15 | 41 | 12 | 11 | 11 | 11 |
| 14 | Pennsylvania | 12 | 38 | 14 | 14 | 36 | 15 | 17 | 31 | 6 |
| 15 | Utah | 19 | 44 | 36 | 20 | 8 | 16 | 14 | 6 | 16 |
| 16 | Virginia | 6 | 37 | 6 | 17 | 28 | 22 | 20 | 25 | 27 |
| 17 | Delaware | 17 | 23 | 39 | 12 | 10 | 30 | 26 | 10 | 23 |
| 18 | Arizona | 13 | 27 | 10 | 24 | 16 | 17 | 24 | 9 | 28 |
| 19 | South Carolina | 10 | 16 | 30 | 27 | 22 | 13 | 18 | 42 | 15 |
| 20 | Tennessee | 9 | 21 | 29 | 25 | 46 | 23 | 15 | 35 | 8 |
| 21 | Minnesota | 27 | 17 | 12 | 13 | 30 | 28 | 10 | 28 | 24 |
| 22 | Maryland | 20 | 28 | 11 | 21 | 45 | 24 | 13 | 40 | 22 |
| 23 | Connecticut | 22 | 19 | 21 | 11 | 31 | 29 | 28 | 27 | 18 |
| 24 | Nevada | 26 | 22 | 15 | 34 | 4 | 42 | 38 | 8 | 42 |
| 25 | Missouri | 25 | 15 | 22 | 23 | 42 | 25 | 27 | 17 | 26 |
| 26 | Michigan | 44 | 40 | 9 | 18 | 37 | 3 | 22 | 39 | 19 |
| 27 | Oklahoma | 43 | 13 | 18 | 33 | 15 | 20 | 16 | 23 | 37 |
| 28 | Kentucky | 21 | 14 | 33 | 36 | 38 | 26 | 35 | 24 | 14 |
| 29 | Oregon | 32 | 43 | 27 | 22 | 9 | 19 | 25 | 30 | 30 |
| 30 | Louisiana | 40 | 20 | 32 | 32 | 7 | 38 | 23 | 34 | 17 |
| 31 | Wisconsin | 30 | 11 | 31 | 26 | 44 | 21 | 30 | 38 | 31 |
| 32 | Alabama | 28 | 36 | 7 | 30 | 48 | 27 | 31 | 49 | 29 |
| 33 | Hawaii | 31 | 26 | 24 | 46 | 23 | 47 | 50 | 13 | 46 |
| 34 | Kansas | 35 | 18 | 26 | 28 | 32 | 34 | 33 | 47 | 33 |
| 35 | New Mexico | 47 | 31 | 16 | 44 | 14 | 43 | 36 | 48 | 38 |
| 36 | Rhode Island | 36 | 29 | 49 | 39 | 25 | 31 | 29 | 36 | 34 |
| 37 | Nebraska | 33 | 30 | 46 | 35 | 35 | 35 | 34 | 32 | 35 |
| 38 | Alaska | 29 | 25 | 35 | 48 | 50 | 50 | 39 | 26 | 49 |
| 39 | New Hampshire | 24 | 46 | 23 | 43 | 34 | 32 | 46 | 37 | 41 |
| 40 | Arkansas | 41 | 24 | 41 | 38 | 49 | 44 | 32 | 46 | 40 |
| 41 | Wyoming | 45 | 41 | 43 | 31 | 21 | 45 | 44 | 12 | 48 |
| 42 | Maine | 38 | 47 | 45 | 41 | 12 | 36 | 42 | 44 | 44 |
| 43 | West Virginia | 49 | 39 | 44 | 49 | 24 | 33 | 41 | 16 | 25 |
| 44 | South Dakota | 48 | 33 | 47 | 50 | 29 | 49 | 49 | 21 | 43 |
| 45 | Idaho | 34 | 49 | 38 | 37 | 39 | 46 | 47 | 43 | 32 |
| 46 | Iowa | 42 | 42 | 42 | 29 | 26 | 39 | 40 | 45 | 36 |
| 47 | North Dakota | 50 | 32 | 48 | 47 | 20 | 41 | 37 | 41 | 50 |
| 48 | Montana | 39 | 50 | 40 | 45 | 43 | 48 | 43 | 18 | 45 |
| 49 | Mississippi | 37 | 45 | 37 | 40 | 47 | 40 | 45 | 50 | 39 |
| 50 | Vermont | 46 | 48 | 50 | 42 | 33 | 37 | 48 | 19 | 47 |
Broadly, the top five states overall - California, Texas, Florida, New York, and Illinois - demonstrate strengths across all priority sectors. In particular, California and Texas consistently rank in the top 5 in every sector assessed, reflecting their role as large, established economies with high GDP and consumer spending, deep venture investment, substantial UK import flows, and world‑renowned industry clusters (e.g., the San Francisco Bay Area and Greater Los Angeles in California; Austin and Dallas-Fort Worth in Texas). Florida also performs strongly across most sectors (with the exception of Renewables), followed by New York, which combines scale with concentrated strengths in high‑value, knowledge‑intensive industries. Illinois rounds out the top five, showing solid, broad‑based performance across the majority of sectors, with comparatively less depth in space but sustained competitiveness elsewhere.
Beyond the big five: Secondary states with sector-specific potential
The matrix also highlights several states that buck the overall trend, performing exceptionally well in a specific priority sector while ranking lower in overall performance. These states present distinct niche, sector‑specific opportunities that may warrant targeted exploration alongside the primary market focus.
Specifically, these states rank within the top 20 for the relevant sector but fall outside the top five overall, indicating specialised opportunities where targeted engagement could deliver disproportionate impact. The following states exemplify this pattern:
- Wisconsin (Food and Drink) - The state’s large F&B industry, global linkages, and strong demand for high‑quality, innovative products make it a promising US region for market entry for some businesses in the sector. Notably, 7 out of the 10 largest food companies in the world have operations in Wisconsin and it is the number one producer of cheese in the US[7].
- Alabama (Space) – Alabama (especially Huntsville or “Rocket City”) has one of the most significant and fastest growing space ecosystems in the US. Its importance is underlined by the transition of the US Space Command headquarters being relocated to Redstone Arsenal in Huntsville[8]. For Scottish exporters it presents opportunities for companies in precision engineering, advanced material, propulsion components and dual-use technologies.
- Maine (Renewables and low-carbon) – Maine has a fully developed offshore wind roadmap and possesses 156 GW of offshore wind capacity in deep water. It is well suited for floating wind which aligns with Scotland’s global expertise in this field. However, BOEM cancellations in 2025 have created uncertainty, despite the state remaining committed to the long-term development of offshore wind.
- Wyoming (FinTech) – While not a broad-based FinTech cluster (like California and NY), it is an emerging crypto-friendly state, attracting blockchain and alternative lending ventures. Start-ups in blockchain and FinTech sectors are increasingly attracted to the state due to its clear supportive legislative framework, tax incentives and unique banking structure[9].
Contact
Email: William.Gray@gov.scot