
Domestic solid fuel burning - effects of PM2.5 on health outcomes: evaluation
This study assesses the potential health benefits of further policy actions affecting domestic solid fuel burning in Scotland. Three options were taken forward for more detailed modelling: burn less; burn better; and targeted stock upgrades.
7 Health and distributional impacts of policy options
7.1 Impacts on mortality and morbidity associated with air pollutant exposure
The impacts of the policy scenarios on health outcomes associated with exposure to air pollution are presented in the following table. In summary:
- Policy 2 delivers the most significant overall health benefits – for example, it reduces attributable deaths per annum by 14.3, compared to a reduction of 4.9 deaths per annum under Policy 3 and 1.8 deaths per annum under Policy Scenario 1.
- The size of impacts delivered by each scenario scale in line with the reductions in population weighted exposure estimated in the air quality modelling. Alongside impacts on attributable deaths, the scenarios also deliver benefits through reductions in hospital admissions, new cases of disease, and work days lost.
- Policy 3 delivers the largest proportion of its effects in the six most affected LAs (69% of total deaths per annum), whereas the benefit in these specific areas is lower under Policy 1 (58%) and Policy 2 (59%).
| Pathway | Absolute health impact scenario 1 | Absolute health impact scenario 2 | Absolute health impact scenario 3 | Change relative to baseline scenario 1 | Change relative to baseline scenario 2 | Change relative to baseline scenario 3 |
|---|---|---|---|---|---|---|
| Chronic exposure - #Deaths | 157 | 145 | 155 | -1.8 | -14.3 | -4.9 |
| Chronic exposure - Life years lost | 1,783 | 1,642 | 1,758 | -20 | -162 | -56 |
| RHA - #admissions | 37 | 34 | 37 | -0.4 | -3.4 | -1.2 |
| IHD - #cases | 23 | 21 | 22 | -0.3 | -2.0 | -0.7 |
| Stroke - #cases | 27 | 25 | 27 | -0.3 | -2.5 | -0.8 |
| Lung cancer - #cases | 13 | 12 | 13 | -0.1 | -1.2 | -0.4 |
| Asthma (Older Children) - #cases | 37 | 34 | 37 | -0.4 | -3.4 | -1.2 |
| WDL - #WDL | 18,120 | 16,683 | 17,863 | -205 | -1,643 | -565 |
| WDL (Care) - #care hours | 4,881 | 4,494 | 4,812 | -55 | -442 | -152 |
| WDL (vol) - #vol. hours | 2,045 | 1,883 | 2,016 | -23 | -185 | -64 |
| mRADs - #WDL due to mRAD | 6,254 | 5,758 | 6,165 | -71 | -567 | -195 |
As for the baseline, the estimation of health impacts, under the policy scenarios, contain various uncertainties. Sensitivity tests have been performed to explore uncertainty in the results, which show:
- There is uncertainty in the quantitative relationship linking exposure to health impact, represented by the CRF. The range varies by impact, for example:
- The change in attributable deaths per year varies from 1.4-2.0 for Policy 1 (central estimate 1.8), 10.8-16.0 for Policy 2 (central estimate 14.3), and from 3.7-5.5 for Policy 3 (central estimate 4.9), and
- The change in number of workdays lost through absenteeism per year varies from 180-240 for Policy 1 (central estimate 210), 1,400-1,900 for Policy 2 (central estimate 1,600), and from 480-650 for Policy 3 (central estimate 565).
- new cases of diabetes (1.2, 9.6 and 3.3 under Policy 1, 2 and 3 respectively), and
- work days lost due to child absence from school resulting from the health impacts of pollution (12, 97 and 33 under Policy 1, 2 and 3 respectively).
- Exposure to air pollution is associated with a much wider range of health pathways than those included in the central estimates. The change in all Scottish solid fuel burning could be associated each year with an additional reduction in:
- cardiovascular hospital admissions (0.2, 1.8 and 0.6 under Policy 1, 2 and 3 respectively)
- new cases of diabetes (1.2, 9.6 and 3.3 under Policy 1, 2 and 3 respectively), and
- work days lost due to child absence from school resulting from the health impacts of pollution (12, 97 and 33 under Policy 1, 2 and 3 respectively).
7.2 Effect on spatial and demographic variation in exposure to air pollution
7.2.1 Variation between Local Authorities
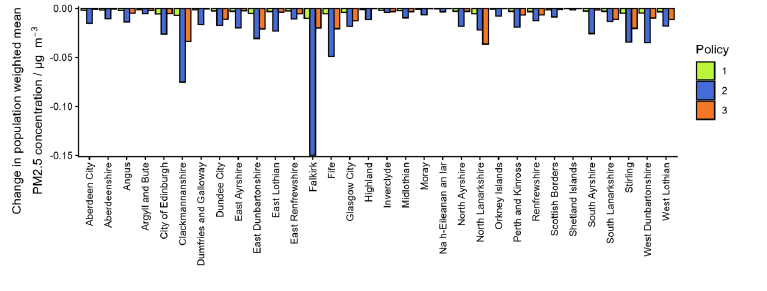
The change in population weighted mean PM2.5 concentration associated with each policy scenario was plotted for each Local Authority within Scotland (Figure 7‑1). Because the effects of Policy 1 are proportional to the reduction in fuel use, they are strongest in the Local Authorities with higher concentrations associated with solid fuel burning, as the 1% reduction is a higher amount of PM2.5 in these areas. Policy 2 has a varied impact on different Local Authorities, with the greatest effect being in Falkirk due to the high concentrations associated with solid fuel, driven by the prevalence of MSF as a fuel, which sees the greatest reduction in emissions under Policy 2. The effects of Policy 3 are strongest in the targeted Local Authorities of City of Edinburgh, Glasgow City, Fife, North Lanarkshire, Falkirk and South Lanarkshire, but are also apparent in other Local Authorities, notably Clackmannanshire and Stirling. This is due to medium range transport of PM2.5 and precursors, leading to beneficial results also being experienced by areas downwind of the targeted Local Authorities. Overall, Policy 2 has the largest impact on concentrations associated with solid fuel burning for all but one Local Authority (North Lanarkshire under Policy 3), when compared with the other policy options.
Figure 7‑1: The change in PM2.5 PWMC under each proposed policy scenario for each local authority in Scotland
7.2.2 Variation between urban and rural
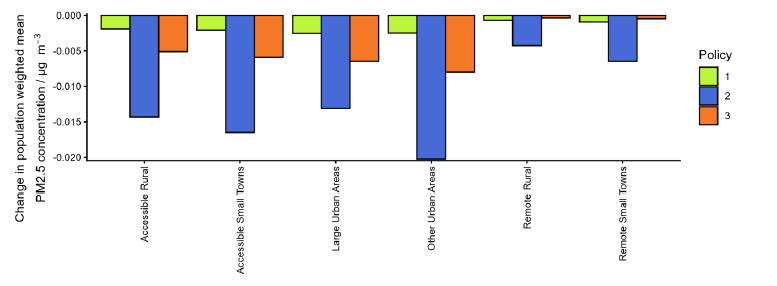
The change in population weighted mean PM2.5 concentration associated with each policy scenario was plotted for each urban rural classification within Scotland (Figure 7‑2). This shows that the effect of each policy option differs based on urban rural classification, with remote areas having the least effect, and urban areas having the greatest effect. Other urban areas, which have a lower population than large urban areas, has a greater effect from Policy 2 than large urban areas, driven by the prevalence of MSF in these areas, which has the greatest reduction in emissions under Policy 2. The effects of Policy 1 and 3 follow the expected pattern, with the largest, most densely populated areas having the highest effects.
Figure 7‑2: The change in PM2.5 PWMC under each proposed policy scenario for each urban rural classification in Scotland
7.2.3 Variation between SIMD and protected characteristics
The change in population weighted mean PM2.5 concentration associated with each policy scenario was plotted for each SIMD decile within Scotland (Figure 7‑3) in order to investigate any effects on inequality in exposure. Policy 1 has a similar effect within all SIMD Deciles, which is expected as the PM2.5 concentrations associated with solid fuel burning are similar for all of them, so a 1% reduction has no effect on their relative sizes. Policy 2 sees the greatest reduction in air pollution for deciles 5, 3 and 10 (in order of significance), and the lowest effect on deciles 1, 2, 7 and 4. This is likely due to a combination of favoured fuel, quantity of burning and quality of burning.
Figure 7‑3: The change in PM2.5 PWMC under each proposed policy scenario for each SIMD decile in Scotland
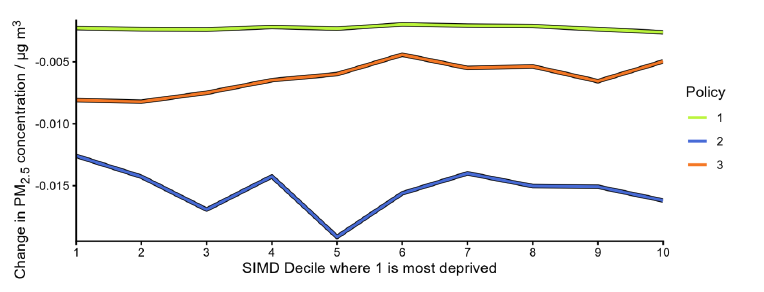
Figure 7‑4: The change in PM2.5 PWMC under each proposed policy scenario for each ethnic group in Scotland
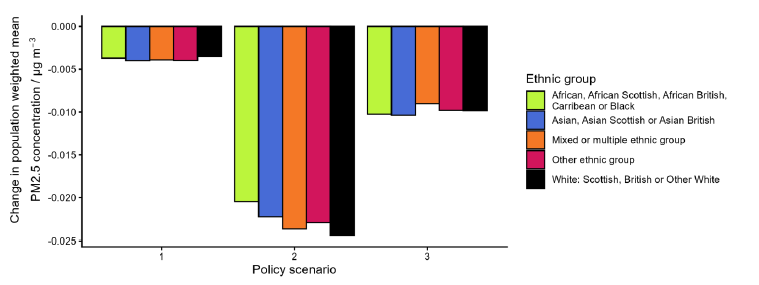
Figure 7‑5: The change in PM2.5 PWMC under each proposed policy scenario for broad disability classifications in Scotland
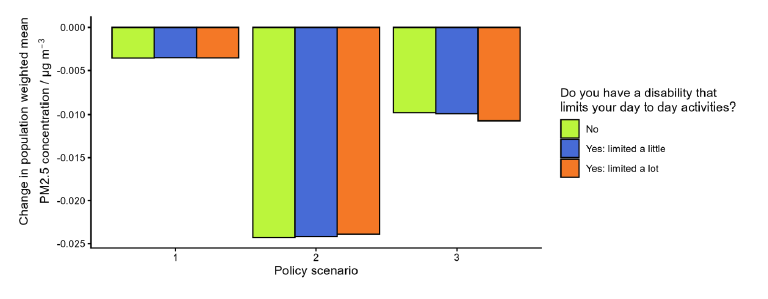
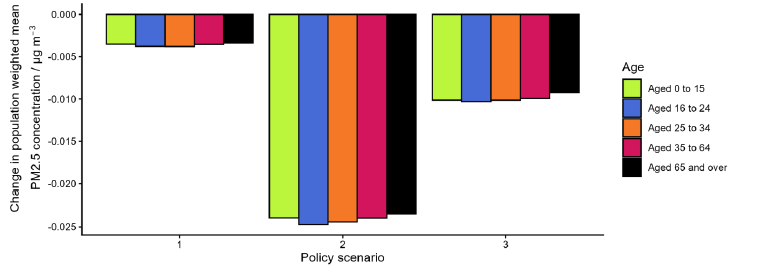
Figure 7‑6: The change in PM2.5 PWMC under each proposed policy scenario for each age group in Scotland
The effects of policy 3 are strongest (most significant reduction in air pollution) for the most deprived deciles, with the effects steadily decreasing up to decile 6 and then plateauing up to decile 10, with a higher effect seen at decile 9. This may be driven by the relative deprivation of the Local Authorities in which action is taken and those nearby.
The effects of each policy on different protected characteristics were also evaluated. This showed that each policy had broadly similar impacts on different ethnic groups (see Figure 7‑4), different disability statuses (see Figure 7‑5) and age groups (see Figure 7‑6).