Domestic solid fuel burning - effects of PM2.5 on health outcomes: evaluation
This study assesses the potential health benefits of further policy actions affecting domestic solid fuel burning in Scotland. Three options were taken forward for more detailed modelling: burn less; burn better; and targeted stock upgrades.
9 Appendices
A1 Analysis of Census 2022 data
Census 2022[37] data provide insights into who is using solid fuel as a central heating source. Around 8,200 households in Scotland were recorded as using solid fuel (excluding wood) as their central heating source (or 0.3%), around 11,500 (or 0.5%) as using wood or biomass, and 154,000 households as having two or more types of central heating system (or 6.1% - the exact energy source is not defined). Given very few households use solid fuels as their main and only central heating source, it is reasonable to assume that the majority of solid fuel burning is supplementary, either for aesthetic purposes, or to offset the use of other heating fuels (and associated costs). There are two further, plausible reasons, although these lack published evidence: to cover gaps in service in remote areas (power cuts, etc.), and to provide a short-term boost for Air Source Heat Pump (ASHP) based central heating (there is evidence that supplementary heating is a feature of ASHP use[38]).
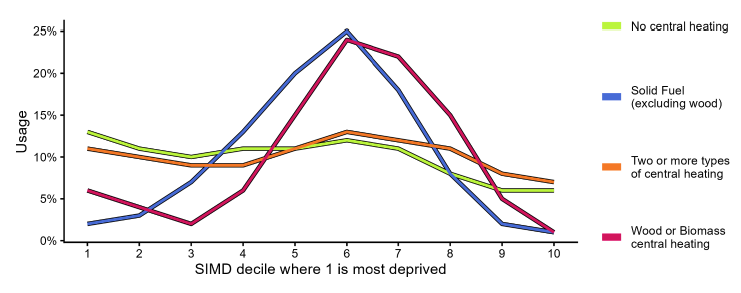
Overlaying census data on household heating systems with Index of Multiple Deprivation (IMD) at data zone level reveals several insights (as presented in Figure 9‑1): (a) Those using solid fuel (excluding wood) and wood or biomass as their central heating source predominantly reside in data zones falling in the middle deprivation deciles – deciles 4-7 for the former and 5-8 for the latter; and (b) Those using two or more types of central heating and that have no central heating (both of which are judged likely to therefore use solid fuels) are more evenly spread across the deciles. Hence it appears those using solid fuels for central heating may not necessarily be those that are most or least deprived.
Figure 9‑1: Distribution of census central heating system types across IMD deciles (rank 1 = most deprived to 10 = least deprived) – percentage of households using each central heating source falling in each decile
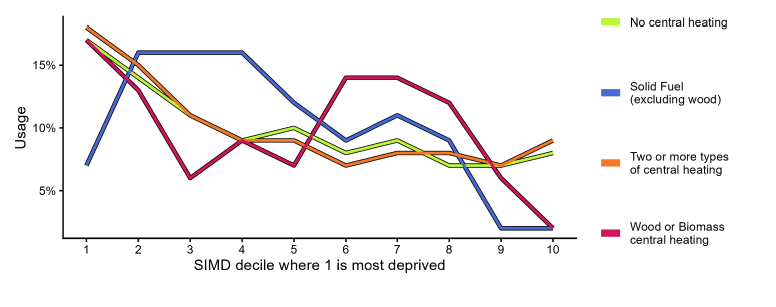
Looking only at the six most affected Local Authorities (or LAs - City of Edinburgh, Glasgow City, Fife, North Lanarkshire, Falkirk and South Lanarkshire – see Section 3), around 960 households were recorded as using solid fuel (excluding wood) as their central heating source (or 0.04%), around 1,200 (or 0.05%) as using wood or biomass, and 57,000 households as having two or more types of central heating system (or 2.3% - energy type is not defined).
Splitting by IMD reveals a mixed picture: (a) solid fuel use (excluding wood) as a central heating source is more spread across deciles (relative to nationally), but seems most concentrated in deciles 2-5; (b) wood or biomass use is also more spread across deciles, with greatest use in deciles 1-2 and 6-8; and (c) use of two types of central heating and those with no central heating are fairly evenly spread across deciles, but here is more skewed towards more deprived deciles. Although mixed, if action is taken on solid fuel burning in these six LAs, a reasonable proportion of the associated burden may fall on more deprived households.
Figure 9‑2: Distribution of census central heating system types across IMD deciles (rank 1 = most deprived to 10 = least deprived) – percentage of households using each central heating source falling in each decile – six most affected LAs
There are three important caveats to this analysis:
1) This analysis only covers central heating. As such it excludes the majority of burning, which is in supplementary appliances. The Ipsos survey covered both burning in central heating systems and supplementary burning, and their results were massively dominated by fireplaces and stoves, not central heating systems.
2) This also explains the difference in findings between the Ipsos survey (which noted that the overall volume of domestic burning is greater in urban areas because more burners live there) and the Census data (which identifies that a lower proportion of households in the six most affected, and also urban, Local Authorities use solid fuel fired central heating systems). Including all indoor burning sources (supplementary – such as stoves, fireplaces - and central heating), it is plausible for there to be more households burning in urban areas but for the proportion burning to be higher in rural areas.
3) This analysis has been performed at data zone level, and there will be variation in deprivation within a data zone, so we cannot precisely identify the level of deprivation of each specific household using solid fuel; and
4) For the analysis of households using two or more types of central heating and for those with no central heating, a proportion will and will not use solid fuel as a source for central heating.
A2 Approach to assessing uncertainty around baseline air pollution modelling
Key uncertainties in the UKCEH (2025) modelling study were identified as:
1) the proportion of UK solid fuel use allocated to Scotland, which changed substantially between successive UK-wide fuel surveys;
2) the emission factors assigned to each combination of fuel and burning appliance, where new data is based on small samples and tightly controlled burning conditions; and
3) the spatial allocation of solid fuel use within Scotland, relying on assumptions for the combinations of fuels and appliances used in rural, urban and smoke control areas.
Uncertainties in the total fuel allocation to Scotland and the emission factor values used in the UKCEH inventory have been quantified by returning to the original data sources and comparable recent datasets, such as the previous and latest NAEI releases.
In test 1, the low estimate of solid fuel allocation to Scotland used fuel use data from a 2018/19 survey, consistent with the NAEI 2021 (released 2023). The high estimate of solid fuel allocation was generated by increasing all fuel use totals from the 2022/23 survey (used in both NAEI 2023 and the UKCEH (2025) baseline inventory) by a standard 50% (based on expert judgement). The adjusted fuel use totals were used to calculate overall PM2.5 and SO2 emissions from the three modelled fuel groupings – wood, coal and manufactured solid fuel (MSF). The PWMC of primary PM2.5 for each fuel grouping was scaled by the ratio of the low or high PM2.5 emissions to the baseline. The PWMC of non-primary PM2.5 was similarly scaled using SO2 emissions as a proxy for secondary PM2.5 production. The total solid fuel contribution to PWMC was then calculated as the sum of the three fuel groups. This approach has a small inconsistency with the original modelling, where total solid fuel contributions were derived from modelling all fuels simultaneously, including some non-linear chemical interaction of secondary components. The difference in the baseline PWMC (PM2.5 from all Scottish solid fuels) is only 0.002 µg m-3 between the two approaches, suggesting that the influence of this non-linearity is minor.
In test 2, estimates of high and low PM2.5 and SO2 emission factor (EF) values were generated for individual fuel and appliance combinations, for example wood logs in a basic closed stove, by comparing equivalent values from the baseline, NAEI 2021[39], NAEI 2023[40], NAEI emission factors database[41] and EMEP/EEA guidebook[42] data where available. The NAEI emission factors database values are usually but not always consistent with the NAEI 2023 Informative Inventory Report. For some fuel-appliance combinations the factors used in the baseline inventory were the lowest, highest or only value available, in these cases default factors of 0.5 and 2.0 were used to create a lower/higher estimate. The overall PM2.5 and SO2 emissions from each fuel grouping were then calculated and PWMC values scaled in the same way as for the low/high fuel allocation scenarios.
The scaling factors for low and high fuel use scenarios are shown in Table 9‑1. Emissions from MSF show the largest relative change in the low fuel use scenario, while PM2.5 emissions from wood show the least relative change in this scenario, albeit still reduced by around a factor of two.
| Scenario | Low Scottish solid fuel allocation - PM2.5 | Low Scottish solid fuel allocation - SO2 | High Scottish solid fuel allocation - PM2.5 | High Scottish solid fuel allocation - SO2 |
|---|---|---|---|---|
| Wood | 0.489 | 0.350 | 1.5 | 1.5 |
| Coal | 0.272 | 0.242 | 1.5 | 1.5 |
| MSF | 0.130 | 0.130 | 1.5 | 1.5 |
The scaling factors for low and high emission factor scenarios are shown in Table 9‑2. The scaling factor with the largest relative change is for SO2emissions from MSF, this may be influenced by inconsistencies in the definition of MSF as including or excluding ‘smokeless’ fuels. The low estimate of SO2 emissions from wood also shows a change of more than a factor of two. For the high estimates, only the scaling factor for PM2.5 emissions from wood burning is substantially higher than the default factor of two.
| Scenario | Low emission factor - PM2.5 | Low emission factor - SO2 | High emission factor - PM2.5 | High emission factor - SO2 |
|---|---|---|---|---|
| Wood | 0.523 | 0.350 | 2.58 | 1.94 |
| Coal | 0.524 | 0.721 | 1.67 | 2.03 |
| MSF | 0.471 | 0.240 | 1.89 | 2.00 |
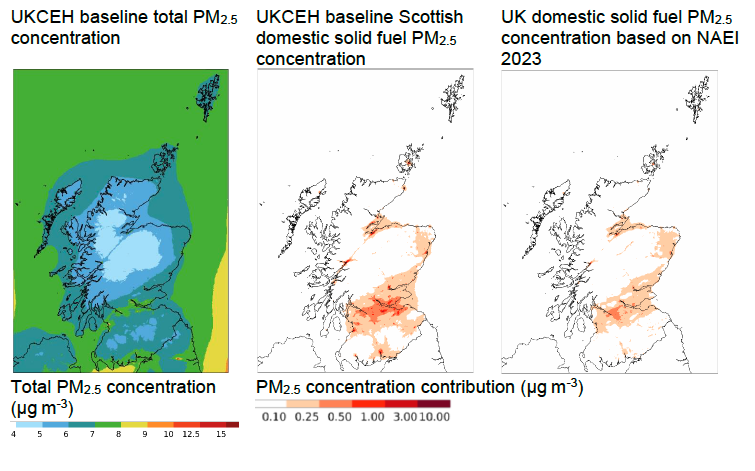
Under test 3, the NAEI 2023 emissions inventory (published 2025) was used to test the effect of a different spatial distribution of emissions, although there are also differences in total emissions from domestic solid fuel and other sectors compared to the previous UKCEH study. The EMEP4UK model was re-run with full NAEI 2023 emissions and the NAEI 2023 excluding domestic solid fuel emissions to calculate the total and solid fuel burning PWMC values for this scenario. Maps of the PM2.5 concentration contribution modelled based on baseline Scottish or NAEI 2023 UK domestic solid fuel emissions are shown in Figure 9‑3 alongside total baseline PM2.5 concentrations. The PM2.5 concentrations due to Scottish domestic burning modelled based on the NAEI 2023 are generally lower than those based on the UKCEH inventory, especially in peak areas.
Figure 9‑3: Maps of baseline annual average PM2.5 concentration modelled with the EMEP4UK model based on the UKCEH (2025) inventory from all sources (left), baseline Scottish domestic solid fuel contributions (centre) and based on the NAEI 2023 UK domestic solid fuel contributions (right).
A3 Quantification of baseline health effects
Additional tables
| Pathway | Chronic exposure | Chronic exposure | RHA | IHD | Stroke | Lung cancer | Asthma (Older Children) | WDL | WDL (Care) | WDL (vol) | mRADs | All |
|---|---|---|---|---|---|---|---|---|---|---|---|---|
| Metric | #Deaths | Life years lost | #admissions | #cases | #cases | #cases | #cases | #WDL | #care hours | #vol. hours | #WDL due to mRAD | Monetised effects (£m) |
| Aberdeen City | 3.5 | 39 | 0.9 | 0.5 | 0.6 | 0.3 | 0.8 | 413 | 111 | 47 | 143 | 2.6 |
| Aberdeenshire | 3.8 | 43 | 0.9 | 0.5 | 0.6 | 0.3 | 1.0 | 411 | 111 | 46 | 142 | 2.8 |
| Angus | 2.1 | 24 | 0.5 | 0.3 | 0.3 | 0.2 | 0.5 | 224 | 60 | 25 | 77 | 1.5 |
| Argyll and Bute | 1.1 | 13 | 0.2 | 0.1 | 0.2 | 0.1 | 0.2 | 119 | 32 | 13 | 41 | 0.8 |
| City of Edinburgh | 22.3 | 252 | 5.6 | 3.4 | 4.1 | 2.0 | 4.9 | 2792 | 752 | 315 | 964 | 16.3 |
| Clackmannanshire | 3.1 | 36 | 0.7 | 0.4 | 0.5 | 0.3 | 0.7 | 346 | 93 | 39 | 119 | 2.3 |
| Dumfries and Galloway | 1.9 | 22 | 0.4 | 0.3 | 0.3 | 0.1 | 0.4 | 205 | 55 | 23 | 71 | 1.3 |
| Dundee City | 2.9 | 33 | 0.7 | 0.4 | 0.5 | 0.3 | 0.7 | 356 | 96 | 40 | 123 | 2.2 |
| East Ayrshire | 3.0 | 34 | 0.7 | 0.4 | 0.5 | 0.2 | 0.7 | 324 | 87 | 37 | 112 | 2.1 |
| East Dunbartonshire | 4.7 | 53 | 1.1 | 0.6 | 0.8 | 0.4 | 1.2 | 502 | 135 | 57 | 173 | 3.4 |
| East Lothian | 3.0 | 34 | 0.7 | 0.4 | 0.5 | 0.2 | 0.7 | 327 | 88 | 37 | 113 | 2.2 |
| East Renfrewshire | 2.0 | 23 | 0.5 | 0.3 | 0.3 | 0.2 | 0.6 | 223 | 60 | 25 | 77 | 1.6 |
| Falkirk | 13.4 | 152 | 3.1 | 1.9 | 2.2 | 1.1 | 3.2 | 1485 | 400 | 168 | 513 | 9.8 |
| Fife | 16.4 | 185 | 3.8 | 2.3 | 2.7 | 1.3 | 3.9 | 1839 | 495 | 208 | 635 | 11.9 |
| Glasgow City | 18.5 | 210 | 4.8 | 2.9 | 3.5 | 1.7 | 4.3 | 2374 | 639 | 268 | 819 | 13.8 |
| Highland | 2.7 | 30 | 0.6 | 0.4 | 0.4 | 0.2 | 0.6 | 285 | 77 | 32 | 98 | 1.9 |
| Inverclyde | 1.3 | 15 | 0.3 | 0.2 | 0.2 | 0.1 | 0.3 | 147 | 39 | 17 | 51 | 1.0 |
| Midlothian | 1.8 | 21 | 0.4 | 0.3 | 0.3 | 0.2 | 0.5 | 200 | 54 | 23 | 69 | 1.4 |
| Moray | 0.8 | 9 | 0.2 | 0.1 | 0.1 | 0.1 | 0.2 | 87 | 23 | 10 | 30 | 0.6 |
| Na h-Eileanan an Iar | 0.1 | 1 | 0.0 | 0.0 | 0.0 | 0.0 | 0.0 | 11 | 3 | 1 | 4 | 0.1 |
| North Ayrshire | 3.3 | 37 | 0.7 | 0.4 | 0.5 | 0.3 | 0.7 | 357 | 96 | 40 | 123 | 2.3 |
| North Lanarkshire | 14.8 | 168 | 3.5 | 2.1 | 2.5 | 1.2 | 3.7 | 1678 | 452 | 189 | 579 | 11.0 |
| Orkney Islands | 0.2 | 2 | 0.0 | 0.0 | 0.0 | 0.0 | 0.0 | 17 | 5 | 2 | 6 | 0.1 |
| Perth and Kinross | 4.0 | 45 | 0.9 | 0.5 | 0.6 | 0.3 | 0.9 | 429 | 116 | 48 | 148 | 2.8 |
| Renfrewshire | 5.0 | 57 | 1.2 | 0.7 | 0.8 | 0.4 | 1.1 | 560 | 151 | 63 | 193 | 3.6 |
| Scottish Borders | 1.6 | 18 | 0.3 | 0.2 | 0.3 | 0.1 | 0.3 | 171 | 46 | 19 | 59 | 1.1 |
| Shetland Islands | 0.0 | 0 | 0.0 | 0.0 | 0.0 | 0.0 | 0.0 | 3 | 1 | 0 | 1 | 0.0 |
| South Ayrshire | 2.7 | 30 | 0.6 | 0.4 | 0.4 | 0.2 | 0.6 | 286 | 77 | 32 | 99 | 1.9 |
| South Lanarkshire | 8.1 | 92 | 1.9 | 1.1 | 1.3 | 0.7 | 1.9 | 896 | 241 | 101 | 309 | 5.9 |
| Stirling | 3.6 | 40 | 0.9 | 0.5 | 0.6 | 0.3 | 0.9 | 418 | 113 | 47 | 144 | 2.6 |
| West Dunbartonshire | 3.4 | 38 | 0.8 | 0.5 | 0.6 | 0.3 | 0.8 | 377 | 102 | 43 | 130 | 2.5 |
| West Lothian | 5.1 | 58 | 1.2 | 0.7 | 0.9 | 0.4 | 1.4 | 567 | 153 | 64 | 196 | 3.5 |
| Pathway | Large Urban Areas | Other Urban Areas | Accessible Rural | Accessible Small Towns | Remote Rural | Remote Small Towns |
|---|---|---|---|---|---|---|
| Chronic exposure - #Deaths | 67.4 | 60.1 | 15.6 | 12.6 | 2.6 | 1.8 |
| Chronic exposure - Life years lost | 764 | 681 | 177 | 143 | 29 | 20 |
| RHA - #admissions | 16.0 | 14.2 | 3.7 | 3.0 | 0.6 | 0.4 |
| IHD - #cases | 9.7 | 8.6 | 2.2 | 1.8 | 0.4 | 0.3 |
| Stroke - #cases | 11.6 | 10.3 | 2.7 | 2.2 | 0.4 | 0.3 |
| Lung cancer - #cases | 5.6 | 5.0 | 1.3 | 1.1 | 0.2 | 0.1 |
| Asthma (Older Children) - #cases | 15.9 | 14.2 | 3.7 | 3.0 | 0.6 | 0.4 |
| WDL - #WDL | 7,759 | 6,914 | 1,796 | 1,456 | 299 | 204 |
| WDL (Care) - #care hours | 2,090 | 1,862 | 484 | 392 | 81 | 55 |
| WDL (vol) - #vol. hours | 876 | 780 | 203 | 164 | 34 | 23 |
| mRADs - #WDL due to mRAD | 2,678 | 2,386 | 620 | 502 | 103 | 70 |
| Pathway | Central | Low Fuel allocation | High Fuel allocation | Low Emission Factors | High Emission Factors | EMEP modelling based on NAEI 2023 emissions |
|---|---|---|---|---|---|---|
| Chronic exposure - #Deaths | 160 | 46 | 239 | 75 | 331 | 98 |
| Chronic exposure - Life years lost | 1,814 | 525 | 2,703 | 854 | 3,749 | 1,106 |
| RHA - #admissions | 38 | 11 | 57 | 18 | 78 | 23 |
| IHD - #cases | 23 | 7 | 34 | 11 | 47 | 14 |
| Stroke - #cases | 27 | 8 | 41 | 13 | 57 | 17 |
| Lung cancer - #cases | 13 | 4 | 20 | 6 | 28 | 8 |
| Asthma (Older Children) - #cases | 38 | 11 | 56 | 18 | 78 | 23 |
| WDL - #WDL | 18,428 | 5,338 | 27,462 | 8,675 | 38,088 | 11,242 |
| WDL (Care) - #care hours | 4,964 | 1,438 | 7,397 | 2,337 | 10,259 | 3,028 |
| WDL (vol) - #vol. hours | 2,080 | 602 | 3,099 | 979 | 4,298 | 1,269 |
| mRADs - #WDL due to mRAD | 6,360 | 1,842 | 9,478 | 2,994 | 13,145 | 3,880 |
| Pathway | Low | Centra | High |
|---|---|---|---|
| Chronic exposure - #Deaths | 121 | 160 | 179 |
| Chronic exposure - Life years lost | 1,375 | 1,814 | 2,030 |
| RHA - #admissions | -25 | 38 | 101 |
| IHD - #cases | -3 | 23 | 50 |
| Stroke - #cases | -3 | 27 | 58 |
| Lung cancer - #cases | 6 | 13 | 20 |
| Asthma (Older Children) - #cases | 19 | 38 | 64 |
| WDL - #WDL | 15,682 | 18,428 | 21,154 |
| WDL (Care) - #care hours | 4,224 | 4,964 | 5,698 |
| WDL (vol) - #vol. hours | 1,770 | 2,080 | 2,387 |
| mRADs - #WDL due to mRAD | 5,698 | 6,360 | 7,149 |
| Pathway | CVA #adm. | Chronic Bronchitis#cases | Diabetes#cases | SDL #WDL due to SDL |
|---|---|---|---|---|
| Scottish all solid fuel | 20 | 3,346 | 108 | 1,082 |
| Scottish wood | 7 | 1,202 | 39 | 389 |
| Scottish coal | 6 | 969 | 31 | 313 |
| Scottish MSF | 7 | 1,156 | 37 | 374 |
| Non-Scottish solid fuel | 5 | 820 | 26 | 265 |
| All sources | 390 | 66,276 | 2,133 | 21,431 |
Concentration response functions
| Analysis | Pathway | CRF | Short-term / long-term exposure | Source |
|---|---|---|---|---|
| Central | Mortality chronic exposure | 1.08 (1.06 – 1.09) | Long-term – annual average | COMEAP (2023) - Summary of COMEAP recommendations for the quantification of health effects associated with air pollutants[43] |
| Central | RHA | 1.0096 (0.9937 – 1.0258) | Short-term – daily mean | COMEAP (2023) - Summary of COMEAP recommendations for the quantification of health effects associated with air pollutants[44] |
| Central | IHD | 1.07 (0.99 – 1.16) | Long-term – annual average | COMEAP (2023) - Summary of COMEAP recommendations for the quantification of health effects associated with air pollutants[45] |
| Central | Stroke | 1.11 (0.99 – 1.25) | Long-term – annual average | COMEAP (2023) - Summary of COMEAP recommendations for the quantification of health effects associated with air pollutants[46] |
| Central | Lung cancer | 1.09 (1.04 – 1.14) | Long-term – annual average | Hamra GB et al (2015) Lung Cancer and Exposure to Nitrogen Dioxide and Traffic: A Systematic Review and Meta-Analysis[47] |
| Central | Asthma (Older Children)* | 1.48 (1.22 – 1.97) | Long-term – annual average | Khreis H, et al (2017) Exposure to traffic-related air pollution and risk of development of childhood asthma: A systematic review and meta-analysis[48] |
| Central | WDL (also for care and volunteer effects) | 1.046 (1.039 – 1.053) | Short-term – daily mean | Ostro B (1987): ‘Air pollution and morbidity revisited: a specification test’; J.Environ. Economics and Management. 1987; 14:87-98 |
| Central | mRADs | 1.047 (1.042 – 1.053) | Short-term – daily mean | Ostro B, Rothschild S (1989): ‘Air pollution and acute respiratory morbidity: an observational study of multiple pollutants’; Environ Res. 1989 Dec;50(2):238-47. |
| Sensitivity | CVA** | 1.009 (1.0026 – 1.0153) | Short-term – daily mean | COMEAP (2023) |
| Sensitivity | Chronic Bronchitis* | 1.32 (1.02 – 1.71) | Long-term – annual average | COMEAP (2023) |
| Sensitivity | Diabetes | 1.10 (1.02 – 1.18) | Long-term – annual average | Eze IC, et al. (2015) Association between ambient air pollution and diabetes mellitus in Europe and North America: systematic review and meta-analysis[49] |
| Sensitivity | SDL | 1.04 (1.025 – 1.064) | Short-term – daily mean | Ransom, M. and C. Pope (1992): ‘Elementary school absences and PM10 pollution in Utah Valley’; Environ Res. 1992 Aug;58(2):204-19. |
| HRAPIE-2 | Mortality chronic exposure | 1.095 (1.06 – 1.13) | Long-term – annual average | WHO (2025) - Health risks of air pollutionin Europe: HRAPIE-2 project [50] |
| HRAPIE-2 | COPD | 1.18 (1.13 – 1.23) | Long-term – annual average | WHO (2025) - Health risks of air pollutionin Europe: HRAPIE-2 project50 |
| HRAPIE-2 | Acute myocardial infarctions (IHD events | 1.13 (1.05 – 1.22) | Long-term – annual average | WHO (2025) - Health risks of air pollutionin Europe: HRAPIE-2 project50 |
| HRAPIE-2 | Stroke | 1.16 (1.12 – 1.2) | Long-term – annual average | WHO (2025) - Health risks of air pollutionin Europe: HRAPIE-2 project50 |
| HRAPIE-2 | Lung cancer | 1.16 (1.1 – 1.23) | Long-term – annual average | WHO (2025) - Health risks of air pollutionin Europe: HRAPIE-2 project50 |
| HRAPIE-2 | Asthma (all Children) | 1.34 (1.1 – 1.63) | Long-term – annual average | WHO (2025) - Health risks of air pollutionin Europe: HRAPIE-2 project50 |
Notes: * denotes CRFs expressed as Odds Ratio (rather than relative risk); **denotes pathways and CRFs common to HRAPIE-2
Comparison to other estimates
The estimation of health effects in this study focuses on exposure to air pollution from domestic solid fuel burning. For illustration, applying the same data and approach to analyse the mortality effects of exposure to PM2.5 from all sources produces an estimated 3,170 deaths and 35,900 life years lost each year.
This estimate is higher than the mortality effects presented in a report published by UKHSA in 2022[51], which estimated attributable deaths per year for Scotland associated with exposure to PM2.5 from all sources of 2,382 deaths. The key source of difference is the population-weighted annual mean concentrations of PM2.5 used in the analyses: UKHSA (2022) adopted a value of 5.5 µg m-3 taken from UK AIR Modelled background pollution data for 2019[52], whereas this study adopted a value of 7.11 µg m-3 taken from the preceding study by UKCEH on ‘The contribution of indoor domestic solid fuel burning to Scotland’s air pollution’ (UKCEH, 2025).
A full diagnostic comparison of the two estimates has not been undertaken as part of this study, however an initial exploration of the reason for the differences between the two estimates has been carried out. This found that the modelled annual average PM2.5 concentrations from UKCEH (2025) show a high bias relative to the 8 AURN PM2.5 monitoring sites in Scotland of around 2.6 µg m-3. The UKCEH (2025) modelling used EMEP version 5.5 which was newly released at the time of the study. The change in PM2.5 performance compared to the previous version (5.0), which had generally very small mean bias in PM2.5, was not identified at the time of the study as directly comparable model runs from both versions were not available. The difference between the model versions relates to how particle bound water is calculated, mainly associated with secondary inorganic aerosols. This means that the calculation of primary solid fuel burning contributions is unaffected, but the secondary contributions may be slightly high. The model performance for the solid fuel burning components of PM2.5, which were the focus of UKCEH (2025), was evaluated relative to campaign and routine black carbon measurements with generally good results.
In addition to the bias in total concentration, there may be a difference in the method for calculating population-weighted mean concentration from the spatial concentrations between the UK AIR data and UKCEH (2025). From the UK AIR website, concentrations are aggregated to Local Authority areas before being combined with population data. This is likely to underestimate population-weighted mean by neglecting co-location of higher concentrations with higher population density within heterogeneous Local Authority areas.
A4 Notes on approach to spatial and demographic exposure analysis
Mapped PM2.5 concentrations associated with solid fuel burning were taken from UKCEH (2025) at a 1 km x 1 km resolution, the PM2.5 concentrations refer to modelled values of particulate matter with aerodynamic diameter < 2.5 μm, with particle water at 50 % relative humidity. Shapefiles for the locations of the Scottish Data Zones were overlaid on the maps, and the mean concentration within each Data Zone was calculated using the extract package for R. The 2022 iteration of the data zones was used wherever possible, but in cases where the demographic data was associated with the 2011 data zones, these were used.
Population weighted mean concentrations (PWMC) were calculated by multiplying the mean concentrations for each relevant data zone by its population, then dividing this by the total population of all the relevant data zones. This calculation was based on the 2022 data zones and population estimates. This is shown in Equation 4.1.
Equation 4.1: Population weighting formula, n is equal to the total number of relevant data zones

To explore trends between urban and rural areas, the 6 fold iteration of the Urban Rural classification was used[53], which is based on the 2011 data zones, and therefore these were used for the analysis. The 6 fold iteration was chosen as there were distinctions in concentration patterns between areas that are classified together under the three fold categorisation. The 8 fold classification was not used as it reduces the sample size for analysis of IMD decile below practical values. A map of Urban Rural areas based on the 6 fold iteration is presented in the Figure below.
Figure 9‑4: Map of Urban Rural classification areas (based on 6 fold iteration of the Urban Rural classification)
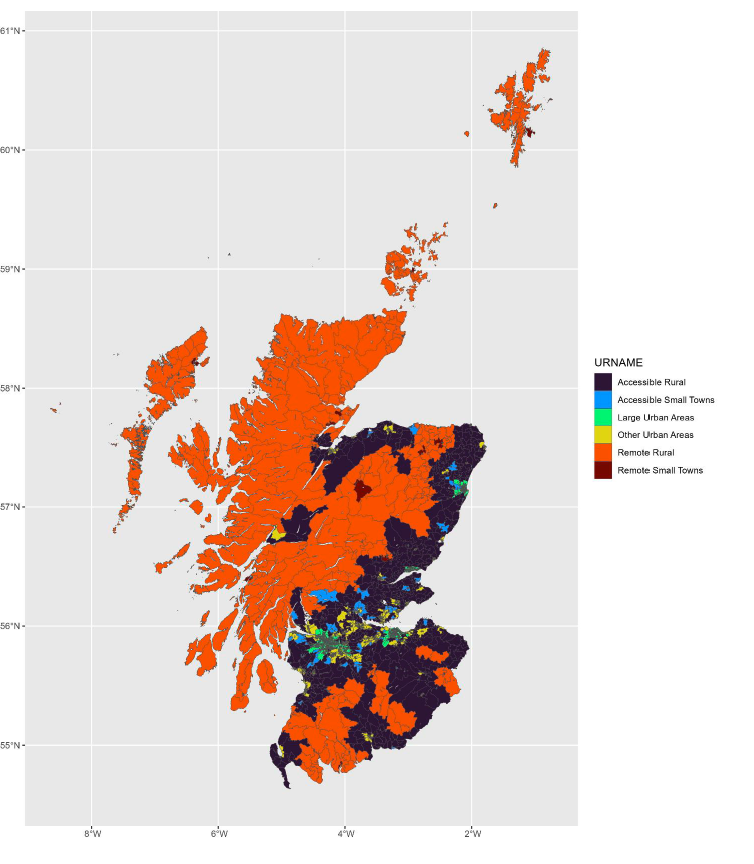
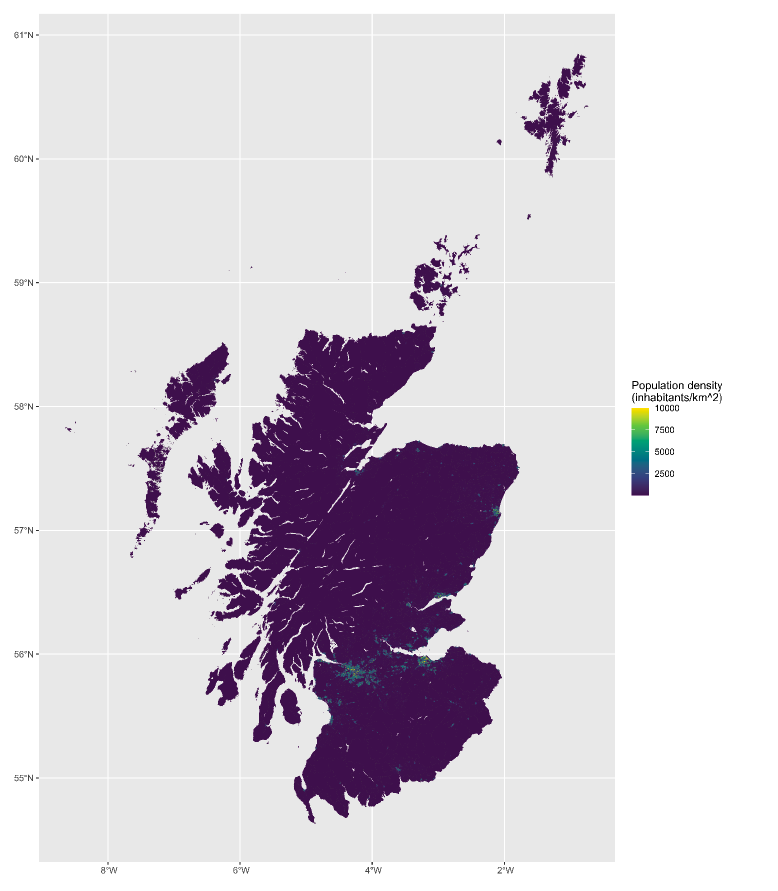
Figure 9‑5: Map of population density
A5 Approach to assessing domestic solid fuel burning policy scenarios
Policy 1 (Burn less) was assumed to reduce all solid fuel burning by 1%, with uniform impact across all fuels and areas. This allows direct scaling of emissions and concentrations from Scottish sources by the change in fuel use.
Policy 2 (Burn Better) was assumed to prompt changes away from the most polluting solid fuels, in particular from wet wood to dry wood and from house coal, lignite, peat and non-smokeless MSF to smokeless MSF. This leads to reductions in PM2.5 from all fuel types and SO2 from MSF, but little change in SO2 from wood and an increase in SO2 emissions from former coal burners. The scaling factors used to represent policies 1 and 2 are shown in Table 9‑9.
| Scenario | Policy 1: Health information (burn less) - PM2.5 | Policy 1: Health information (burn less) - SO2 | Policy 2: Fuel quality upgrades (burn better) - PM2.5 | Policy 2: Fuel quality upgrades (burn better) - SO2 |
|---|---|---|---|---|
| Wood | 0.99 | 0.99 | 0.79 | 1.01 |
| Coal | 0.99 | 0.99 | 0.72 | 2.77 |
| MSF | 0.99 | 0.99 | 0.77 | 0.72 |
Policy 3 (targeted stock upgrades) modelled the upgrade of all open fireplaces and ‘old’ stoves to modern stoves (at least Ecodesign standard), within six targeted local authorities (highlighted in Table 9‑12).
The calculated changes of emissions by fuel and area types due to the change of burning appliances within these Local Authorities are shown in Table 9‑10. For wood, all emission factors were changed to the measured values for seasoned wood in a modern stove. Stoves with lower emission rates are available in continental Europe (e.g. Blue Angel standard) but not yet in the UK. Blue Angel stoves are considerably more complex than the Ecodesign standard, including automatic air control and emissions control technologies (electrostatic precipitator and catalytic converter).
For MSF, there is substantial uncertainty in the emission factor variations with stove age from the recent EFSDF dataset, so MSF emissions were kept unchanged for this policy scenario.
Emissions of all pollutants from wood burning as well as PM2.5 and VOC from coal burning were reduced by this policy, whereas both NOX and SO2 emissions from coal burning were increased.
This modelling does not account for any changes in the fuel quantity used by households with upgraded burning appliances if the new appliance is more efficient, only due to changes of calorific value of the fuel where this also changes.
| Policy 3: Targeted stove upgrades fuel type | Area type | Scaling factor for NOX | Scaling factor for VOC | Scaling factor for PM2.5 | Scaling factor for SO2 |
|---|---|---|---|---|---|
| Wood | Urban SCA | 0.92 | 0.80 | 0.86 | 0.73 |
| Wood | Urban non-SCA | 0.91 | 0.88 | 0.90 | 0.51 |
| Wood | Rural | 0.94 | 0.95 | 0.94 | 0.75 |
| Coal | Urban SCA | 1.07 | 0.35 | 0.78 | 1.09 |
| Coal | Urban non-SCA | 1.06 | 0.37 | 0.79 | 1.11 |
| Coal | Rural | 1.10 | 0.34 | 0.79 | 1.07 |
| MSF | All | 1.00 | 1.00 | 1.00 | 1.00 |
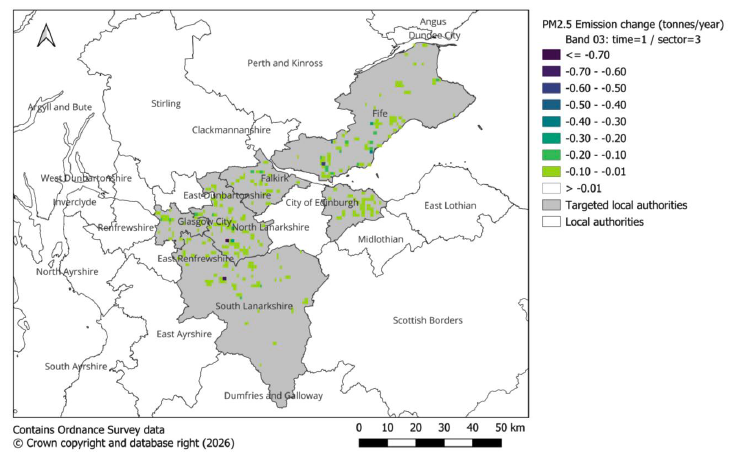
The PM2.5 emission changes calculated for the modelling of Policy 3 are mapped in Figure 9‑6. The largest primary emission reductions (darkest colours) are concentrated in small areas of South Lanarkshire, North Lanarkshire and Fife.
Figure 9‑6: Map of PM2.5 emission changes for policy 3, targeted local authorities shaded in grey.
PWMC values for primary PM2.5 are presented in Table 9‑11 and for secondary PM2.5 in Table 9‑12. These show reductions in primary PM2.5 from all policy scenarios but increases in secondary PM2.5 from former coal burners switching to MSF in policy 2.
| Scenario | Population-weighted mean concentration (PWMC) of primary PM2.5 (µg m-3) - Wood | (PWMC) of primary PM2.5 (µg m-3) - Coal | (PWMC) of primary PM2.5 (µg m-3) - MSF | (PWMC) of primary PM2.5 (µg m-3) - Total Solid Fuel | (PWMC) of primary PM2.5 (µg m-3) - Total |
|---|---|---|---|---|---|
| UKCEH baseline | 0.108 | 0.079 | 0.068 | 0.255 | 1.19 |
| Policy scenario 1 (burn less) | 0.107 | 0.078 | 0.067 | 0.252 | 1.19 |
| Policy scenario 2 (burn better) | 0.085 | 0.057 | 0.052 | 0.195 | 1.13 |
| Policy scenario 3 (targeted stove upgrades) | - | - | - | 0.246 | 1.18 |
| Scenario | Population-weighted mean concentration (PWMC) of secondary PM2.5 (µg m-3) - Wood | PWMC of secondary PM2.5 (µg m-3) – Coal | PWMC of secondary PM2.5 (µg m-3) - MSF | PWMC of secondary PM2.5 (µg m-3) – Total Solid Fuel | PWMC of secondary PM2.5 (µg m-3) - Total |
|---|---|---|---|---|---|
| UKCEH baseline | 0.021 | 0.025 | 0.056 | 0.102 | 5.92 |
| Policy scenario 1 (burn less) | 0.021 | 0.025 | 0.055 | 0.101 | 5.92 |
| Policy scenario 2 (burn better) | 0.021 | 0.069 | 0.040 | 0.131 | 5.95 |
| Policy scenario 3 (targeted stove upgrades) | - | - | - | 0.102 | 5.92 |
Spatial statistics for primary and total PM2.5 concentrations, from baseline, Policy 2 and Policy 3 scenarios are shown in Table 9‑13. The maximum primary and total PM2.5 concentrations from Scottish solid fuel burning are reduced substantially by Policy 2 compared to baseline, while Policy 3 has small impacts across all statistics. This may be because the maximum baseline PM2.5 concentrations from solid fuel burning are associated with MSF, which was unchanged in Policy 3.
| Species | Metric | Baseline: All sources | Baseline: Scottish SF | Policy 2: All sources | Policy 2: Scottish SF | Policy 3: All sources | Policy 3: Scottish SF |
|---|---|---|---|---|---|---|---|
| Primary PM2.5 | Mean | 0.404 | 0.056 | 0.391 | 0.043 | 0.403 | 0.055 |
| Primary PM2.5 | PWMC | 1.19 | 0.255 | 1.13 | 0.194 | 1.18 | 0.246 |
| Primary PM2.5 | Median | 0.313 | 0.031 | 0.305 | 0.023 | 0.313 | 0.030 |
| Primary PM2.5 | Min | 0.140 | 0.003 | 0.139 | 0.003 | 0.140 | 0.003 |
| Primary PM2.5 | Max | 11.0 | 3.59 | 11.0 | 2.79 | 11.0 | 3.58 |
| Total PM2.5 | Mean | 5.84 | 0.086 | 5.83 | 0.081 | 5.84 | 0.085 |
| Total PM2.5 | PWMC | 7.11 | 0.359 | 7.08 | 0.326* | 7.10 | 0.348 |
| Total PM2.5 | Median | 5.82 | 0.053 | 5.82 | 0.050 | 5.82 | 0.052 |
| Total PM2.5 | Min | 4.32 | 0.003 | 4.32 | 0.003 | 4.32 | 0.003 |
| Total PM2.5 | Max | 17.4 | 5.76 | 17.4 | 4.43 | 17.4 | 5.75 |
*PWMC for Policy 2 was recalculated from the full spatial distribution of scaled concentrations for this table, with a very small change relative to the value calculated by scaling and summing individual fuel PWMC values as given in Table 6‑1 (0.325).
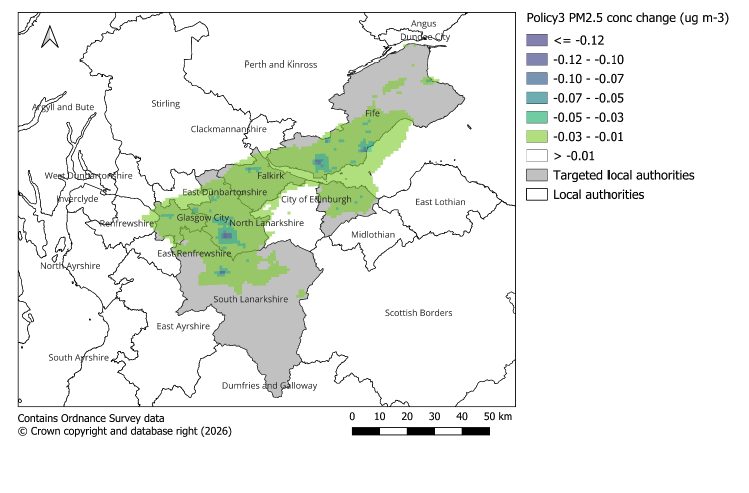
Maps of primary and total PM2.5 domestic solid fuel concentration contributions from baseline, Policy 2 and Policy 3 scenarios are shown in Figure 9‑7. The extent of primary PM2.5 concentrations due to solid fuel burning >0.1 μg m‑3 is visibly smaller from Policy 2 than baseline, but differences in total PM2.5 are more difficult to identify. Changes in PM2.5 concentrations from solid fuel burning in Policy 2 and 3 compared to baseline for the whole of Scotland are shown in Figure 9‑8. Policy 2 leads to visible patches of concentration reductions in many minor urban areas. More detailed maps of PM2.5 concentration changes focusing on the Local Authorities targeted in Policy 3 are shown in Figure 9‑9 for Policy 2 and Figure 9‑10 for Policy 3. The maximum concentration change from Policy 2 is ten times greater than from Policy 3. Small concentration reductions from Policy 2 are widespread across southern Scotland, while the largest reductions occur in small areas of West Lothian and Fife. The small concentration reductions from Policy 3 largely occur within the targeted Local Authorities, with some spread into neighbouring authorities, including East Dunbartonshire, West Lothian, Stirling and Clackmannanshire.
Figure 9‑7: Maps of total PM2.5 concentration (all sources), primary and total PM2.5 concentration contributions from Scottish solid fuel burning, for baseline, policy 2 and policy 3 scenarios
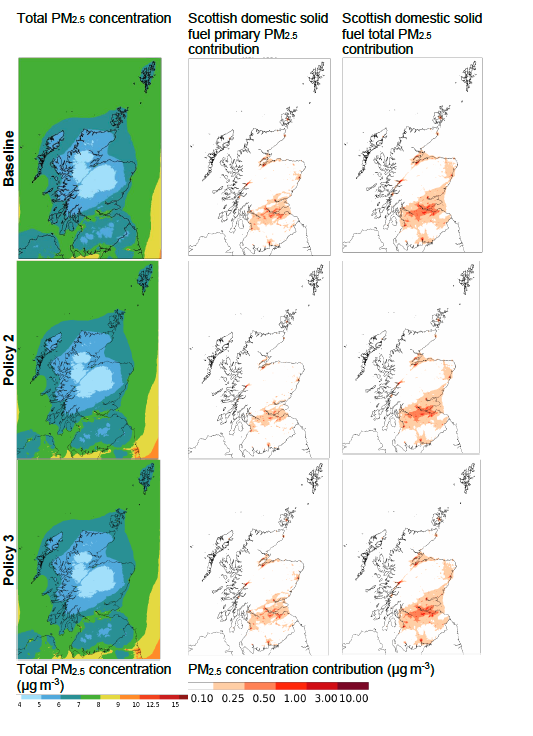
Figure 9‑8: Maps of PM2.5 concentration change from policy 2 and policy 3 scenarios compared to baseline.
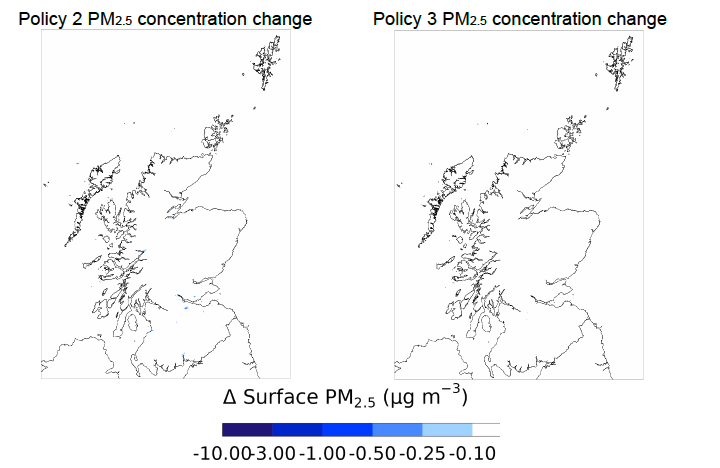
Figure 9‑9: Detailed map of PM2.5 concentration change from policy 2 in and near local authorities targeted in policy 3.
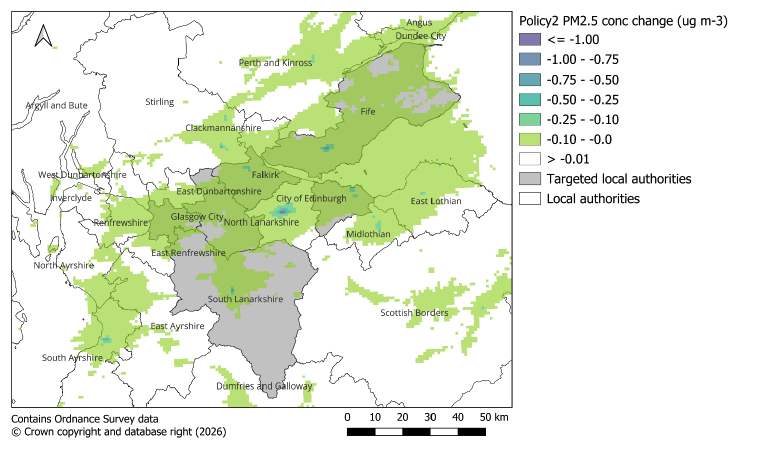
Figure 9‑10: Detailed map of PM2.5 concentration change from Policy 3 in and near Local Authorities targeted in Policy 3, note different colour scale from Policy 2 map.