Domestic solid fuel burning - effects of PM2.5 on health outcomes: evaluation
This study assesses the potential health benefits of further policy actions affecting domestic solid fuel burning in Scotland. Three options were taken forward for more detailed modelling: burn less; burn better; and targeted stock upgrades.
4 Spatial and demographic exposure patterns
Spatially resolved concentration data taken from UKCEH (2025) was plotted against Scottish data zones, enabling analysis of geographic and demographic patterns based on data linked to each data zone. This enabled analysis of concentrations by Local Authority and socioeconomic deprivation. Statistics used in this section are associated with the 2012 data zones, as this is the format used in the 2020 Scottish Index of Multiple Deprivation (SIMD). Further notes on the approach are presented in Appendix 4.
4.1 Variation between Local Authority areas
There is significant variation in the average concentrations associated with solid fuel burning within each Local Authority area. The six LAs with the highest population-weighted concentrations of PM2.5 associated with solid fuel burning are Falkirk, Clackmannanshire, City of Edinburgh, North Lanarkshire, Fife and South Lanarkshire. Falkirk has the highest concentrations associated with solid fuel burning, driven by the highest proportion of MSF burning in any Local Authority (60% of total solid fuel PM2.5 concentrations). Three of the six LAs with the highest PM2.5 concentrations associated with solid fuel burning (Falkirk, Clackmannanshire and Fife), also have the top three highest share of PM2.5 from MSF burning (60%, 36% and 34% respectively).
Figure 4‑1: Average concentrations of PM2.5 associated with solid fuel burning for each Scottish Local Authority
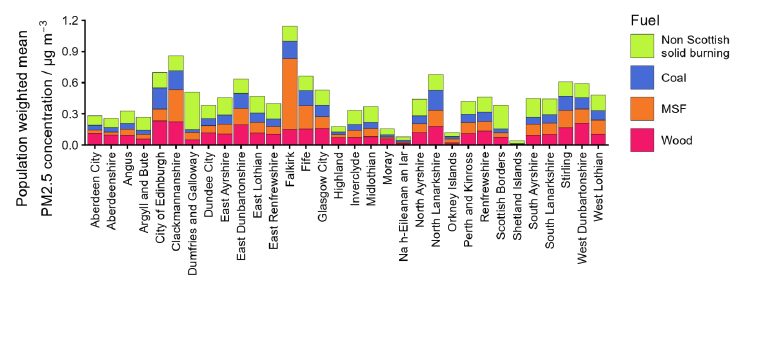
Figure 4‑2: Percentage contributions of each fuel to Scottish PM2.5 concentrations from solid fuel burning - Scottish Local Authority
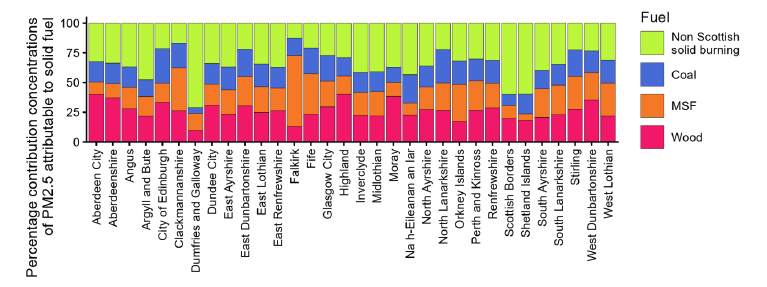
The Scottish Borders and Dumfries and Galloway have the highest concentrations associated with non-Scottish UK solid fuel burning, consistent with their geographic positions next to the border with England, while western parts of Dumfries and Galloway may also be influenced by solid fuel burning in Northern Ireland.
4.2 Variation between urban and rural areas
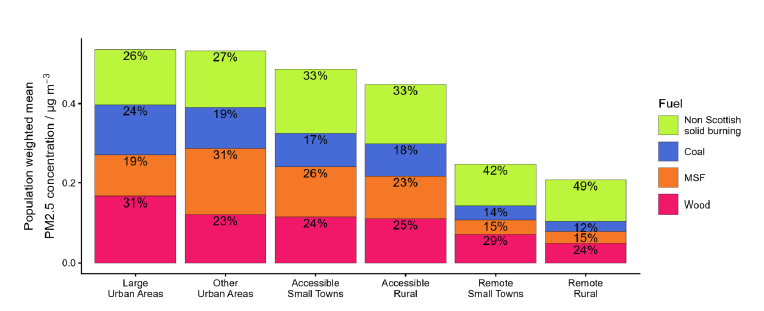
To explore trends between urban and rural areas, the 6 fold iteration of the Urban Rural classification was used[26]. Whilst ‘large urban areas’ and ‘other urban areas’ have the highest and also similar total PM2.5 concentrations, wood burning forms a greater proportion of this in ‘large urban areas’, with MSF and coal being more prevalent in ‘other’ urban areas. ‘Large urban areas’ may be more likely to have smoke control areas than ‘other urban areas’, which will influence the allocation of fuels in the emissions calculations. ‘Remote rural areas’ and ‘remote small towns’ have the lowest population-weighted PM2.5 concentrations associated with all solid fuel burning. They have the lowest absolute concentrations associated with non-Scottish solid fuel burning, but this forms a greater proportion of the total PM2.5 associated with solid fuel burning. ‘Accessible rural areas’ and ‘accessible small towns’ have concentrations associated with solid fuel lower than ‘urban’ areas and higher than ‘remote’ areas. The total concentrations associated with solid fuel burning in accessible areas are more similar to urban areas than remote areas - this may partly reflect atmospheric transport of emissions from urban areas to nearby ‘accessible’ areas as well as population density.
Figure 4‑3: Average concentrations of PM2.5 associated with solid fuel burning for each urban rural classification
4.3 Scottish Index of Multiple Deprivation (SIMD) and protected characteristics
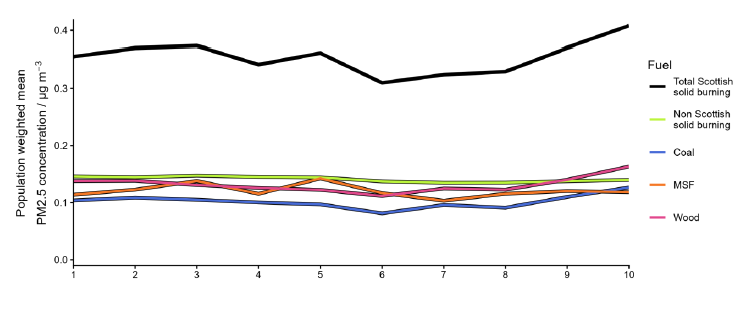
The total contributions attributable to solid fuel were plotted for each SIMD[27] deprivation decile (see Figure 4‑4). This showed an irregular pattern, with deciles 10 and 9 experiencing the highest concentrations, but deciles 6, 7 and 8 experiencing lower concentrations than deciles 1-5). Across all the deciles, the difference in concentrations associated with solid burning was very small.
Figure 4‑4: Average concentrations of PM2.5 associated with solid fuel burning for SIMD decile
Variation in exposure to air pollution from solid fuel across the protected characteristics of age, disability and ethnic group was also investigated, in this case using 2011 census data as it uses the same data zones as the SIMD 2020, enabling direct linking of the data.
Different ethnic groups in Scotland experienced different concentrations of PM2.5 associated with solid fuel burning (see Figure 4‑5). The broad classification of White experienced the lowest average concentrations at all deprivation deciles, except: 8, 9 and 10, where African, African Scottish, African British, Caribbean or Black individuals experienced lower concentrations; and decile 2 where those from mixed or multiple ethnic groups experienced marginally lower concentrations. The disparity was lowest in the least deprived deciles, and highest in deciles with medium deprivation. Disability had little discernible difference in PM2.5 exposure associated with solid burning at place of residence (see Figure 4‑6), with those facing no limitations, some limitations and severe limitations to their day to day activities as a result of disability experiencing similar levels in all deprivation deciles.
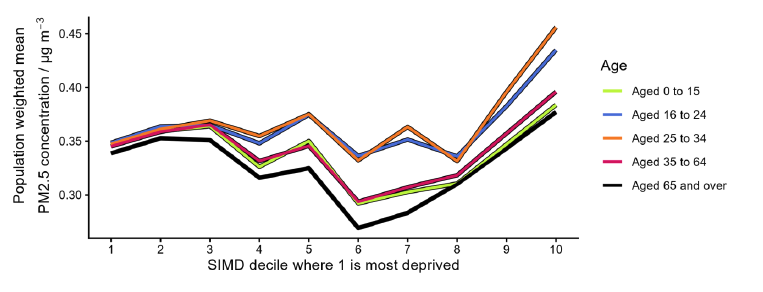
Different age groups did experience different exposure to PM2.5 associated with solid fuel burning in Scotland (see Figure 4‑7), with three clear groupings of exposure: The lowest average concentrations are experienced by the over 65s, and the highest are experienced by those aged 16 to 34, with under 16s and those aged 35 to 64 experiencing similar emissions in the middle of younger adults and the elderly. This effect is least pronounced in the most deprived deciles, and largest in deciles 6 and 7.
Figure 4‑5: Average concentrations of PM2.5 associated with solid fuel burning for each broad ethnic group in Scotland
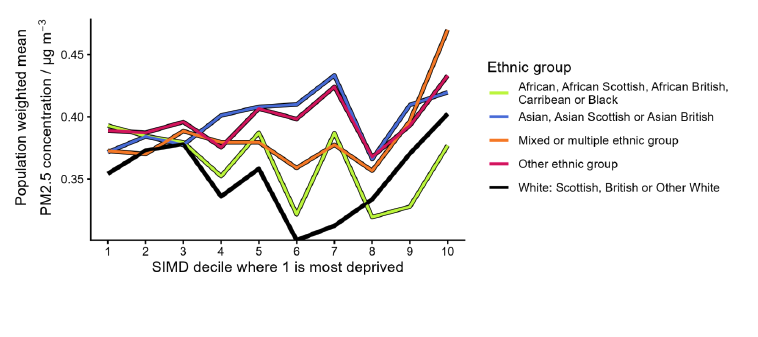
Figure 4‑6: Average concentrations of PM2.5 associated with solid fuel burning for different levels of disability in Scotland
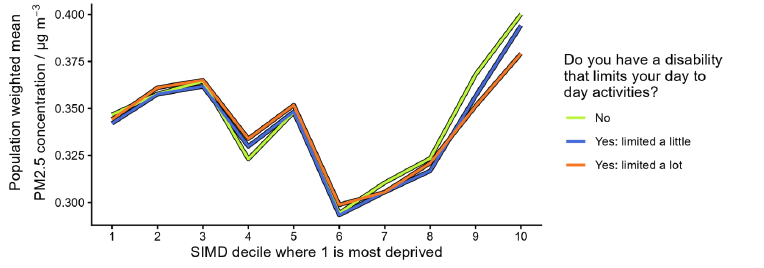
Figure 4‑7: Average concentrations of PM2.5 associated with solid fuel burning for each age category in Scotland