
Domestic solid fuel burning - effects of PM2.5 on health outcomes: evaluation
This study assesses the potential health benefits of further policy actions affecting domestic solid fuel burning in Scotland. Three options were taken forward for more detailed modelling: burn less; burn better; and targeted stock upgrades.
3 Estimation of health impacts associated with domestic solid fuel burning in Scotland
The health burden associated with ‘current’ levels of PM2.5 from domestic solid fuel burning have been quantified to form a counterfactual against which the impacts of policy options can be compared. These have been estimated following the current UK best-practice IGCB guidance and the recommended set of concentration response functions (CRF)[22]. Further results and CRFs assumed are presented in Appendix 3.
The health impacts associated with current levels of burning are set out in Table 3-1. Scottish solid fuel burning is associated with 160 deaths each year, with an associated life years lost (LYL) of 1,814. Pollution from solid fuel burning is also associated with morbidity effects: 38 respiratory hospital admissions (RHA), and new cases of ischemic heart disease (IHD, 23), stroke (27), lung cancer (13) and asthma in children (38) are attributable each year. There are also ‘productivity’ impacts, with pollution linked to 18,400 working days lost (WDL) through absenteeism, 5,000 care hours lost, 2,100 volunteering hours lost and a further 6,400 working days lost through presenteeism (known as minor restricted activity days, or mRADs). All fuels contribute significantly to the overall effect (with wood burning being the most impactful), alongside a non-negligible impact from solid fuel burning outside of Scotland.
| Pathway | Metric | Scottish all solid fuel[23] | Scottish wood | Scottish coal | Scottish MSF | Non-Scottish solid fuel |
|---|---|---|---|---|---|---|
| Chronic exposure | #Deaths | 160 | 58 | 46 | 55 | 39 |
| Chronic exposure | #Life years lost | 1,814 | 652 | 525 | 626 | 445 |
| RHA | #admissions | 38 | 1 | 11 | 13 | 9 |
| IHD | #cases | 23 | 8 | 7 | 8 | 6 |
| Stroke | #cases | 27 | 10 | 8 | 9 | 7 |
| Lung cancer | #cases | 13 | 5 | 4 | 5 | 3 |
| Asthma (Older Children) | #cases | 38 | 14 | 11 | 13 | 9 |
| WDL | #WDL | 18,428 | 6,622 | 5,338 | 6,365 | 4,517 |
| WDL (Care) | #care hours | 4,964 | 1,784 | 1,438 | 1,714 | 1,217 |
| WDL (vol) | #vol. hours | 2,080 | 747 | 602 | 718 | 510 |
| mRADs | #WDL due to mRAD | 6,360 | 2,285 | 1,842 | 2,197 | 1,559 |
When expressed in monetary terms, the detrimental impacts of domestic solid fuel burning on health present a cost each year to Scottish society of around £117 million. This captures the impacts of lost productivity at work, health and social care costs and the lost value that individuals place on their own good health and wellbeing.
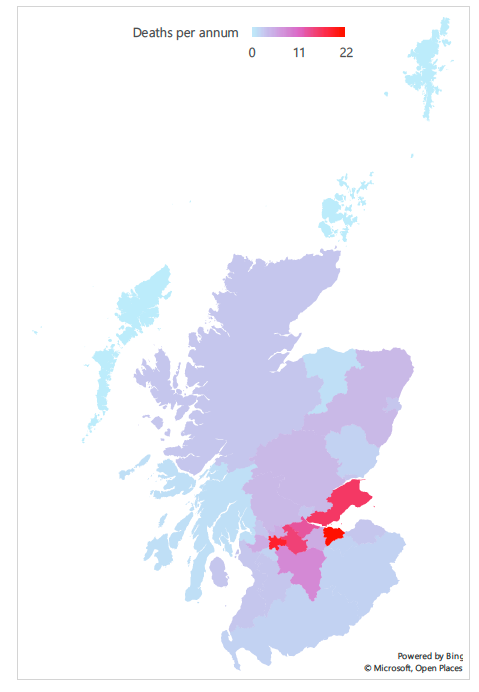
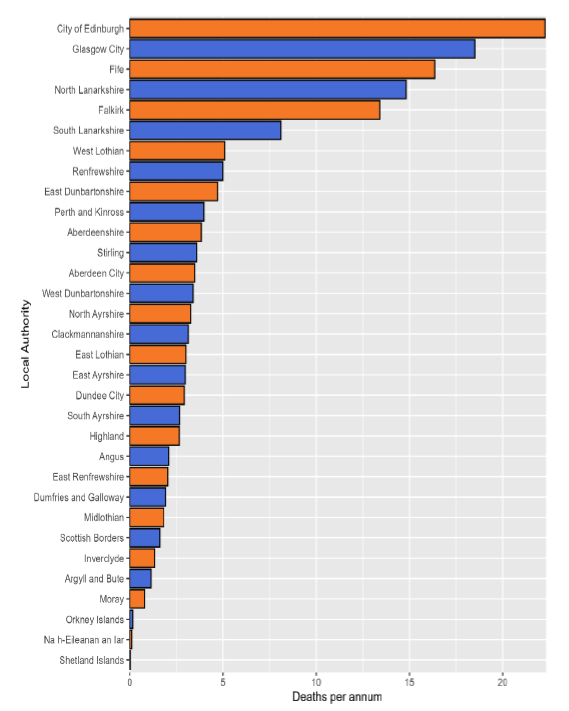
Based on the UKCEH (2025) estimates, the majority of health impacts associated with domestic solid fuel burning are concentrated in a small number of areas - when viewing the results by Local Authority (see
Figure 3‑1 and Table 9‑3):
- 68% of impacts are observed across 9 (out of total 32) Local Authority areas – furthermore, these LAs which are most significantly affected all lie in the corridor between or in close proximity to Glasgow and Edinburgh.
- 59% of impacts are observed in 6 LAs – City of Edinburgh, Glasgow City, Fife, North Lanarkshire, Falkirk and South Lanarkshire.
- In line with these results, the majority of impacts are focused in areas defined as Large Urban Areas or Other Urban Areas (see Table 9-4.)
Figure 3‑1: Deaths attributable to domestic solid fuel burning each year – split by Local Authority[24]
The estimation of health impacts contains various uncertainties. Sensitivity tests have been performed to explore uncertainty in the results, which show:
- In line with the impact on PWMC, the health impacts are sensitive to uncertainties in the underlying air pollution modelling. For example, the number of deaths linked to all Scottish solid fuel burning (central value 160 per year) ranges from 46-239 where fuel allocation is flexed, from 75-331 with varying emissions factors and reduces to 98 when EMEP concentration modelling was based on NAEI 2023 emissions, according to the ranges of PWMC presented in Table 2-2.
- There is also uncertainty in the quantitative relationship linking exposure to health impact, represented by the concentration response function or CRF, around which a range is recommended in the underlying literature. The range varies by impact, but as an example, the attributable deaths per year (central estimate 160) varies from 121-179 and the number of workdays lost through absenteeism per year (central estimate 18,400) varies from 15,700 to 21,200.
- Exposure to air pollution is associated with a much wider range of health pathways than those included in the central estimates. As presented in
| Pathway | Low | Centra | High |
|---|---|---|---|
| Chronic exposure - #Deaths | 121 | 160 | 179 |
| Chronic exposure - Life years lost | 1,375 | 1,814 | 2,030 |
| RHA - #admissions | -25 | 38 | 101 |
| IHD - #cases | -3 | 23 | 50 |
| Stroke - #cases | -3 | 27 | 58 |
| Lung cancer - #cases | 6 | 13 | 20 |
| Asthma (Older Children) - #cases | 19 | 38 | 64 |
| WDL - #WDL | 15,682 | 18,428 | 21,154 |
| WDL (Care) - #care hours | 4,224 | 4,964 | 5,698 |
| WDL (vol) - #vol. hours | 1,770 | 2,080 | 2,387 |
| mRADs - #WDL due to mRAD | 5,698 | 6,360 | 7,149 |
- Table 9‑7, although the supporting evidence is less robust, all Scottish solid fuel burning could also be associated each year with: 3,350 new cases of chronic bronchitis, 110 new cases of diabetes, 20 cardiovascular hospital admissions, and a further 1,100 work days lost due to child absence from school resulting from the health impacts of pollution.
The health impact pathways and CRFs recommended to be captured in quantitative analysis vary between different sets of guidance. The central analysis here has deployed the pathways and CRFs following current UK best-practice guidance. Another important study is the World Health Organization’s ‘Health risks of air pollution in Europe: HRAPIE-2 project’[25]. Adopting the impact pathways listed as ‘A’ (the most robust) and the recommended CRFs produces the results presented in the following table (alongside a comparison to the same or similar pathway assessed in the central analysis). This demonstrates further the uncertainty in the underlying health evidence base, and in particular that the understanding of the relationship between exposure and impact continues to evolve. In this case: mortality effects are higher under HRAPIE-2 assumptions, as the recommended CRF is greater than the current COMEAP recommended function; where morbidity impacts are comparable, HRAPIE-2 seems to produce larger effect estimates, due either to a higher CRF (stroke, lung cancer) or because it captures a larger population cohort (asthma – in this case the HRAPIE-2 CRF is lower, but also captures children aged 0-5 who have a higher baseline incidence rate). For some pathways currently in UK guidance (e.g. WDL, RHA), HRAPIE-2 did not provide a recommendation and for IHD HRAPIE-2 provided a CRF for a linked, but slightly different grouping of effects so the result is not directly comparable, but still informative.
| Pathway | Metric | Central | HRAPIE-2 |
|---|---|---|---|
| Chronic exposure | #Deaths | 160 | 189 |
| Chronic exposure | Life years lost | 1,814 | 2,137 |
| RHA | #admissions | 38 | n/a |
| IHD | #cases | 23 | n/a |
| Acute myocardial infarctions (IHD events | #cases | n/a | 47 |
| Stroke | #cases | 27 | 28 |
| Lung cancer | #cases | 13 | 23 |
| Asthma (Older Children) | #cases | 38 | n/a |
| Asthma (all Children) | #cases | n/a | 80 |