
Domestic solid fuel burning - effects of PM2.5 on health outcomes: evaluation
This study assesses the potential health benefits of further policy actions affecting domestic solid fuel burning in Scotland. Three options were taken forward for more detailed modelling: burn less; burn better; and targeted stock upgrades.
2 Domestic solid fuel burning and its effects
2.1 Patterns of domestic solid fuel burning in Scotland
In the UK, domestic solid fuel burning is widespread and has increased in recent years. As outlined in the previous section, the Defra/Ipsos survey in 2022-23 indicated that the overall burning prevalence in Scotland rose from 14.9% in 2018–19 to 22.2% of households in 2022–23, in which indoor burning increased from 6.8% to 11.3%[12]. Based on this national survey, spatial patterns further indicate that while burning prevalence is higher in rural areas, the overall volume of domestic burning is greater in urban areas because more burners live there.
| UK domestic burning 2022-2023 | Total UK | Total Scotland | In SCA Designation (UK) | Not in SCA Designation (UK) | Rural | Urban |
|---|---|---|---|---|---|---|
| Base (# households) | 39,359 | 3,294 | 17,498 | 20,498 | 6,594 | 32,245 |
| Yes – burned in the last 12 months (% of all households) | 23% | 22% | 20% | 27% | 34% | 21% |
The 2025 release of the UK NAEI (base year 2023, NAEI 2023) incorporated substantial updates to domestic solid fuel emissions, with changes to the NAEI domestic combustion model detailed in a standalone report[13]. These updates were based on the same recent data sources for fuel use (i.e. the Ipsos survey) and emission factors[14] as UKCEH (2025). However, the two approaches used different assumptions for minor fuels and different approaches to the spatial distribution of emissions, which resulted in different estimates of total solid fuel emissions within Scotland and a different spatial distribution. The total emissions from Scottish wood burning are similar, but the NAEI 2023 has lower PM2.5 and SO2 emissions from non-wood solid fuels than the UKCEH (2025) inventory.
Evidence exists which depicts who is burning solid fuel – however the information available has limitations. Some data sources (albeit covering different areas of the UK) suggest that many households burning wood are likely to be less vulnerable. E.g., the Kantar (and subsequent Ipsos) survey found that the majority of indoor burners UK-wide were relatively affluent in comparison with non-burners. However the Kantar survey also found that 19% of indoor burners (at the national scale) found it difficult or very difficult to meet their energy costs[15]. A survey run by the London Wood Burning Project[16] suggested that households burning wood in London are more likely to be: younger (i.e. under 40), property owners, living in houses (rather than flats or other), higher earners (i.e. >£60,000/a) and working full-time.
Census 2022[17] data provide insights into who is using solid fuel as a central heating source – further detail is provided in Appendix 1. This is useful as it can be directly overlaid with demographic characteristics, but only provides a partial picture as it excludes the majority of burning which happens in supplementary appliances. These limitations aside, the analysis shows that: (a) at the national level, those using solid fuels for central heating may not necessarily be those that are most or least deprived; (b) however, if action is taken on solid fuel burning in the six most affected LAs (see Section 3 below), a reasonable proportion of the associated burden may fall on more deprived households (43% of households fall in lowest three IMD deciles); (c) that said, given very few households use solid fuels as their main and only central heating source, it is reasonable to assume that the majority of solid fuel burning is supplementary, either for aesthetic purposes, or to offset the use of other heating fuels (and associated costs)[18].
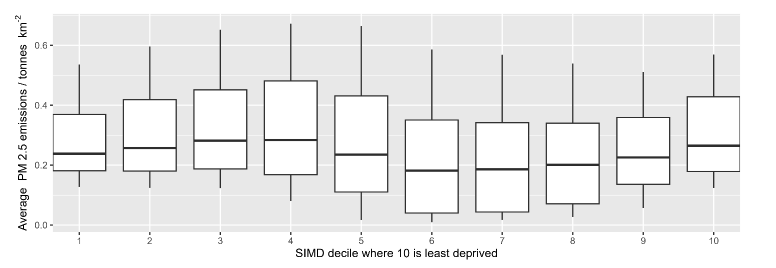
Another way to look at who is burning is to consider emissions data – here deprivation is compared against spatially distributed emissions associated with non-industrial combustion from the NAEI 2024. Notes: This data also includes combustion from agriculture, fishing, commercial applications and institutional combustion, but 80% of the total emissions are due to domestic burning, forming a reasonable proxy. The results were plotted as average emissions per SIMD decile, with the results shown in Figure 2‑1. This shows that PM2.5 emissions from non-industrial combustion do not show a strong correlation with SIMD decile, however levels of burning (illustrated by emissions) appear greater at both ends of the deprivation spectrum: emissions are higher in deciles 1-4 (most deprived) and decile 10 (least deprived), while being lower in the middle deprivation deciles.
Figure 2‑1: Average emissions in each SIMD decile, the median and lower quartiles are plotted in the boxplot, with whiskers extending to the 10th and 90th percentiles.
2.2 Contribution of domestic solid fuel burning to air pollution
In the UK, domestic burning of solid fuels is described as one of the largest sources of primary PM2.5 emissions[19]. UKCEH (2025) undertook a detailed assessment of air pollution from domestic solid fuel burning in Scotland. It used new calculated emissions data based on the latest emission factors from Defra’s Emission Factors for Domestic Solid Fuels (EFDSF) study[20] together with atmospheric modelling to examine the influence of solid fuel burning on PM2.5 in Scotland and then compared the results with specialist measurements at selected locations. The use of updated fuel use estimates and emission factors led to a reduced estimate of Scottish wood burning PM2.5 emissions but an increased estimate of other solid fuel emissions compared to the NAEI 2021. The modelling showed a Scottish spatial mean total PM2.5 concentration of 5.84 µg m-3, with a solid fuel burning contribution of 0.086 µg m-3. The corresponding population-weighted mean concentration (PWMC) was 7.11 µg m-3, including a contribution from all Scottish solid fuel burning of 0.359 µg m-3 (approximately 5%). Secondary PM2.5 species, which are formed from gaseous emissions through atmospheric chemistry processes, made up 29% of the modelled PWMC from solid fuel burning. It should be noted that the model used for this study might overestimate the contribution from sea salt at maritime locations like the UK because it is ‘tuned’ to work across continental Europe. Whilst this does not affect the quantification of solid fuel burning PM2.5, it might mean the relative contribution to the total is underestimated.
Some indication of the variability between model estimates of pollution contributions from domestic solid fuel burning can be obtained by comparison of the UKCEH (2025) study with other estimates. One alternative study of health impacts from UK burning published in October 2025[21] used modelling of primary particulates only and relied on the NAEI 2022 spatial distribution of domestic burning emissions, with totals scaled to the NAEI 2023 - hence a lower proportion of UK domestic solid fuel assigned to Scotland. The estimated annual average PM2.5 concentration changes due to the banning of secondary burning (defined as 75% of solid fuel burning in rural areas and 90% in urban areas) were generally small in Scotland, with values in most areas less than 0.15 µg m-3 and peak values in the Central Belt of up to 0.5 µg m-3. This is lower than the UKCEH (2025) baseline modelling, which predicted broad areas with PM2.5 from solid fuel burning in the range 0.1 – 0.5 µg m-3 and peak primary PM2.5 concentrations as high as 3.59 µg m-3. The differences between the results are partly due to the spatial pattern of the fuel survey used by the NAEI 2022, which allocated significantly less fuel to Scotland than suggested by the newer Ipsos data that underpins both the UKCEH and the NAEI 2023 inventory. To assess the impact of different emission assumptions further, the same atmospheric chemistry and transport model used for the UKCEH (2025) modelling has been re-run using the NAEI 2023 emissions (see Appendix 2).
Key uncertainties in the UKCEH (2025) modelling study were identified as follows.
1) The proportion of UK solid fuel use allocated to Scotland, which changed substantially between successive UK-wide fuel surveys. This was assessed using a low fuel allocation estimate, corresponding to NAEI 2021 (released 2023) and a high fuel allocation estimate, 50% above UKCEH (2025) baseline and NAEI 2023.
2) The emission factors assigned to each combination of fuel and burning appliance, where new data were based on small samples and tightly controlled burning conditions. This was assessed using high and low PM2.5 and SO2 emission factor values for individual fuel and appliance combinations from available data.
3) The spatial allocation of solid fuel use within Scotland, relying on assumptions for the combinations of fuels and appliances used in rural, urban and smoke control areas. This was assessed using new modelling based on the NAEI 2023 inventory, which has a different spatial distribution of solid fuel emissions to the UKCEH (2025) baseline.
The impacts of these uncertainties on the PM2.5 PWMC have been quantified in this study – further details on the approach are presented in Appendix 2. Additional uncertainties which are likely to be smaller in magnitude than the key uncertainties but have not been quantified include: the allocation of fuels to different appliance types; the modelled time variation of solid fuel burning emissions; and the spatial resolution of modelled concentrations.
The resulting PM2.5 PWMC values for each scenario are summarised in Table 2‑2. The lowest total solid fuel PWMC estimate comes from the low Scottish fuel allocation scenario (0.104 µg m-3), while the highest solid fuel PWMC is generated by the high emission factors scenario (0.742 µg m-3). Modelling based on the NAEI 2023 gives the lowest total PWMC from all sources, however this is influenced more so by reductions from non-solid fuel burning compared to the baseline (NAEI 2021) - the solid fuel PWMC modelled based on NAEI 2023 is closer to the baseline than the low fuel allocation or low emission factor scenarios. The full uncertainty range would be realised by combining the lower fuel allocation with the lower EFs, and the larger fuel volumes with the higher EFs.
| Scenario | Population-weighted mean concentration (PWMC) PM2.5 (µg m-3) - Wood | PWMC PM2.5 (µg m-3) - Coal | PWMC PM2.5 (µg m-3) - MSF | PWMC PM2.5 (µg m-3) – Total Solid Fuel | PWMC PM2.5 (µg m-3) - Total |
|---|---|---|---|---|---|
| UKCEH baseline | 0.129 | 0.104 | 0.124 | 0.357 | 7.11 |
| Low Scottish fuel allocation | 0.060 | 0.028 | 0.016 | 0.104 | 6.86 |
| High Scottish fuel allocation | 0.194 | 0.156 | 0.186 | 0.535 | 7.29 |
| Low emission factors | 0.064 | 0.059 | 0.045 | 0.169 | 6.92 |
| High emission factors | 0.320 | 0.182 | 0.241 | 0.742 | 7.50 |
| EMEP modelling based on NAEI 2023 | - | - | - | 0.219 | 6.70 |