Economic impacts of wind farms on Scottish tourism: report
Report commissioned by Glasgow Caledonian University to assess whether government priorities for wind farms in Scotland are likely to have an economic impact on Scottish tourism.
5 The GIS Study
5.1 Introduction and objective
This chapter provides an overview of Geographical Information Systems ( GIS), discusses why it was thought that they might be useful as a solution to the research problem and how they were employed in practice
Providing a definition of a geographical information system is not an easy task. Heywood et al (2002, pp. 11-12) discuss various attempts at providing a definition. The Department of the Environment (1987, p. 6) define a GIS as "a system for capturing, storing, checking, integrating, manipulating, analysing and displaying data which are spatially referenced to the earth". This seems as good a definition as any given that the topic of interest here is concerned with the distribution of wind farms relative to their physical locations and the distribution and activities of tourists.
At first it may not seem obvious why GIS is of interest. This study seeks to identify the actual impact of current and projected wind farms on tourists in order to estimate the potential economic impact. This impact comes in numerous ways. Walkers on the Southern Upland Way, for example, will have almost continuous exposure. On the other hand Scottish tourists going to the West Highlands may have no exposure. The former group may experience considerable loss of value and a considerable proportion of potential walkers may choose to go elsewhere, but the economic impact will still be small if the numbers undertaking the activity are small.
The nature of the exposure is expected to have different impacts. A Wind farm only visible as a pattern on a distant hill (e.g.the Braes of Doune) may have a different impact, both positive and negative, from one adjacent to the road (e.g. Hill of Dun and Causeymire).
Because of the huge numbers of tourists on a major route such as the M74, slight exposure may actually have a significant economic impact. One of our priorities, therefore, has been to estimate the numbers that have exposure as a proportion of all tourists.
Formally the key objective of the GIS study was to combine the roads and accommodation that would be exposed with the numbers of people on the roads or in the accommodation and establish three metrics
1. Percentage of Tourists travelling on roads in the area who had high exposure to wind farms, where high is defined as a view of more than four or more turbines at either less than 1km for 2 minutes or less than 15km for at least 10 minutes
2. Percentage of Tourists travelling on roads in the area who had medium exposure to wind farms, where medium is defined as a view of more than four or more turbines at less than 15km for at least 2 minutes
3. Percentage of accommodation in an area with a view of four or more wind turbines
5.2 The geographical information systems model
GIS is concerned with the analysis of any spatial system. Obvious examples include the distribution of economic, health or social characteristics within the UK (or any locale); the numbers or characteristics of the population within a zone associated with a resource (railway station, school, hospital); spatial links between features such as early settlements and the analysis of urban activity on flood plains. The problem discussed here was how to identify the number of motorists who could view wind farms when they travelled in Scotland and the number of hotel beds that were similarly affected.
The basic tool of GIS is the map. There are two types of map; Raster and Vector. In the raster structure the map consists of a number of cells (e.g. 4000*4000) each of which carries information e.g. colour and height. Since areas, such as forests or roads exceed single cells the cell links are made using colour and external information. For example a set of cells coloured red adjoining each other in a line might be recognisable as a road. In contrast the vector map consists of points, lines and polygons with identified attributes such as the grid reference, the feature class (an "A" road), names ("A99") and other details (vehicle counts). GIS is normally based on vector maps since this is how information is most easily stored and linked.
The two most important functions for analysis are Join and Spatial Join. In "Join" data is attached to the map on the basis of a common factor. For example we might have a map which contains the borders for the Census output areas and has a Name attribute. If data from the census on, for example, employment rates by output area also contains the Name then it can be simply Joined and presented on the map.
Spatial Join examines the location (co-ordinates) of the information to be joined. For example suppose we have a hotel list with co-ordinates and a map containing local authority borders then we can attach each hotel to the local authority using a Spatial Join.
5.3 The software
The software used in this study is ESRI's Arc GIS. Arc GIS is a suite of different applications rather then a single piece of software. The main applications used in this study were: ArcMap, ArcScene and ArcCatalogue. ArcMap allows the creation and analysis of 2D and 3D maps and data. It is used for the majority of the analysis in this study. ArcScene can display data in three dimensions as opposed to the two dimensions used in ArcMap. It also allows some analysis to be undertaken although it requires higher processing power than ArcMap. ArcCatalog is used to create and organise the files used in the rest of the Arc GIS suite.
In addition to the main programs of Arc GIS there are 'extensions' available. These extensions add new features. This study utilises the '3D Analyst' extension and one of the features in this extension allows visibility maps to be calculated. These maps are known as viewsheds within the application. The term is derived from the more familiar concept of a watershed and in the planning arena the alternative and more understandable term Zone of Visual Impact ( ZVI) is used. In the system used here the viewshed tool creates a layer on the map which shows areas which are visible from a given point (or set of points). To be more precise, the tool divides the area into cells and then examines each cell in turn to establish how many of the nominated points can be viewed. In this case, the set of points were the wind turbines.
5.4 ZVI analysis
Currently all wind farms which are approved for construction will have ZVI (zone of visual impact/intrusion) studies conducted as part of the environmental appraisal. SNH (2006) provide an excellent discussion of what is involved in a ZVI analysis.
As early as 1996 Sparkes and Kidner (1996) demonstrated the use of GIS and a viewshed tool to select sites which would be appropriate for the construction of wind farms. Their approach took into account wind speed, proximity to centres of population and proximity to roads. It did not, however, attempt to quantify the number of people exposed to wind farms or measure the intensity of those experiences. It is also a fairly simple early example and now, with the growth of computing power, far more sophisticated models become possible.
As far as can be ascertained, the models in this study constitute a major development in two ways. Firstly there appear to be no examples of ZVI data combined with other data sources to quantify the number of people exposed and the level of that exposure. Secondly we can find no examples of combining three or more ZVIs of individual farms for area wide analysis.
5.5 Model construction
5.5.1 Boundary Maps
There are a number of steps which were completed before the viewshed analysis was carried out. The first stage was to obtain the necessary maps of the borders of the area of interest. These, along with all the other maps required, were obtained from Edina, a service administered by the University of Edinburgh and funded by the Joint Universities. Edina provides boundary maps for all geographies in the UKBorders section and also, critically, provides all the OS maps, both raster and vector in the Digimap section. The boundaries of a specific area of interest can be extracted by removing the other areas from the boundaries file's attribute table or by downloading only the boundary of interest using the 'boundary data selector'. This can be useful if the full borders file is very large (for example, a file covering the whole of the UK).
5.5.2 Colour raster maps
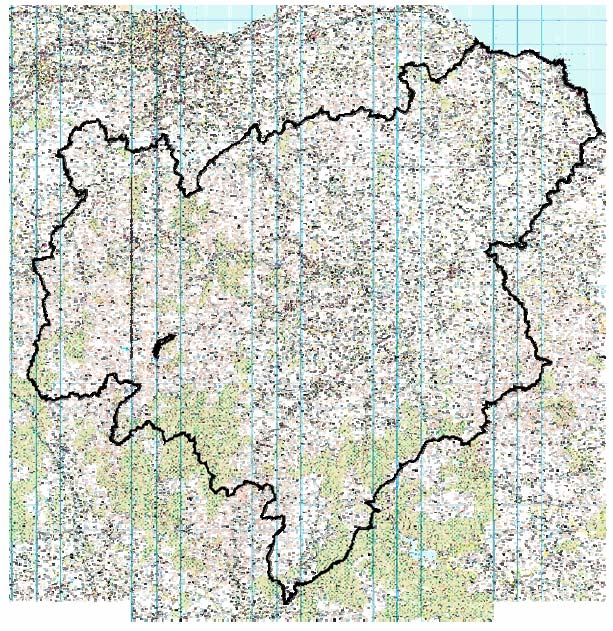
To identify wind farm locations, good maps are required of the area within the boundaries. The first maps obtained were the 1:50,000 scale colour raster maps, available under the data download services section of the Digimap site. The maps are downloaded in 20km * 20km tiles.
Figure 5-1 Colour raster maps of the Borders with boundary superimposed
5.5.3 Digital Terrain Model ( DTM) files
The raster maps cannot be used for ZVI analysis since they contain no information about the elevation of the points on the map i.e. they contain x and y coordinates but no z coordinates. 3D data is held on DTM maps which can also be obtained from Edina/Digimap. The maps used in the study were the 1:50,000 Landform Panorama DTM maps in dxf format. A tile from here is needed for every tile already obtained (i.e. one DTM tile for every colour raster tile). These maps are slightly less precise than some of the other OS products available but they cover a far larger area. This is an important consideration because four large areas of Scotland are modelled in this study. These maps are considered as acceptable for use in a ZVI ( SNH, 2006 p. 28).
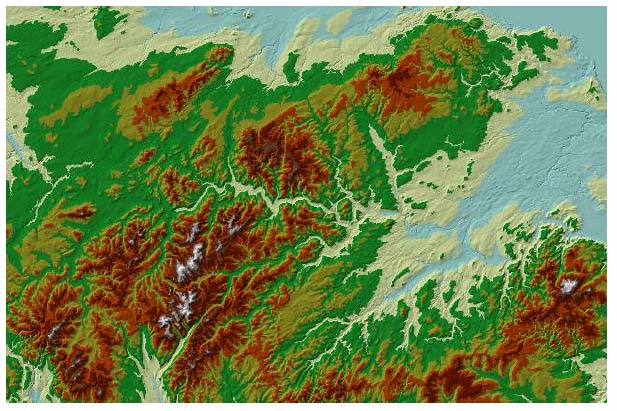
The Panorama tiles are unlike the raster and border maps already discussed and cannot be imported directly into ArcMap (or at least, they should not be directly imported when carrying out a viewshed analysis). They are known as CAD (computer aided design) drawing sets and contain a number of features e.g. polygons, points etc. It is the point files that are of interest since each point contains an x, y and z coordinate. The points are 'stitched' into one single surface layer by creating a triangulated irregular network ( TIN) file which consists of thousands of triangles connecting the points. An example of the results of this process for the Scottish Borders is given in Figure 5-2
Figure 5-2 TIN model of the Borders
5.5.4 Placing the turbines
Details of all wind farm applications were available from the Scottish Government website 14. This spreadsheet gives all wind farm applications with their region, status and x, y coordinates.
The points were added to the map to show the location of each of the wind farms. They do not, however, show the actual turbine locations. The turbines' locations were manually added to the map. For some of the sites, the turbine locations were available as part of the environmental impact statement for the project. However, as some of the applications are at an early stage, the turbine locations were not available. When this was the case, the turbines were laid out in a grid pattern. The number of turbines at each site was obtained from the British Wind Energy Association ( BWEA) 15. The heights of the turbines were not available from one single location and each site had to be looked up individually from various sources. Because clever placement of turbines can significantly reduce visibility, when the location was not available the height of the turbines was reduced by 30%. It is also normal for some turbines to be removed from a proposal before construction begins. Reducing the effective height also helps to compensate for this.
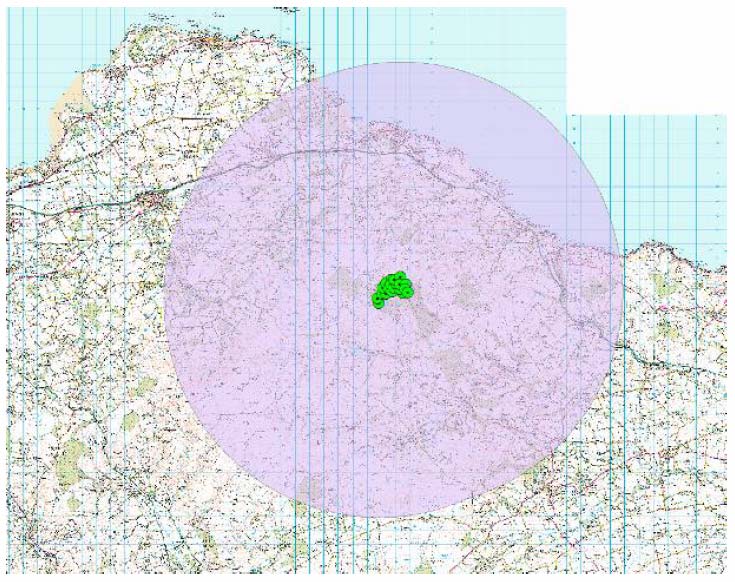
5.5.5 Drawing the 15km visibility region
A 15 km boundary was drawn around each of the wind farms to act as a limit for the ZVI analysis. This is the distance between the Braes of Doune wind farm and Stirling Castle. Beyond 15km, turbines are still visible (given favourable weather conditions) but begin to blend into the landscape. The 15km distance is also recommended by the Sinclair-Thomas matrix 16 (planning guidance on the best zones to use for ZVI analysis).
Figure 5-3 The 15km buffer around the Crystal Rig wind farm
5.5.6 Generating the ZVI
The Viewshed tool allows certain parameters to be specified. One of these is whether the tool should take into account the curvature of the earth and the refraction of light when calculating visibility. It is particularly important to use this option when large distances are being considered. Because the distance in this case was only 15 km it was not strictly necessary to use the tool but there is little cost in its application.
The Viewshed tool also allows a 'viewer offset' to be specified. Ordinarily, it is assumed that a view will be from around 2m. Tourists in vehicles will be observing from a lower height and even those in high vehicles will have views obscured by hedges and walls. Even though people observing from accommodation may be much higher it was still not felt appropriate to make allowances for 'viewer offset'.
Another parameter which can be set is the cell size option. The Viewshed tool defaults to a set number of cells (100*100) and, because of the size of the area being examined (2500 sq km), the resulting cells were as large as 500m*500m. This was too imprecise to properly distinguish if a section of a road in a valley could see a wind farm. Setting the cells smaller, using the cell size option, dramatically increases the processing necessary. We eventually settled on a 40m*40m cell size. This would require an analysis for the whole area of the exposure of some 16 billion cells. Limiting the area of analysis to the twelve 15km radii circles reduces the number of cells to 530million, still an enormous task requiring modern high speed processors.
5.5.7 Adding the Road Network
One of the key metrics which has to be extracted from the model is the length of road exposed to wind turbines. In order to calculate this, the road network had to be added to the map. Although the roads were already displayed on the raster maps, manual measurement would have been difficult and time consuming. The alternative was a vector map of the roads.
The OS Strategi map is a vector map which contains details on all roads in the UK. The main roads (i.e. A roads and Motorways) for Scotland were extracted and added to the map.
Figure 5-4 Borders combined viewshed (current and agreed) with main roads added
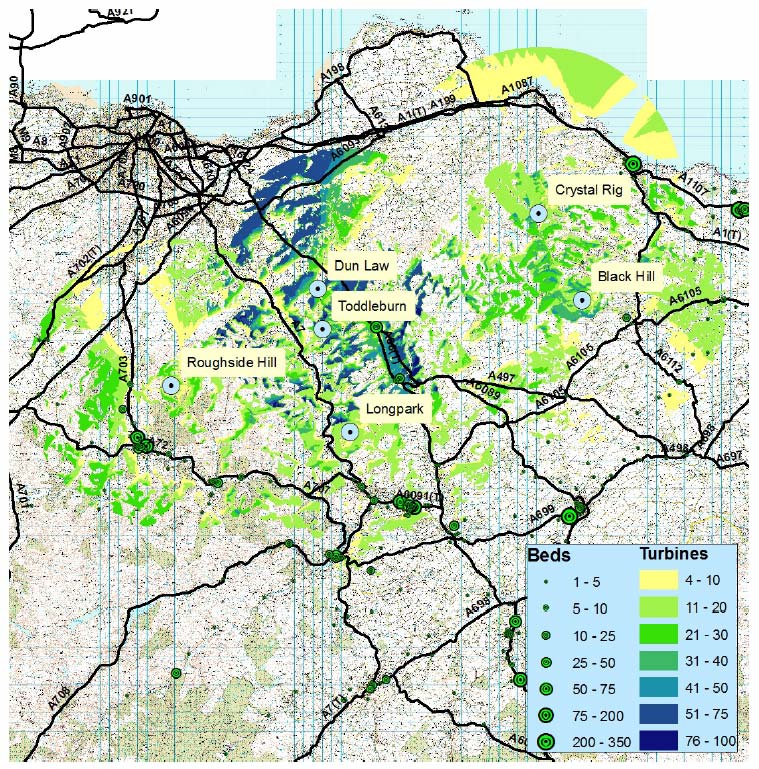
At this stage the model was validated by the research team. This was achieved by direct observation on key routes and by selecting locations that apparently had high visibility of a number of farms. Gratifyingly the predictions of the model were found to match the actual experience with remarkable precision.
5.5.8 Adding Accommodation
An accommodation list for the whole of Scotland was obtained from VisitScotland. This gave a list of all the different accommodation units in Scotland, their post codes, the number of rooms/units and the number of beds.
The post codes of each accommodation unit was converted into a map coordinate using the postcode directory (compiled by the Office of National Statistics) provided by Edina in the UKBorders section of their website. The database allows the conversion of any postcode into another geographical reference (map coordinates in this case).
The method used to calculate the affected accommodation is similar to that for roads. The software identifies locations where the ZVI overlaps the points of accommodation. It then makes a list of the accommodation affected. From this list the number of rooms affected by the wind farms as a proportion of the total number of beds in the region can be calculated.
5.6 Using the model
5.6.1 Visibility Definitions
For a cell to count as being exposed to a wind farm, it was decided that at least four turbines should be visible from it. There were two reasons for this:
It can be difficult to notice only one or two wind turbines (particularly from the road). Since it is 'noticibility' that is of more interest here than visibility, four was regarded as a sensible minimum.
This approach reduces areas which are visible 'at the margin'. The model cannot be thought of as accurate at the margin since the exact location of the turbines is unknown for many farms. The model also takes no account of the screening effects of plants, trees, buildings etc.
The finished map is useful in illustrating visibility in a region. The layer can show how many turbines are visible from each point on the map as well as which wind farm they originate from.
With the 15km zone and the roads added to the Combined ZVI, the model is ready for the necessary analysis
5.6.2 Estimating the Metrics
The objective of the GIS study is to not only identify which roads were exposed at 2km and at 15km but the length of time the traveller was in the zone. Roads consist of a series of straight line sections with common start/end co-ordinates and a name. One of the attributes of each section is the length of the section (calculated from the co-ordinates). The software examines where the ZVI and the road sections overlap and provides a list of which of these sections are affected. Summation of these sections and an assumption of 1km per minute travel time leads to an estimate of the length of time the traveller is exposed to a farm. It should be noted that all the calculations were made under an assumption of good visibility and cloud cover above the turbines. In practice, depending upon the location, clouds may completely obscure the turbines on a number of days and on other days light rain or mist would severely restrict visibility, particularly at a distance of 10-15km. On these days, however, it might be hypothesised that scenery is not a critical element in the holiday experience.
The next problem in the analysis is identifying the number of tourists travelling along these roads and subject to this level of exposure. The estimation of tourist flows is dealt with in the next section
Estimating the accommodation metric is somewhat easier. Accommodation in the zone is identified and the number of bed spaces summed. Total bed spaces are determined and the percentage affected calculated. Together they provide the third metric.
5.7 Estimating traffic flow
5.7.1 Data Sources
This section of the study brings together data from four sources:
- The Scottish Executive Road Traffic Data Base. This data covers all trunk roads in Scotland and is available at:
http://www.transportscotland.gov.uk/defaultpage1221cde0.aspx?pageID=295 - Local Authority road traffic databases. For non-trunk roads the local authorities carry out spasmodic traffic counts. In some cases these may only cover a few days in a specific month.
- The VisitScotland visitor database obtained from the UK Tourist and International Passenger Surveys. This data was primarily used as a check.
- The National Traffic Survey Long Distance Journey data. This data was used south of the central belt to distinguish between Scots travelling south for holidays and visits and inhabitants from the rest of the UK travelling north.
5.7.2 The Road Data Base
The trunk road data base, managed by the Scottish Executive, is the most important source of data. Figure 5-5 illustrates the web interface.
Figure 5-5
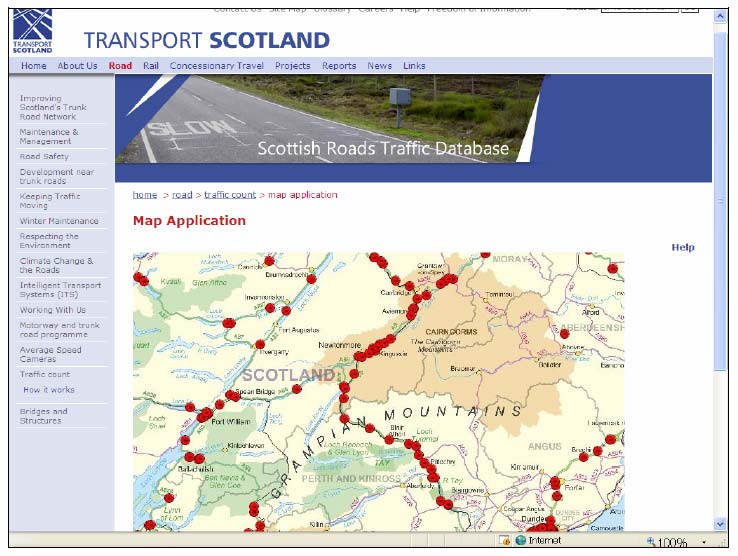
Selecting any identified point will produce summary data flows and a chance to access detailed data for the last five years. Table 5-1 illustrates typical data obtained.
Table 5-1 Typical Road Data Utilised
Glencoe |
7 Day Average |
||
|---|---|---|---|
North |
South |
Days |
|
Month |
CCA |
CCA |
|
Jan-06 |
1538 |
1395 |
31 |
Feb-06 |
1823 |
1783 |
28 |
Mar-06 |
1793 |
1776 |
31 |
Apr-06 |
2553 |
2586 |
30 |
May-06 |
2766 |
2733 |
31 |
Jun-06 |
2981 |
2834 |
30 |
Jul-06 |
3271 |
3234 |
31 |
Aug-06 |
3556 |
3358 |
31 |
Sep-06 |
2852 |
2703 |
30 |
Oct-06 |
2316 |
2184 |
31 |
Nov-06 |
1664 |
1602 |
30 |
Dec-06 |
1492 |
1555 |
31 |
The difference between Summer (April to September) and Winter (Other Months) is taken to stand as a proxy for tourist traffic. To check theses assumptions and help distinguish between day trips and overnight stays, data on leisure trips from the Visit Scotland website and from the National Travel Survey was then utilised to obtain a tourist traffic flow map for Scotland.
5.7.3 Number of Visitors by Region
Table 5-2 summarises the 2005 data from VisitScotland by Tourist Area and estimates of the associated number of tourist vehicles. A number of points need to be made:
- The survey methodology (random telephone) was subject to an in-depth analysis and found to be underestimating tourist numbers.
- Tourists include Business Trips, Visits to Friends and Relatives and Holidaymakers. Thus the large centres of population inevitably dominate.
- The vehicle calculations make a number of assumptions:
I. 2 persons per vehicle
II. 20 persons per coach
III. 50% of overseas road passengers are in a coach
IV. 20% of those from overseas arriving by plane take car hire - The sum of the areas is greater than the Scottish total due to touring holidays.
- The figures do not include day trips.
Data from the Highland Visitor Survey suggests that 22% of visitors to the Highlands stay in Caithness and Sutherland whilst a further 17% take a trip to the area from their holiday base. Given an estimated 530,000 tourist vehicles in the Highlands we might expect of the order of 117,000 overnight tourist vehicles in C&S and an additional 90,000 day visitors. We discuss more precise numbers in the sections on Caithness but as an illustration the number of tourist vehicles travelling north on the A9 to Thurso past the Causeymire development is 25,000. In fact despite the size and importance of wind farms in Caithness we estimate that of the 207,000 tourist vehicles in Caithness and Sutherland a surprisingly low 25% are currently exposed to wind-farm developments simply because the majority of tourists heading north on the A9 go to Wick and then on to John o'Groats. As will be seen in chapter 8 this situation is unlikely to last.
Table 5-2 Estimates of Vehicle Numbers by Tourist Area
Scotland |
Aberdeen |
Dundee |
Argyll, Isles, |
Ayrshire |
Scottish |
Dumfries & |
Edinburgh |
Fife |
Glasgow & |
Highlands |
Perthshire |
|
|---|---|---|---|---|---|---|---|---|---|---|---|---|
Trips |
17.26 |
1.77 |
0.78 |
1.97 |
1.11 |
0.39 |
1.03 |
3.98 |
0.78 |
3.39 |
2.34 |
0.97 |
Trips UK |
14.87 |
1.58 |
0.69 |
1.67 |
0.94 |
0.34 |
0.97 |
2.78 |
0.65 |
2.62 |
1.84 |
0.84 |
Trip Over |
2.39 |
0.19 |
0.09 |
0.30 |
0.17 |
0.05 |
0.06 |
1.20 |
0.13 |
0.77 |
0.50 |
0.13 |
Scot% |
45% |
62% |
66% |
51% |
49% |
23% |
30% |
24% |
61% |
32% |
58% |
53% |
Trips Scot |
6.75 |
0.98 |
0.46 |
0.85 |
0.54 |
0.09 |
0.31 |
0.96 |
0.48 |
1.08 |
1.36 |
0.51 |
Trips RUK |
8.13 |
0.60 |
0.23 |
0.82 |
0.40 |
0.25 |
0.66 |
1.82 |
0.17 |
1.54 |
0.48 |
0.33 |
UK Car % |
65% |
64% |
77% |
69% |
72% |
88% |
86% |
46% |
63% |
55% |
74% |
62% |
UKCar |
4.83 |
0.51 |
0.27 |
0.58 |
0.34 |
0.15 |
0.42 |
0.64 |
0.20 |
0.72 |
0.68 |
0.26 |
UK Coach% |
8% |
13% |
1% |
10% |
3% |
9% |
2% |
4% |
9% |
6% |
9% |
9% |
UKCoach |
0.06 |
0.01 |
0.00 |
0.01 |
0.00 |
0.00 |
0.00 |
0.01 |
0.00 |
0.01 |
0.01 |
0.00 |
Road OS % |
19% |
12% |
12% |
12% |
3% |
25% |
12% |
13% |
6% |
12% |
25% |
7% |
Oseas |
0.05 |
0.00 |
0.00 |
0.00 |
0.00 |
0.00 |
0.00 |
0.02 |
0.00 |
0.01 |
0.01 |
0.00 |
Hire (Oseas) |
0.19 |
0.02 |
0.01 |
0.03 |
0.02 |
0.00 |
0.01 |
0.10 |
0.01 |
0.07 |
0.04 |
0.01 |
Vehicles |
5.07 |
0.52 |
0.27 |
0.61 |
0.36 |
0.15 |
0.42 |
0.76 |
0.22 |
0.80 |
0.73 |
0.27 |
Holidays % |
63% |
73% |
61% |
61% |
69% |
68% |
69% |
60% |
60% |
61% |
72% |
60% |
Net Vehicles |
3.20 |
0.38 |
0.17 |
0.37 |
0.25 |
0.11 |
0.29 |
0.46 |
0.13 |
0.49 |
0.53 |
0.16 |
5.7.4 The National Travel Survey
In contrast to the UKTS the NTS is a highly structured representative survey of 30,000 households over a 3 year period. Participants in the survey keep a detailed log of every journey made in a specific week and also record details of long distance journeys make in the last four weeks. In this context a long distance journey is defined as in excess of 50 miles. The long distance journey file gives details of origin, destination, mode and purpose amongst other variables, which allows leisure trips by Road to and within Scotland to be separately identified. Riddington (2000) provides more detail on the use of the NTS. Table 5-3 summarises.
Table 5-3 National Travel Survey Results for Scotland
Scotland |
Road |
13130 |
86.8% |
Day |
1879 |
12.4% |
|---|---|---|---|---|---|---|
Other |
1997 |
13.2% |
Overnight |
13248 |
87.6% |
|
85.2% |
Sub Total |
15127 |
100.0% |
15127 |
100.0% |
|
RUK |
Road |
2435 |
92.4% |
Day |
307 |
11.7% |
Other |
201 |
7.6% |
Overnight |
2328 |
88.3% |
|
14.8% |
Sub Total |
2635 |
100.0% |
2635 |
100.0% |
|
Total |
Road |
15564 |
87.6% |
Day |
2186 |
12.3% |
Other |
2198 |
12.4% |
Overnight |
15576 |
87.7% |
|
Total |
17762 |
100.0% |
17762 |
100.0% |
Whilst the overall total of 15.6m overnight trips by UK citizens is comparable to the 14.9m found in the Visit Scotland data the NTS suggests far more trips are by Scots (85% v 45%) and more by road (88% v 73%). The road data suggests a larger proportion of visits are by road than VisitScotland and a larger proportion by citizens from the Rest of the UK than the NTS. The NTS was thus used primarily as a guide to the number of Scots travelling home from the South.
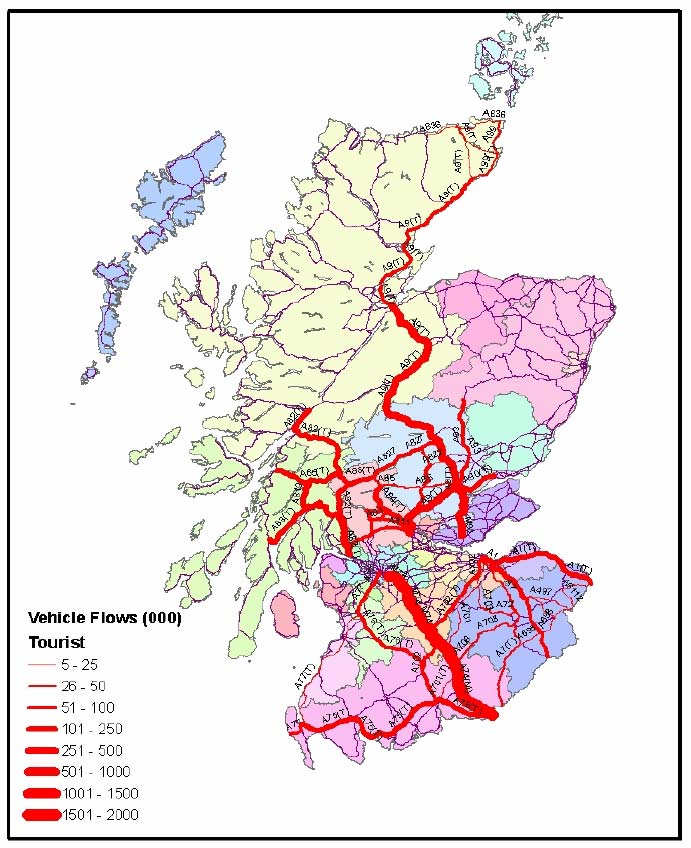
5.7.5 The Tourist Travel Flow Map
The tourist travel flow map was developed to help understand the flows of tourist trips in the Borders and in Perth and Kinross. The Visit Scotland and NTS data were used to check that the road data was consistent with what we know to be the trip totals. The map is given in Figure 5-6 and is the basis of the physical impact assessment in the following sections.
Figure 5-6 Main Tourist Travel Flows
5.7.6 Estimation of Percentage of Tourists Affected
The objective of the GIS section is to identify the proportion of tourists in each area and in Scotland as a whole that are or will have "significant" exposure to Wind farms. Estimation of the accommodation so affected is relatively simple; a hotel is either within the viewshed or outside it. Individuals that are touring, however, may progress on a route that appears to have no exposure e.g. through the Trossachs heading north to Crainlarich, but in practice head east through Callendar into the viewshed of the Braes of Doune. This section discusses the assumptions made in estimating the "proportion affected" metric.
Two "types" of tourist in an area are estimated. Some will simply pass through an area en route to another area, such as those passing through Dumfries and Galloway on the M74 on the way north. We estimate the number of en route tourists by identifying numbers entering and exiting on the same or closely related route. For example tourist vehicles enter the Stirling area on the A82 at the north end of Loch Lomond and exit just past Tyndrum on the A82 and A85 are defined as en route. A key assumption is that vehicles normally return on the same roads. For example the 400,000 tourist vehicles heading north up the A9 will return by the same route. If a route is unexposed heading north then all the vehicles that exit the area are assumed to retrace the same unexposed route. It should be emphasised that many of those en route are on touring holidays and utilise accommodation in the area.
In all cases a number of tourists remain in the area and go no further. These are termed stayers. They include both those taking accommodation in the area and those on long day trips. Some of these will remain in areas unaffected by Wind farms. As an example those coming from Glasgow on the A81 into the Trossachs area of Stirling and do not head east to the A9 for the return trip, will not get significant exposure. However large numbers do travel from west to east in this area. As an ad hoc procedure the ratio of flows north-south and east-west is used to estimate those moving into exposed areas.
To illustrate the procedure Figure 5-7 gives the combined ZVI for the Perth area (before the rejection of the Calliacher application) and Figure 5-8 a schematic map for the same area with exposed sections of road marked,.
Figure 5-7 Combined ZVI for Stirling, Perth and Kinross (Constructed and Agreed)
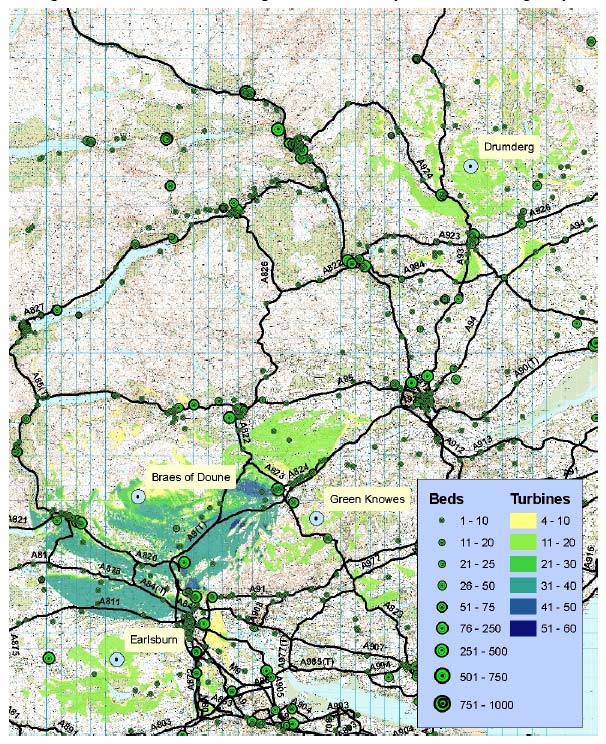
Base Map © Crown Copyright
Figure 5-8 Schematic map of road system in Stirling, Perth and Kinross with exposed sections
What is clear is that the only unaffected routes are on the extreme west either on the A82 or on the A81/821 Trossachs route. A limited number of vehicles will enter central Perthshire via Crainlarich. The ratio A82/821: A84/5 is 170:216 i.e. as many as 44% of the 60,000 on the Loch Tay road may not have seen a wind farm. Summing entry and exit points and utilising these calculations generates the following table:
Table 5-4 Assessing the proportion of vehicles exposed
En Route |
Stayers |
Total |
||||
|---|---|---|---|---|---|---|
'000 |
Percent |
'000 |
Percent |
'000 |
Percent |
|
Exposed |
776 |
82 |
312 |
92 |
1088 |
85 |
Unexposed |
170 |
18 |
27 |
8 |
197 |
15 |
Total |
946 |
100 |
339 |
100 |
1285 |
100 |
Again it should be noted that a number of those en route will stay in the area for some time and the assumption is that any impact will apply to all exposed tourist whether stayers or en route.
5.8 Tourist numbers and exposure: conclusion
The GIS study attempts to link the location of wind farms, the position of roads and accommodation and traffic flows to estimate the number of tourists in any area that will be exposed to wind farms. It is recognised that these figures will appear at times contrived, unreliable and potentially erroneous. The perspective of this project, however, has always been that the numbers are best seen as orders of magnitude and should be viewed in the context of alternative claims, such as that the Griffin forest development will cost 2000 jobs. The numbers exposed to Griffin are, in fact, tiny compared to other schemes. The alternative conclusion is that whilst some 85% of tourists in the Stirling, Perth and Kinross area will have significant exposure, the damage, if there is damage, appears to arise from the location of the Braes of Doune adjacent to the A9.
The results of the GIS studies are discussed on an area by area basis in later chapters. We believe these studies provide highly original and important information on the impact of wind farms on tourists.
Contact
Email: Central Enquiries Unit ceu@gov.scot