Criminal Proceedings in Scotland, 2019-20
A total of 85,726 people were proceeded against in Scottish criminal courts in 2019-20, a fall of 4% from 89,725 proceedings in 2018-19 The number of convictions was 75,251 in 2019-20, which is also a fall of 4% from 78,488 in 2018-19. This continues the general downward trend of the last ten years,
Part of
Commentary
1. Trends in people proceeded against and convicted
(Tables 1 and 2a and 2b, 4a and 4b)
Unless otherwise stated, references in this bulletin to the crime or offence group for which a person is proceeded against or convicted relate to the main charge involved. If there are multiple charges libelled on a Complaint or Indictment, and thereafter proven against an accused in a single proceeding, the main charge is the crime or offence receiving the most severe penalty (as defined in Annex C). The final column of table 4b provides counts of individual crimes or offences with a charge proven regardless of whether or not it was the main crime or offence involved. Please note that where an accused is subject to multiple separate proceedings, that accused is counted multiple times in the figures presented in this bulletin.
A total of 85,726 people were proceeded against in Court in 2019-20, a fall of 4% on 2018-19 (89,725 proceedings). The number of convictions fell at the same rate, down 4% to 75,251 from 2018-19 (78,488). This continues the general downward trend of the last ten years. It is in contrast to the rises in court activity seen between 2012-13 and 2014-15 which was a result of a short term rise in the number of motor vehicle offence cases reaching court. Convictions in 2019-20 were 35% lower than the ten-year high of 115,581 in 2010-11.
The fall in the number of convictions in the last year has been led by a fall in absolute numbers of convictions for: Unlawful use of motor vehicle down 18% to 6,285 convictions in 2019-20; drugs down 11% to 4,430; and shoplifting down 9% to 5,395. Together these 3 crimes and offences represented a large number of convictions, making up 24% of convictions in 2018-19 and 21% in 2019-20. The conviction rates for these crimes are almost unchanged.
2. Trends in conviction rates
(Tables 4a-c)
Conviction rates are calculated by dividing the number of people convicted by the number of people proceeded against. Care should be taken when interpreting data on conviction rates. Conviction rates are dependent on a number of factors, including the strength of evidence available; and the complexity of the case. However, all convictions are wholly dependent upon the decision of the fact-finder hearing the evidence in the case. A high conviction rate could indicate that cases brought to court are evidentially strong or straightforward (for example road traffic offences), but it could also indicate that cases which are evidentially weak, for instance, lacking sufficient admissible evidence are not reaching court. Conversely, a low conviction rate could indicate that the highly complex or evidentially difficult cases are brought to Court, but, the fact-finder (the judge or jury) is unwilling to accept the evidence provided by the prosecutor and thereafter unable to convict the accused.
Eighty-eight per cent of people proceeded against in court in 2019-20 were convicted after being found guilty of at least one charge (75,251 people). This is one percentage point higher than 2018-19. The conviction rate for all crimes and offences has remained relatively stable over the last decade, sitting between 86% and 88% in each year.
Conviction rates are highest for motor vehicle offences, with 94% of people proceeded against being convicted in 2019-20. In particular, speeding offences had a conviction rate of 99%. Apart from motor vehicle offences, the highest conviction rates for crimes was 94% for other crime and 93% for shoplifting, whilst the lowest rate was for rape and attempted rape (43%). The conviction rate for rape and attempted rape has been the lowest of all crimes in each of the last ten years. Further detail of acquittals with respect to rape and attempted rape can be seen in section 3.
Over the last ten years, the most notable declines in conviction rates have been for:
- Sexual assault, down 10 percentage points from 74% in 2010-11 to 64% in 2019-20, although the rate was 8 percentage points higher in 2019-20 compared to the previous year;
- Crimes associated with prostitution, down 30 percentage points from 91% in 2010-11 to 61% in 2019-20, with a decrease of 25 percentage points in the past year. These conviction rates are based on relatively small numbers of proceedings and convictions (74 proceeded against, and 45 convictions in 2019-20), so rates can be more affected by relatively small changes in these, compared to crimes with more numerous proceedings and convictions; and
- Urinating etc., decreased by 49 percentage points from 78% in 2010-11, to 29% 2019-20. As with Crimes associated with prostitution, these are based on relatively small numbers of proceedings and convictions.
3. Acquittals by crime type
(Table 2a and 2b)
When an accused person is found not guilty of a charge, or the charge is not proven, this is called an 'acquittal'. In 2019-20, 5% of people were acquitted on a 'not guilty' verdict, and 1% were acquitted on a 'not proven' verdict. A further 6% either had a plea of 'not guilty' accepted or their case was deserted by the prosecution or the Court. These proportions are broadly unchanged over the last five years.
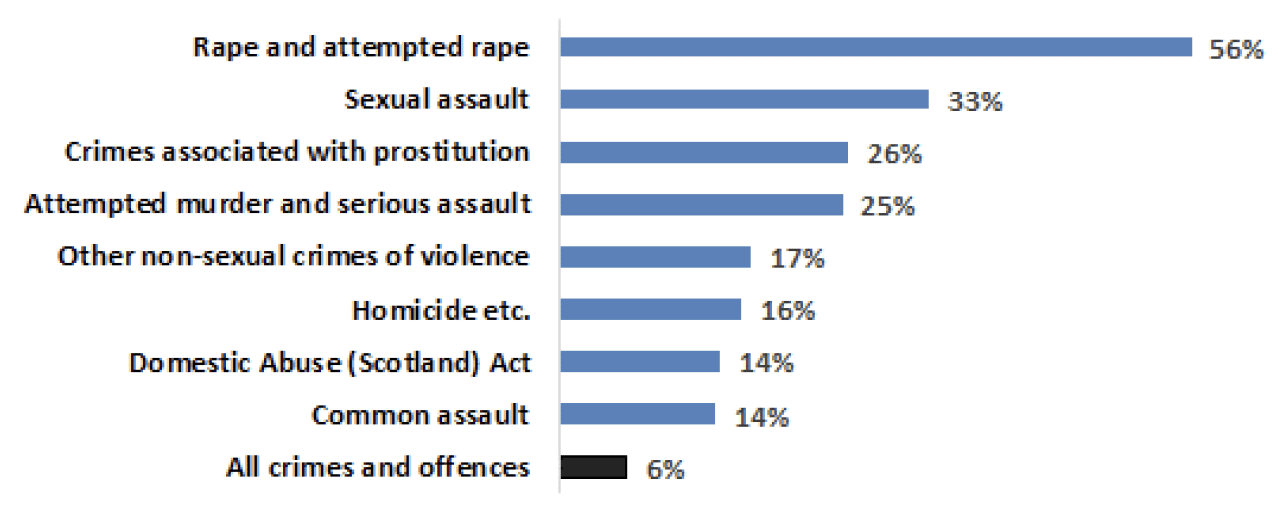
Chart 3 shows the crime types with the highest acquittal rates in comparison with the overall rate of 6% in 2019-20:
- as in previous years, the highest rate was seen for rape and attempted rape, where 56% or 169 people of the 300 proceeded against were acquitted,
- there were also high acquittal rates for sexual assault (33% had their case acquitted), and
- The highest rate of acquittals for non-sexual crimes was for 25% of cases of attempted murder and serious assault.
4. People convicted by court type
(Table 3)
There are four main court types that deal with criminal cases in Scotland.
- The High Court, which deals with the most serious crimes such as murder, rape and armed robbery. The maximum penalty that may be imposed is up to life imprisonment and/or an unlimited fine. The exact maximum in a given case will be determined by any limit provided for in the statute creating the offence being prosecuted. A single judge hears cases with a jury of 15 people.
- Sheriff Courts, which deal with the majority of cases in Scotland. These can either be solemn, where the Sheriff sits with a jury of 15 people or summary, where the Sheriff sits alone[1]. For solemn cases the maximum penalty is 5 years' imprisonment and/or an unlimited fine and for summary cases, the maximum penalty that may be imposed (in most circumstances[2]) is 1 year's imprisonment and/or a £10,000 fine.
- The Justice of the Peace courts. These deal with the less serious crimes, such as speeding, shoplifting and breach of the peace. They are chaired by a Justice of the Peace or "lay magistrate" who has been appointed from the local community and trained in criminal law and procedure. They can impose custodial sentences of up to 60 days and fines up to £2,500.
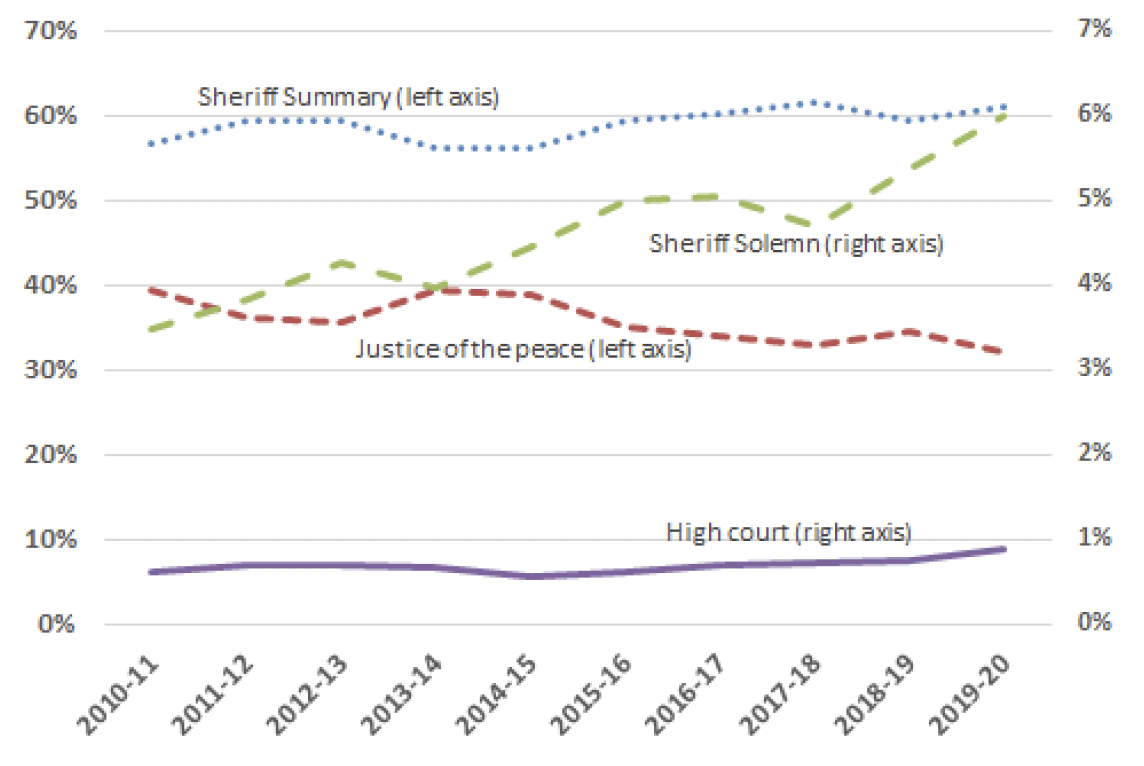
Chart 4 shows the changes in the proportion of convictions seen in each court type relative to 2010-11. Sheriff Solemn courts have risen from 3% of all convictions in 2010-11 to 6% in 2019-20. This increase in the proportion of more serious convictions is likely to be partly responsible for the increase in sentence lengths since 2010-11. The proportion of convictions in the sheriff summary increased most of any court type (by 4 percentage points), but the absolute number of convictions fell. The increase in the proportion of convictions in the sheriff summary courts is mostly due to decreases in the numbers seen in the JP courts. The proportion of cases seen in High Court has been broadly steady over the last decade, although has exhibited a slow increase in recent years.
There has been little change in the proportion seen in Sheriff Summary courts, where there were 61% of convictions in 2019-20, an increase from 59% in 2018-19, and four percentage points higher than 57% in 2010-11.
Justice of the Peace courts account for 32% of convictions in 2019-20 compared to 39% in 2010-11.
- The number of convictions in Justice of the Peace courts has fallen by 11% from 27,145 in 2018-19 to 24,179 in 2019-20. This represents a levelling of the decline which followed relatively high levels in 2013-14 and 2014-15. The long-term fall in numbers of convictions in the JP courts, reflect decreases in the number of proceedings for motor offences, which the JP courts tend to deal with.
- Convictions in Sheriff Summary courts fell by 1% from 46,542 in 2018-19 to 45,901 in 2019-20. This continues the general downward trend in sheriff summary convictions since 2010-11, but this decrease is smaller than it has been in the previous three years.
- The number of convictions in Sheriff Solemn courts increased by 7% from 4,219 in 2018-19 to 4,511 convictions in 2019-20. This is the second year in a row this has increased.
- The number of High Court convictions increased by 13% in 2019-20 to 660 convictions (from 582 in 2018-19), in part due to an increase in the numbers of convictions for attempted murder and serious assault. Over the past decade, the number of convictions in the High Court has ranged from 582 in 2018-19 to 765 in 2011-12. Please note that recording delays (see revisions in Annex revisions section) are typical for high court activity due to the complex nature of cases held there. As a result, the total number of high court convictions for the most recent year may be slightly underestimated, and will likely be revised upwards next year.
5. People convicted by crime/offence
(Tables 4a and 4b)
This publication divides breaches of criminal law into (a) crimes and (b) offences. This distinction is made only for statistical reporting purposes. Although the breaches allocated under "crimes" can generally be considered to be more serious, there are some "offences" that have more severe punishments associated with them than "crimes". The Scottish Government has recently consulted about changing the classification of some of these in response to the needs of users, and future publications may reflect the change. See Annex D for a full listing of the classification as it stands.
In 2019-20 "crimes" made up 28,033 of the total number of convictions (37%) while "offences" stood at 47,218 (63%). The decrease from 2018-19 to 2019-20 was higher for offences (down 6%) than for crimes (down 2%). Falls in convictions for crimes have been driven by reductions in the number of crimes of dishonesty (down 7% or 695 convictions). The largest contributors to this decrease were convictions for shoplifting.
Most of the decrease in convictions for offences is due to falls in the number of convictions for Unlawful use of motor vehicle (down 1,358), Breach of the peace etc. (down 452), and common assault (down 426).
6. People convicted by crime group
(Tables 4a and 4b)
Non-sexual crimes of violence
Non-sexual crimes of violence include the crimes of homicide, attempted murder & serious assault, Domestic Abuse (Scotland) Act, robbery and other violent crime. Convictions for these types of crimes increased by 21% in the past year, from 1,772 in 2018-19 to 2,142 in 2019-20. This was the only main high level crime or offence group that increased over the past year.
The increase in non-sexual crimes of violence was driven in part by new domestic abuse convictions under the Domestic Abuse (Scotland) Act 2018. This came into effect on 1st April 2019 for crimes committed on or after this date, and so are included in this bulletin for the first time. The crime under this act covers a course of behaviour which is abusive of a person's partner or ex-partner. There were 206 convictions under this act in 2019-20. This number is likely to increase in the next few years. Although this crime came into effect at the start of 2019-20, the full course of conduct has to have taken place on or after 1 April 2019. Therefore there will have been a time lag before such crimes could be reported, so this year does not effectively cover a full year under the act. Note that in the past, these crimes will often have been convicted under individual charges in other crimes or offences categories, including breach of the peace etc. (which covers stalking, and threatening and abusive behaviour) and common assault in the miscellaneous offences category. See also Table 13 that shows the number of crimes and offences that had an aggravation of domestic abuse recorded against them.
Increases in convictions for non-sexual crimes of violence over the past year, were also due to increases in the number of people convicted for attempted murder and serious assault, which rose by 11% from 1,166 in 2018-19 to 1,298 in 2019-20; and robbery, which increased by 14% from 361 to 410. The numbers of convictions for attempted murder and serious assault in 2019-20 are the highest they've been since 2011-12, and 24% higher than the ten year low of 1,053 in 2014-15. The numbers of convictions for robbery are the same as they were two years ago.
The number of homicide convictions was 81 in 2019-20, which was the same as the year before. The number of convictions for other non-sexual crimes of violence (see Annex D13 for type of crimes this includes) declined by 10%, from 164 convictions in 2018-19 to 147 in 2019-20.
Sexual crimes
The number of convictions for sexual crimes decreased slightly by 2% in the past year, after increasing in the past two years. The number of convictions was 1,204 in 2019-20, down 20 convictions from 1,224 in 2018-19. Convictions for sexual crimes in 2019-20 were 47% higher than their lowest point in the last decade, ten years ago in 2010-11 (818 convictions). The rise reflects a corresponding rise in the number of people being proceeded against in court, up 69% since 2010-11 from 1,033 proceedings to 1,700 in 2019-20.
The number of convictions for rape and attempted rape decreased by 8% (from 142 in 2018-19 to 130 in 2019-20). The figure in 2019-20, was the second highest in the past decade after 2018-19. The number of proceedings for these crimes decreased by 4% to 300 in 2019-20, from 313 in 2018-19. The conviction rate for rape and attempted rape decreased slightly this year by two percentage points to 43%. This is not indicative of an upward trend, as the conviction rate fluctuates year to year - the highest over the past ten years was 56% in 2012-13, and the lowest was 39% in 2016-17. Please note that recording delays (see revisions in Annex revisions section) are typical for high court activity due to the complex nature of cases held there. As a result the number of proceedings and convictions for rape and attempted rape for 2019-20 may be slightly underestimated.
There were 305 sexual assault convictions in 2019-20, which is very similar to the number in the previous two years (301 in 2018-19 and 300 in 2017-18). This remains a notably high number in comparison to ten years ago, with nearly twice as many as in 2010-11 (160 convictions).
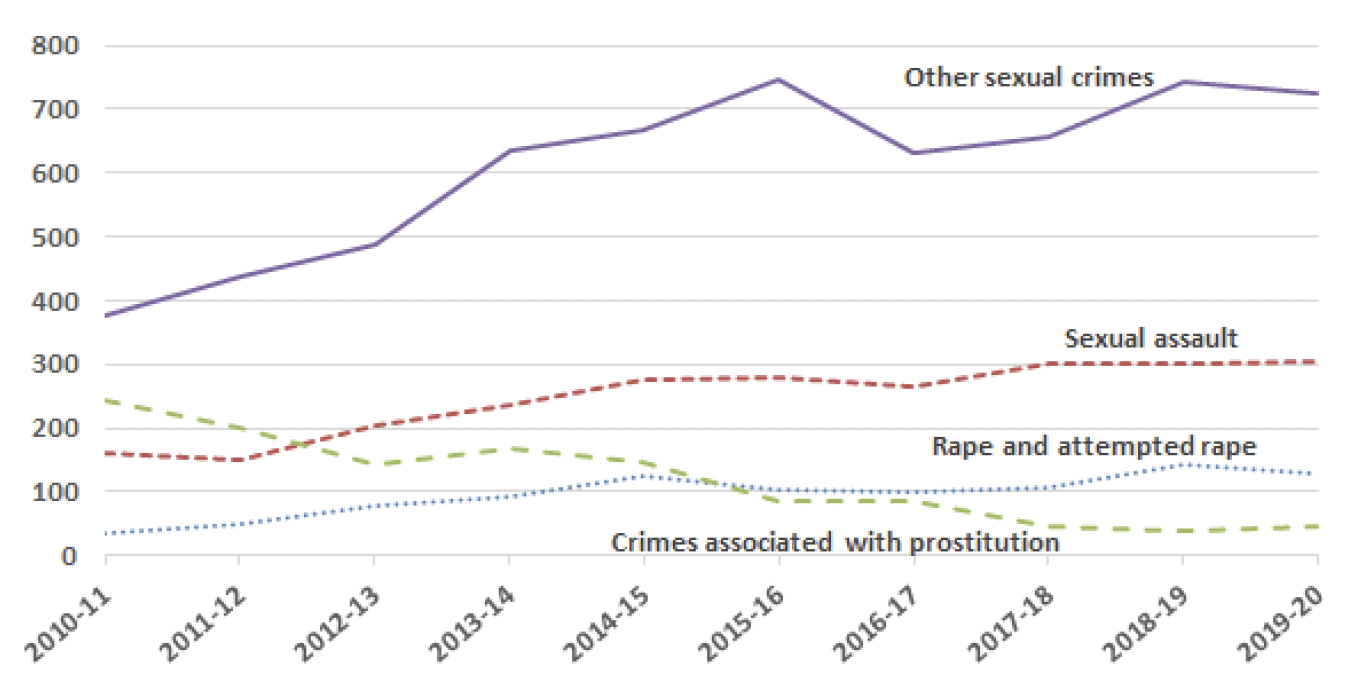
Chart 5 shows that over the last decade, other sexual crimes[3] have grown as a proportion of all convictions for sexual crimes and are the majority (60%) of all crimes in this category. The number of convictions in this category has almost doubled in the last decade, from 377 in 2010-11, to 724 in 2019-20. However, they decreased slightly in the past year by 3%, from 744 convictions in 2018-19. The long-term growth in the proportion of this crime type has been partly driven by increases in convictions for "taking, distribution, possession etc. of indecent photos of children", and for "communicating indecently". Further information can be found in the study Recorded crime in Scotland: 'Other sexual crimes', 2013-2014 and 2016-2017 which was published by the Scottish Government in 2017.
Crimes of dishonesty
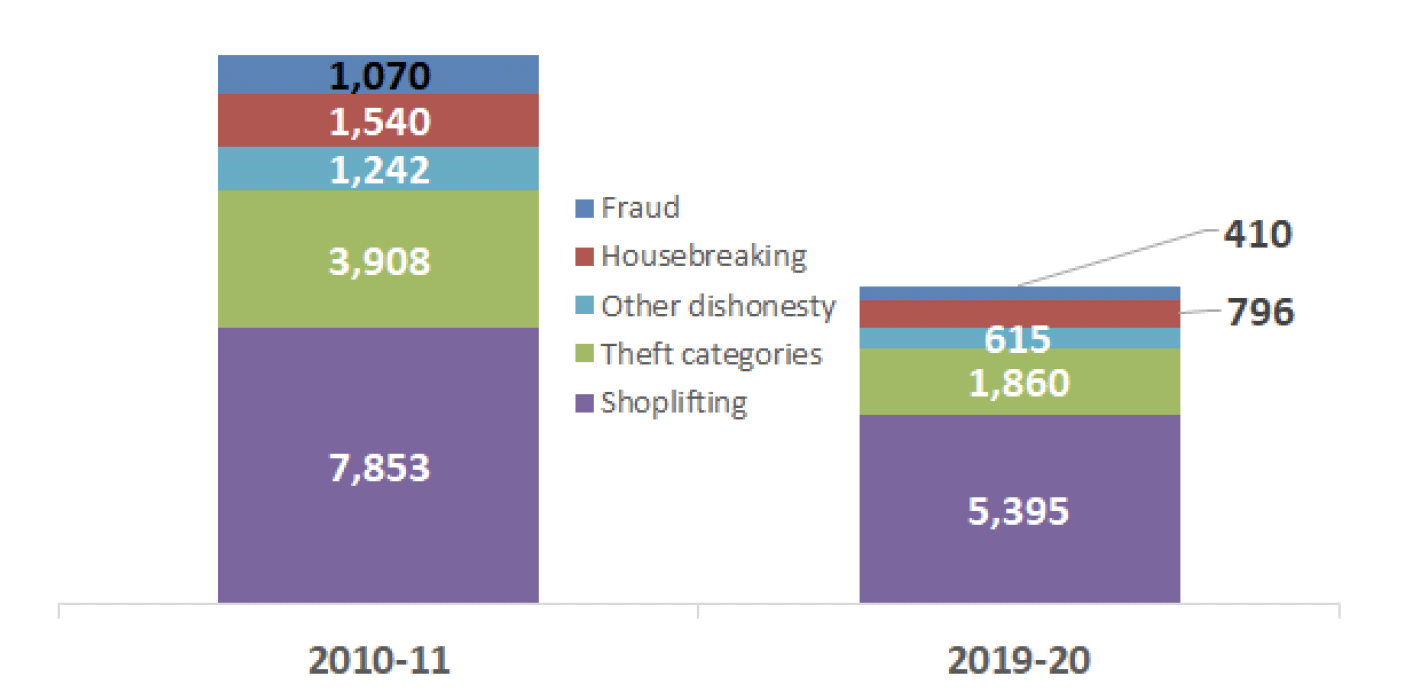
Convictions for crimes of dishonesty, as shown in Chart 6, have steadily declined in the last ten years down from 15,613 in 2010-11 to 9,076 convictions in 2019-20 (a drop of 42%).
The total number of proceedings has declined at the same rate, down 42% from 17,630 in 2010-11 to 10,149 in 2019-20.
Convictions for crimes of dishonesty declined by 7% in 2019-20, down to 9,076 convictions from 9,771 in 2018-19. Over the past ten years, convictions for crimes of dishonesty have decreased by 42% from 15,613 in 2010-11. There were declines in most crime types within crimes of dishonesty between 2018-19 and 2019-20, including:
- A 9% decrease in the number of shoplifting convictions, which is the one of the biggest decreases of any type of crime or offence in absolute numbers of convictions (-533 convictions), from 5,928 in 2018-19 to 5,395 in 2019-20. This is almost a third lower (31%) than the number of 7,853 convictions ten years ago in 2010-11.
- A 31% decrease in theft by opening lockfast place convictions from 161 to 111.
- A 19% decrease in theft from a motor vehicle convictions, from 110 to 89 convictions.
- A 10% decrease in other dishonesty and a 2% decrease in other theft.
- There was an increase compared to last year in the number of convictions for housebreaking, with a 4% increase from 765 in 2018-19 to 796 in 2019-20. The figure in 2019-20 was almost half the figure of 1,540 ten years ago in 2010-11.
7. People convicted by offence group
(Tables 4a and 4b)
There were 47,218 "offence" convictions in 2019-20. As a proportion of all offences, common assault and breach of the peace together made up 42%, while speeding and unlawful use of a vehicle accounted for 33%. There is some variation year-to-year, but in total, these offences have increased from 67% of offences in 2010-11 to 75% in 2019-20, mostly due to larger declines in convictions in other categories.
Miscellaneous Offences
Ninety-two per cent of "miscellaneous offences" are breach of the peace and common assault offences. Both groups showed decreases in convictions between 2018-19 and 2019-20, with the breach of the peace category down 4% from 11,901 to 11,449 convictions, and common assault, down 5% from 8,727 to 8,301 convictions. Both of these offences saw their highest level over the past ten years in 2015-16, but have decreased each year since then, and are now at their lowest level over the last ten years.
Motor vehicle offences
Motor vehicle offence convictions decreased by 7% from 27,504 convictions in 2018-19 to 25,680 in 2019-20. This continues the decreases seen since 2015-16 following a marked rise of 14% in 2013-14. Convictions for motor vehicle offences are 42% lower than they were ten years ago, and decreases occurred across most categories of motor vehicle offences, with the exception of dangerous and careless driving.
Most types of motor vehicle offences saw a decrease over the past year.
Crimes with the largest decreases between 2018-19 and 2019-20 were for:
- mobile phone offences, down 33% from 688 convictions to 463.
- Unlawful use of motor vehicle, down 18% from 7,643 convictions to 6,285. This is the largest decrease in absolute numbers of any type of crime or offence in the past year.
- Seat belt offences decreased by 17% from 209 to 173.
The offences which increased between 2018-19 and 2019-20 were for:
- Dangerous and careless driving, up 8% from 3,118 convictions to 3,360.
- Speeding, up 1% from 9,069 to 9,171.
The increases follow relatively low numbers of convictions for these kind of offences in 2018-19, and numbers remain below 2017-18 levels.
There were 3,385 convictions in 2019-20 for driving under the influence, which is 5% lower than the figure of 3,552 in 2018-19. This represents a decrease of more than a third (37%) in the number of convictions for this offence compared to ten years ago in 2010-11 (when there were 5,351 convictions). Most of this fall occurred in the years to 2014-15; since then there have been around 3,600 convictions a year up to before this year. It is to be noted that the alcohol limit for drivers was reduced from 80 mg to 50 mg per 100 ml blood in December 2014.
8. Headlines in court sentencing
(Tables 7 and 8)
The main types of penalty or sentence given to those found guilty in Scottish Courts are custodial sentences, community sentences and financial penalties. Sections 9-12 provide statistics on these types of punishments. In addition, for less serious cases or where it is felt the main punishment types are not suitable, the individual found guilty can be "admonished" (given a verbal warning from the sheriff). A full listing of the range of court disposals is outlined in Annex D.
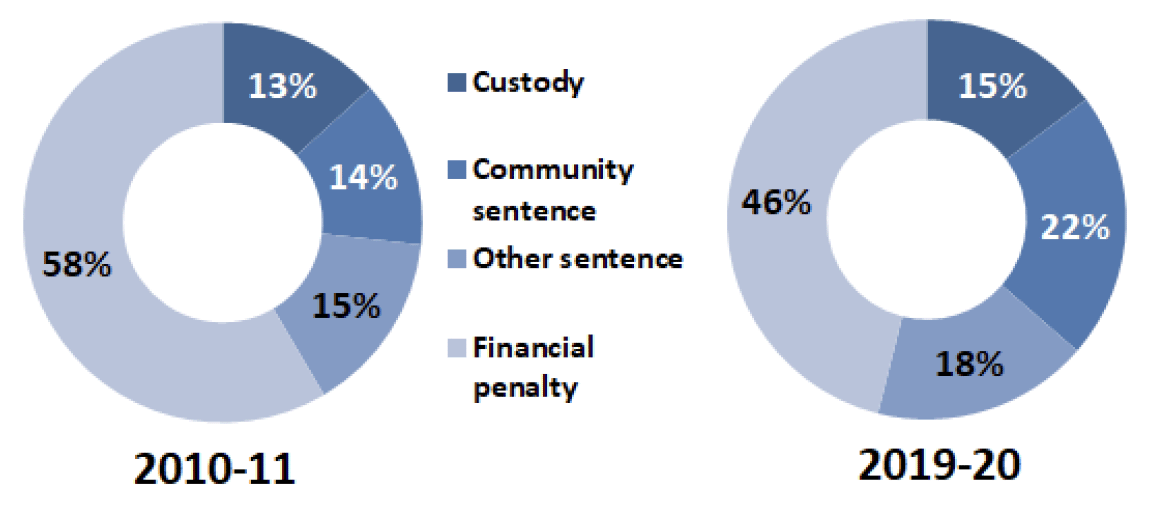
Of all people convicted during 2019-20:
- 46% were issued financial penalties (34,661)
- 22% were issued community sentences (16,296), and
- 15% were issued custodial sentences (11,101).
- A further 18% of people were issued other sentences (13,193), which are mostly admonishments.
Percentages are rounded to nearest whole percent.
9. Custodial Sentences
(Tables 7a-b, 8a-c, 9 and 10a-d)
Custodial sentences comprise convicted people who are sent to prison or a young offenders' institution. The number of custodial sentences given is affected by a range of factors, including the number of convictions in any given year and the types of crimes for which people are being convicted.
Courts will consider the full facts and circumstances of a case before deciding an appropriate sentence in a given case. This includes whether or not the offender has been convicted before and whether there are any mitigating circumstances. These statistics do not take into account the factors influencing the sentencing decisions.
The number of custodial sentences, decreased by 9% from 12,221 in 2018-19 to 11,101 in 2019-20. The number of custodial sentences has decreased every year since 2011-12 (15,950) , with the exception of an increase in 2018-19. The number of custodial sentences is more than a quarter lower (28%) than it was ten years ago in 2010-11. Custodial sentences represented 15% of all convictions in 2019-20, similar to the proportion over the past decade, which has ranged between 13% and 16%.
There has been an increase in the number of people receiving custodial convictions for non-sexual crimes of violence in past year, increasing by 7% from 1,030 to 1,107. This reflects the increase in the number of convictions for violent crimes in the past year, but the percentage of people convicted for non-sexual crimes of violence who received a custodial sentence decreased from 58% to 52%.
The number of people convicted for sexual crimes who received a custodial sentence decreased from 474 to 425 in the past year, and the percentage of people convicted for non-sexual crimes of violence who received a custodial sentence also correspondingly decreased from 39% to 35%.
Most crimes and offences saw a decrease in the number of people given a custodial sentence.
Extended sentences and Supervised Release Orders
Extended sentences and supervised release orders are for offenders who have served time in prison but have an additional post-release supervision period attached to their sentence (see Annex D for more details). There has been a slight increase in their use this year (from 455 in 2018-19 to 472 in 2019-20). This combined total issued has remained between 415 and 539 per year since 2010-11.
Please note these statistics only give the length of the custodial part of the sentence and not the length of the supervision period. We have incomplete information on the length of the supervision period on our dataset, and we are working to understand and improve the quality of the data before we can consider publishing it.
Length of custodial sentences
All but one of the 41 people issued life sentences in 2019-20 received these for murder[4]. When a court imposes a life sentence, a minimum period in custody, called the "punishment part", is set by the court before the prisoner can be considered for release on licence by the parole board. "On licence" means that a life prisoner is subject to recall to prison if they breach the terms of their release in their lifetime.
Average custodial sentence
Note that life sentences and Orders for Lifelong Restriction (OLRs) are not included in calculations for average life sentence as they are of indeterminate length. Although a minimum term in custody is specified, the actual time in custody will depend on decisions by the Parole Board and they may spend longer in custody than the minimum specified. Data on the average length of the punishment part of life sentences and OLRs are published in an experimental statistics paper alongside this bulletin, which can be found under the "supporting documents" menu on the website for this publication.
The average length of custodial sentences for all crimes, in 2019-20 was almost a year (356 days), which is 9% longer than in 2018-19 (326 days). This is the biggest increase in the past ten years, and reflects fewer short sentences being imposed, rather than more longer sentences (see next section). This may, in part, reflect the presumption against short sentences extension from 3 months or less to 12 months or less on the 4th July 2019. However, it is too early to attribute any changes in sentencing patterns to the extension. Over the longer term, there has been a general upward trend in average sentence length, and it is now 29% longer than in 2010-11 (277 days).
Some types of crimes and offences saw increases in average sentence length in the last year, whereas others saw decreases. Notable increases between 2018-19 and 2019-20 have been increased lengths of sentences for "other crime" (increasing by 203% from 531 days to 1,607 days), which may reflect a decrease in the use of short custodial sentences for some crimes in this group; attempted murder and serious assault (increasing by 16% from 927 days to 1,074 days); and sexual assault (increasing by 23% from 822 days to 1,008 days). The latter two crimes have fluctuated year to year over the past ten years.
A decrease in average sentence length over the past year was seen for rape and attempted rape (decrease by 8% from 2,655 days to 2,445 days), which is the lowest since 2014-15. Other notable decreases include fraud (down 19% from 356 days to 290 days), vandalism (down 16% from 209 days to 175 days), and "other dishonesty" (down 14% from 213 days to 183 days).
Categories of custodial sentence length
The Criminal Justice and Licensing (Scotland) Act 2010 commenced in February 2011 and introduced a presumption against short sentences (PASS) (3 months or less). This presumption states that a court must not pass a sentence of imprisonment for a term of 3 months or less unless it considers that no other method of dealing with the person is appropriate.
In June 2019, the extension of the presumption to 12 months or less was approved by the Scottish Parliament in the Presumption Against Short Periods of Imprisonment (Scotland) Order 2019. This came into force on 4th July 2019 in relation to offences committed on that date and after. However, the policy was introduced part way through the financial year, and it would take time for the first eligible offences to go to court, so there are still likely to be a signicant number of convictions in 2019-20 that were not covered by the extension. Although initial effects of this policy may be seen to some extent in these statistics in the 2019-20 financial year, subsequent versions of this bulletin will be able to come to more definitive conclusions. The Extended Presumption Against Short Sentences – Monitoring Information Official Statistics also provide data on sentencing to monitor the progress of the extension policy.
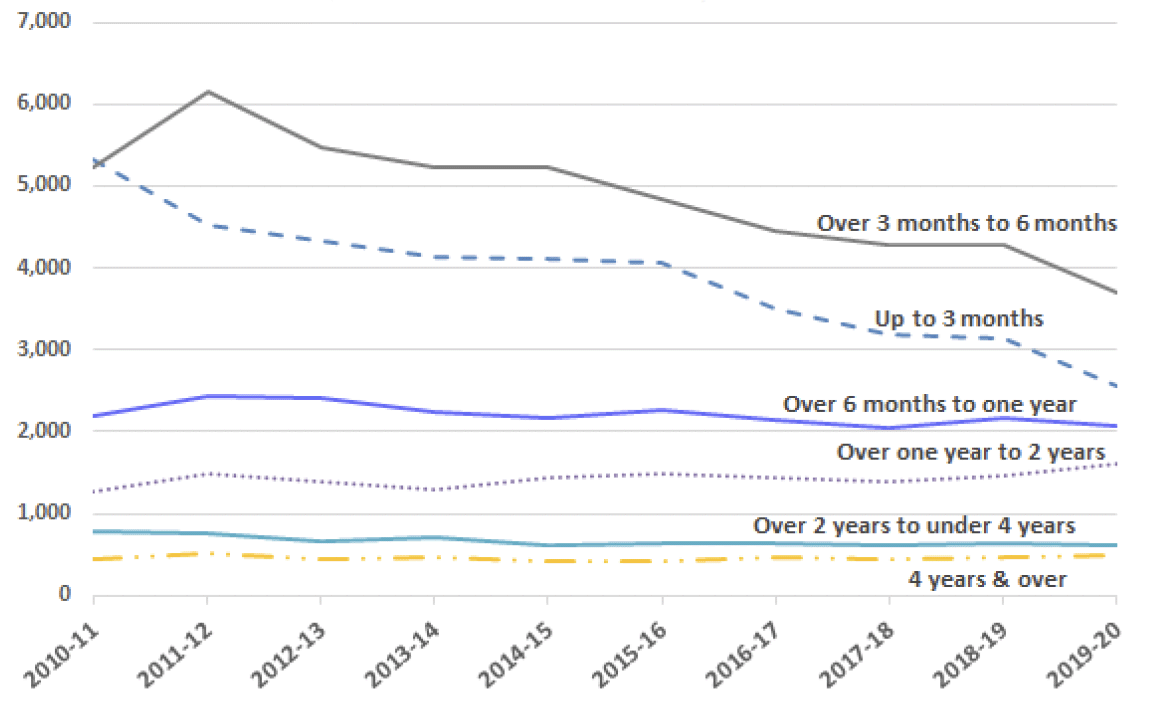
Chart 8 illustrates patterns of custodial sentence length by specific categories. In 2010-11, the most common lengths were "up to 3 months" (5,332 people), which made up 35% of custodial sentences and "over 3 months to 6 months" (5,229 people, 34% of custodial sentences). Over the ten-year period, levels of sentences of "up to 3 months" decreased, and made up 23% of custodial sentences in 2019-20. The biggest decrease seen in the proportion of sentences of "up to 3 months" was in 2011-12 (seven percentage point reduction) which was the first full year after the presumption against short sentences of under 3 months was introduced. The percentage of "over 3 months to 6 months" out of all custodial sentences was broadly similar in 2019-20 (33%) as it was in 2010-11 (34%), but the percentage went up to a high of 39% in 2011-12, perhaps as a result of up tariffing of sentences in response to the presumption against shorter sentences of 3 months or less starting in 2011.
Sentences of 1 year or less made up 75% of all custodial sentence lengths in 2019-20. This is eight percentage points lower than it was ten years ago in 2010-11, when they represented 83% of all custodial sentences. The biggest decrease in the percentage was in the past year between 2018-19 and 2019-20, with a four percentage point reduction, which may be associated with the extension of the presumption to one year. Note that this recent decrease was mostly due to decreases in the number of shorter sentences, particularly under three months, rather than an increase in sentences over 1 year (see below).
Figures show that:
- The number of custodial sentence of "up to 3 months" decreased by 19% in the past year, from 3,139 in 2018-19 to 2,551 in 2019-20, and is less than half the number ten years ago (5,332 in 2010-11).
- Custodial sentences of "over 3 months to 6 months" decreased by 14% in the past year, from 4,285 to 3,704. Numbers reached a high of 6,153 over the past ten years in 2011-12, in the first full year after the introduction of a presumption against sentences of 3 months or less.
- There were 2,069 sentences of "over 6 months to 1 year" in 2019-20 which was a 4% decrease from 2,161 the previous year. The numbers of this length of sentence has been relatively similar over the past few years.
- the number of custodial sentences "over 1 year to 2 years" has increased over the past two years, and was at its highest number over the past ten years in 2019-20. The number increased over the past year by 9% from 1,469 to 1,600.
- The number of custodial sentences of "2 years to under 4 years" has declined from 776 in 2010-11 to 625 in 2019-20. Since 2014-15, the numbers have been relatively similar with small year to year fluctuations.
- "4 years and over" has changed little over the last ten years, from 455 in 2010-11 to 486 in 2019-20.
10. Custodial Sentences by type of crime
(Tables 9 and 10a-d)
Custodial Sentences for Non-sexual Crimes of Violence
Homicide comprises murder, culpable homicide (i.e. unlawful killing but without intent to do so) and the statutory crimes of causing death by dangerous or careless driving, causing death by careless driving when under the influence of drink or drugs, driving illegally when involved in a fatal accident and corporate homicide.
Eighty-three percent, or 67 of the 81 people convicted of homicide in 2019-20 were given a custodial sentence, a ten percentage-point increase on the 2018-19 figure of 73%. During the period from 2010-11 to 2013-14, the proportion of homicide convictions receiving custodial sentences was more than 80%. Since then, it has been between 69% and 73%, until this year when it was more similar to levels prior to 2014-15. Causing death by careless driving crimes are more likely to receive non-custodial sentences than other types of homicide. In 2019-20, 16% of homicide convictions were for death by careless driving, but 93% of non-custodial sentences for homicide were for death by careless driving.
Eighty-two percent of custodial sentences for homicide were life sentences imposed for murder (40 people), an increase compared to 2018-19 (76%, 35 people). The remainder, who were convicted for other types of homicide, were given an average sentence of around six years and three months (2,297 days), two weeks (15 days) less than in 2018-19 (2,312 days), and similar to most years in the last decade.
The average sentence length for the newly introduced domestic abuse crime under the Domestic Abuse (Scotland) Act was about a year (363 days) in 2019-20.
Changes in average custodial sentence lengths for other non-sexual crimes of violence between 2018-19 and 2019-20 are as follows:
- An increase of 16% (147 days) for attempted murder and serious assault (an average of 1,074 days given on average in 2019-20);
- A decrease of 6% for robbery (down 45 days, to 752 days); and
- An increase of 11% for other non-sexual crimes of violence, (up by 104 to 1,071 days), this makes it the longest average length for this crime category in the last decade. This is a relatively small group, with a total of 35 people receiving a custodial sentence in 2019-20, and the average is therefore more variable.
Custodial Sentences for Sexual Crimes
As shown in Chart 9, custody was the most frequently used disposal for "rape and attempted rape", being imposed on 98% of people with a charge proven. Custodial sentences for "rape and attempted rape" attracted the longest average custodial sentence of all crime types (other than life sentences for murder, which are excluded from the homicide category in the chart). The average sentence length for this kind of crime decreased in 2019-20, down 210 days (8%) from last year to 2,445 days (six years and 8 months). Last year was the highest average sentence for rape and attempted rape of the last ten years, and this year was the lowest since 2014-15.
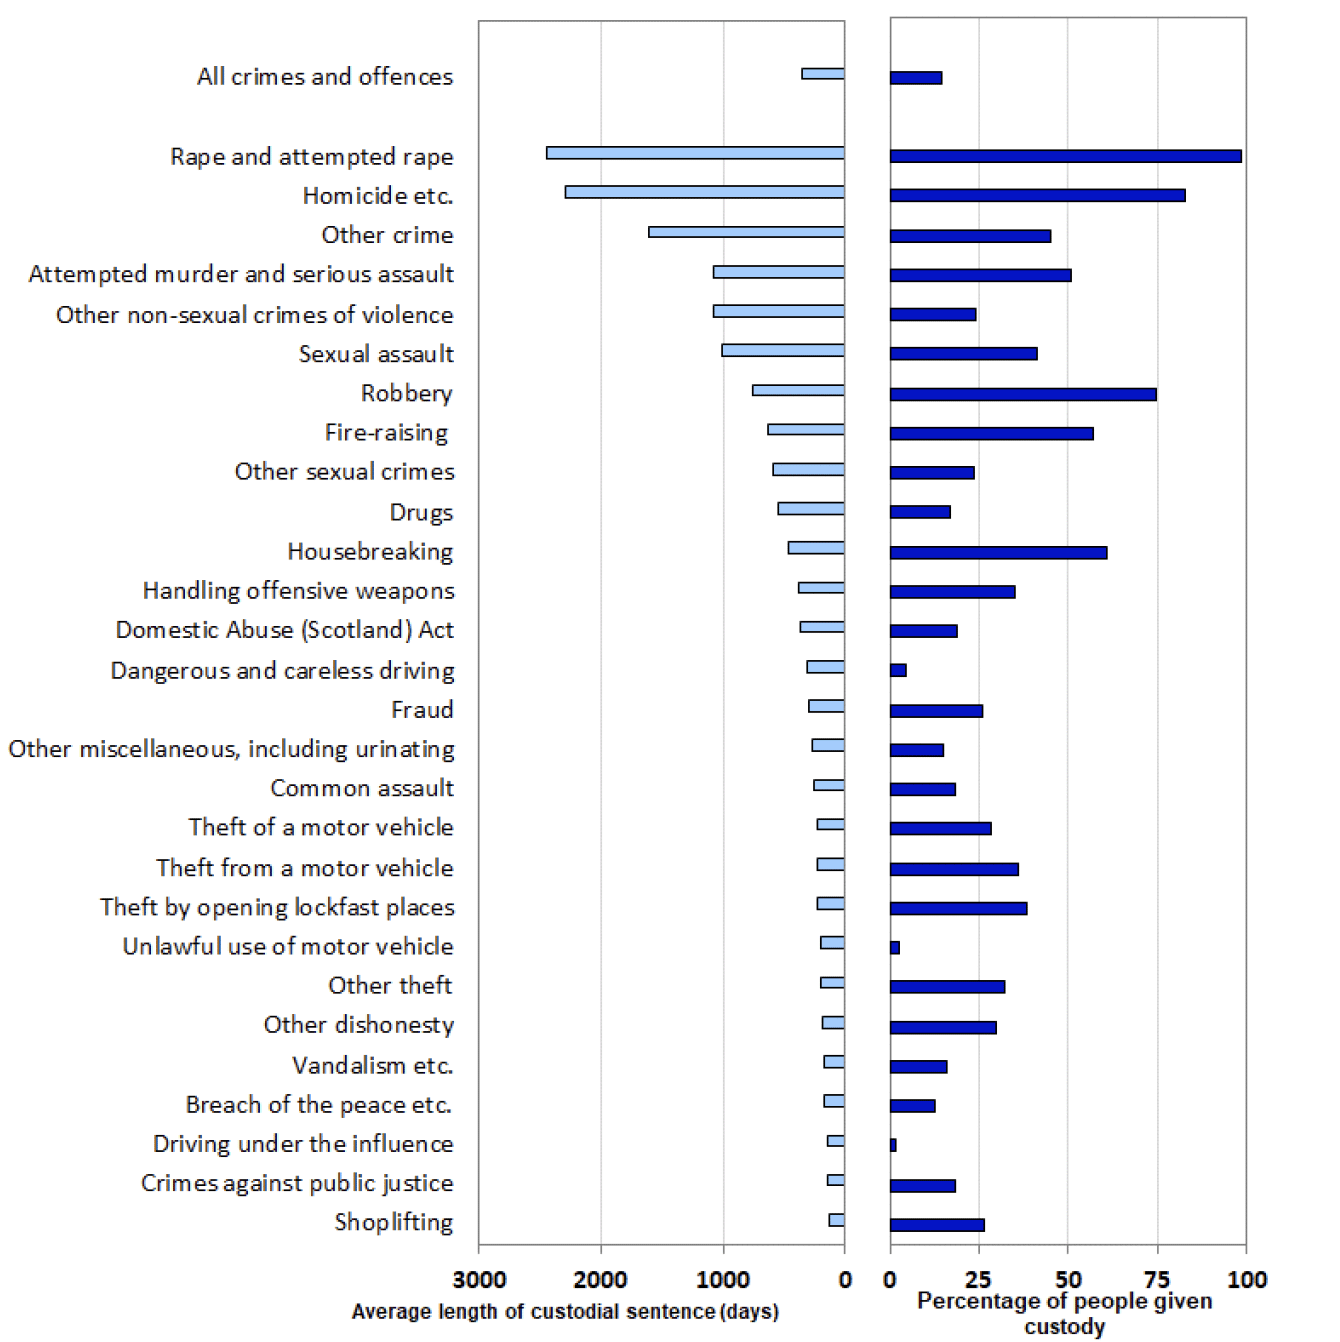
1. - Excludes crime types where the number of people sentenced to prison is fewer than 30.
Sexual assault sentences were, on average, 186 days (23%) longer than in 2018-19, increasing to 1,008 days (around 2 years and 9 months) in 2019-20. This is the highest average sentence for this crime since 2015-16.
Custodial Sentences for Crimes of Dishonesty
Thirty one percent of convictions for crimes of dishonesty received a custodial sentence in 2019-20, a decrease from 35% in 2018-19, but similar to most years over the past ten years. Overall, the average custodial sentence length for crimes of dishonesty increased from 190 days in 2018-19 to 208 days in 2019-20; an increase of 9%. This is back to a similar level in 2017-18 and is 54 days longer (35%) than in 2010-11 when the average was 154 days. The average length of custodial sentence increased for all crimes groups within the wider crimes of dishonesty over the past ten years.
Around 61% of housebreaking convictions received custodial sentences in 2019-20, down five percentage points from 2018-19. In 2019-20, the average custodial sentence for housebreaking was about a year and three months (457 days), a 51 day (13%) increase from 406 days in 2018-19. The average sentence length is almost double the figure ten years ago in 2010-11 (255 days).
Custodial Sentences for Handling Offensive Weapons
Sections 47 and 49 of the Criminal Law (Consolidation) (Scotland) Act 1995 make provision for the offences of:
- Carrying offensive weapons;
- Having in a public place an article with a blade or point.
These two offences make up the crime group "handling offensive weapons", statistics for which are presented in the standard tables accompanying this publication. As shown in Table A, there were 1,735 people convicted of "handling offensive weapons" in 2019-20, of which almost two-thirds (64%) were for carrying knives i.e. "having in a public place an article with a blade or point" (1,107 convictions). Compared to last year these changes represent increases of 10% for both categories; but numbers of convictions are 29% lower for handling offensive weapons, and 15% lower for carrying knives, than they were in 2010-11. The remainder of offensive weapons convictions related to crimes for other weapons such as baseball bats, bottles and pieces of wood. Firearm offences are not included in the "handling offensive weapons" category but are included within "other miscellaneous offences".
Statistics for carrying knives are not published separately in the standard tables accompanying this bulletin but are presented below alongside trends for all "handling offensive weapons".
| 2010-11 | 2018-19 | 2019-20 | ||
|---|---|---|---|---|
| "Handling offensive weapons" (as published in tables 4b, 9 and 10c) Having in a public place an article with a blade/point or carrying other offensive weapons. | Number convicted | 2,445 | 1,579 | 1,735 |
| % receiving a custodial sentence | 31% | 38% | 35% | |
| Average custodial sentence (days) | 289 | 359 | 376 | |
| Knife offences only: "Having in a public place an article with a blade or point" | Number convicted | 1,308 | 1,009 | 1,107 |
| % receiving a custodial sentence | 37% | 41% | 38% | |
| Average custodial sentence (days) | 313 | 382 | 395 |
The proportion of convictions for handling offensive weapons which received a custodial sentence decreased by three percentage points to 35% in 2019-20, but was four percentage points higher than in 2010-11. The proportion of custodial sentences given specifically for knife offences has also decreased in the past year by three percentage points to 38%, which was also slightly higher than the 37% in 2010-11).
As seen in Chart A below, there has been a shift in the age profile of persons being convicted for handling offensive weapons since 2010-11. In 2010-11, 33% of convictions were in the over-30s group, and 34% were for people under 22 years of age. We now see more than half (53%) of all offensive weapon convictions in the over 30s, and under a fifth (17%) for those aged under 22, 3% being for under-18s.
The average custodial sentence length for handling offensive weapons is 30% higher than it was in 2010-11, increasing from 289 days in 2010-11 to 376 days in 2019-20. The figure in 2019-20 was also 5% higher than 359 days in 2018-19. The trend over the last ten years is broadly similar for knife offences only, with the average custodial sentence length being 5% longer than that of all handling offensive weapons at 395 days in 2019-20.
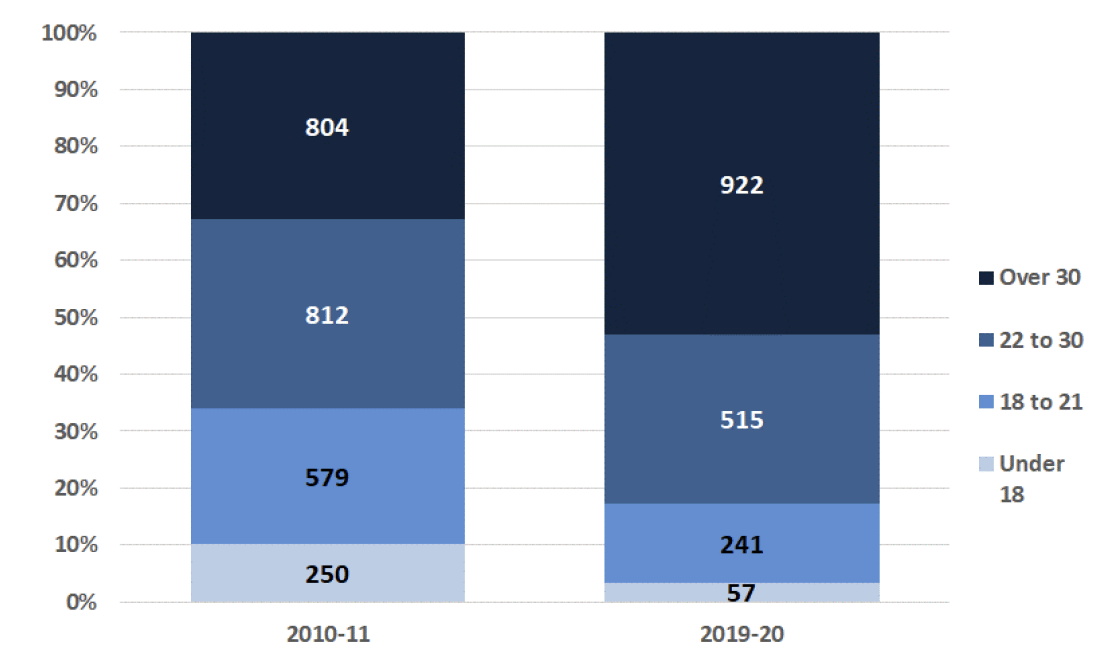
Numbers on bars are numbers of convictions.
11. Community Sentences
(Tables 7a and 7b and 8a-c)
Community sentence is a collective term for the different sentences given by courts that are served in the community, often as an alternative to a custodial sentence. Community sentences consist of requirements, such as unpaid work, being supervised by a social worker, or being restricted to their home at certain times. There is a wide range of options available in the Scottish courts, which are listed at Annex D.
Twenty-two percent (or 16,296) of all convictions in 2019-20 resulted in a main penalty of a community sentence. This is the highest proportion over the past ten years, up from 14% of convictions in 2010-11, and from 19% last year. There was a 7% increase in the number of community sentences the past year, up from 15,211 in 2018-19, driven by increases in the use of Community Payback Orders and Restriction of Liberty Orders. The increase in the numbers and proportion of community sentences may in part be associated with the extension of the presumption against short sentences in July 2019. However, it is too early to attribute any changes in sentencing patterns to this extension.
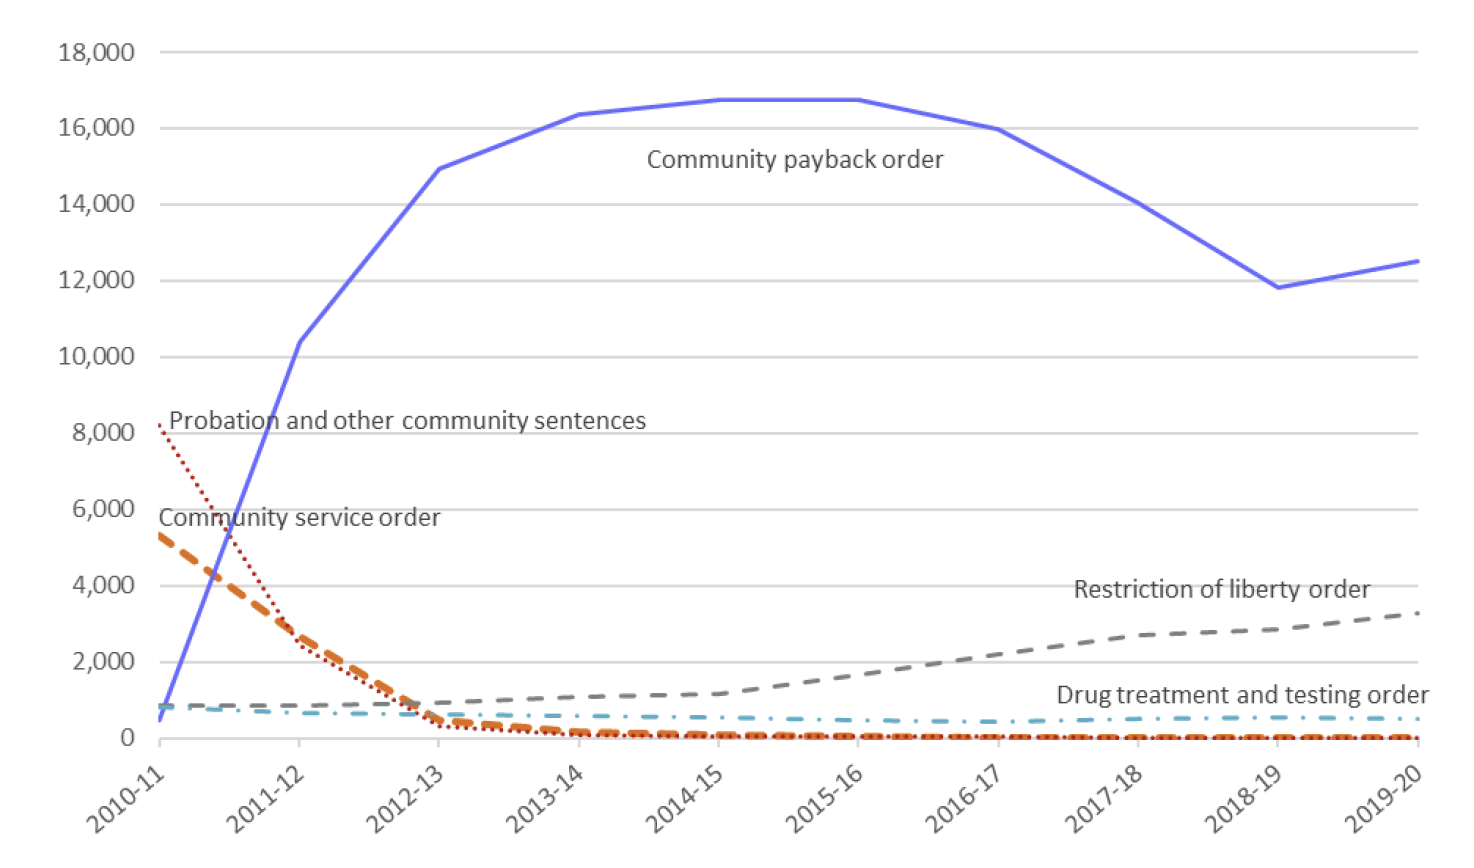
Community Payback Orders (CPO) enable the courts to impose a range of requirements including unpaid work and supervision as well as being put through a programme of rehabilitation to address their behaviours (see Annex D for full details). CPOs replaced probation and community service orders for offences committed on or after 1st February 2011. This is reflected in the statistics, as the number of people receiving CPOs rose sharply between 2010-11 (461 CPOs) and 2013-14 (16,375 CPOs). Numbers increased by 6% from 11,812 in 2018-19 to 12,530 people in 2019-20; and represented 77% of all community sentences in 2019-20 (compared to 78% the previous year). This is the first year the number of CPOs has increased, after decreasing for three consecutive years.
A Restriction of Liberty Order (RLO) is a court order that requires a person to remain within a location, usually their home, at times specified by the Court. A person's compliance with the order is monitored electronically. The number of RLOs increased by 15% in the past year, from 2,848 in 2018-19 to 3,261 in 2019-20. The use of RLOs has increased each year over the past 10 years, increasing from 1% of people convicted in 2010-11 to 4% of people convicted in 2019-20. RLOs made up 20% of people receiving community sentences in 2019-20 (3,261 RLOs), up slightly from 19% in 2018-19. Please note that these statistics on RLOs will not match the statistics published by G4S, the Scottish Government's contractor for electronic monitoring. This is because the statistics in this publication are representative of the main charge in a set of proceedings and will not include RLOs issued for secondary charges. By contrast the G4S figures count all RLOs issued by the courts relating to all charges.
Drug Treatment and Testing Orders (DTTOs) are designed to reduce or stop offending by addressing problem drug use through the provision or access to a closely monitored treatment programme. The number of DTTOs decreased by 7% from 529 in 2018-19 to 493 in 2019-20. Numbers have been relatively similar in recent years, but are 39% lower than ten years ago in 2010-11 (806 DTTOs).
Community sentences are available for courts to use in any case where the offence is punishable by imprisonment (with the exception of charges which attract mandatory life sentences). The majority of community sentences were given for breach of the peace (3,290 or 20%), common assault (2,854 or 18%), and crimes against public justice (2,069 or 13%).
In 2019-20 the crimes/offences where community sentences were most commonly given for that type were:
- other sexual crimes – 457 people, or 63% of court disposals for these crimes
- Domestic Abuse (Scotland) Act - 126 people or 61%
- sexual assault – 159 people, or 52%
- other non-sexual crimes of violence – 68 people, or 46%
- theft from a motor vehicle – 40 people, or 45%
- theft of a motor vehicle – 85 people, or 43%
- handling offensive weapons – 713 people, or 41% of court disposals
12. Financial penalties and other sentences
(Tables 7a-b and 8a-c)
The Courts can impose financial penalties such as fines, which are enforced by the Scottish Courts and Tribunals Service (SCTS), or compensation orders, which are collected by the SCTS with the monies then paid to the victim. A victim surcharge came into force in Scotland on 25 November 2019 under the Victims and Witnesses (Scotland) Act 2014 which can apply to a person who is convicted and fined. For statistics on victim surcharges, see the SCTS Quarterly Fines Statistics.
The number of financial penalties has been in general decline over the last ten years, dropping from 67,576 in 2010-11, when they accounted for 58% of all disposals, to 34,661 in 2019-20 (46% of all disposals). Numbers have continued to decline in the latest year, down by 7% from 37,283 in 2018-19. This is possibly because the types of cases that would have historically attracted a financial penalty are now more likely to be dealt with non-court disposals before they get to Court (see Police disposals and COPFS disposals section).
The median[5] fine imposed by Courts on individuals (excluding companies) in 2019-20 was £240, in cash terms[6]. The median fine has increased by a third (33%) over the last 10 years, up from £180 in 2010-11.
The use of compensation orders as a main penalty has remained almost unchanged for the last three years, with 791 people receiving them in 2019-20. Numbers are more than a quarter (27%) lower than in 2010-11 (1,084). The median value for compensation orders was £250 in 2019-20, which is higher than the value of £190 ten years ago, but lower than the highest of £290 in 2017-18. Please note that compensation orders can be given as an additional punishment to a single offence and hence the median is based on either the main or secondary penalty for specific offences, although this still only refers to the main offence.
Other sentences
"Other sentences" are mostly admonishments (95% in 2019-20), which are a verbal warning from the sheriff. In 2019-20, 12,504 people were admonished, which represented 17% of all convictions. This is slightly higher than the 14% in 2010-11, although has remained almost unchanged since 2015-16. In 2019-20 the crimes for which admonishments were most commonly given for (where there were more than 1,000 convictions overall) were:
- crimes against public justice with 34% of all convictions being admonishments (2,564 convictions)
- shoplifting with 33% (1,783 convictions)
- breach of the peace etc. with 27% (3,109 convictions) , and
- common assault with 19% (1,586 convictions)
13. Aggravations
(Table 12 and 13)
Codes can be recorded on the Criminal History System (CHS) by Police Scotland or the Crown Office and Procurator Fiscal Service (COPFS) to provide additional information relating to the nature of a charge. Some of these codes (aggravations) are created by legislation. Although aggravations must be proved in court they can be proven by a single source of evidence, rather than by corroborated evidence. For example, someone who commits a common assault which is motivated by malice towards the victim as a result of the victim's religion would have their offence recorded under assault with an aggravation code of religious prejudice. The statutory aggravations are taken into account during sentencing, and a higher penalty may be given as a result.
Other aggravations are not created by legislation, but are identifiers added to a charge to provide additional information for operational purposes. These do not need to be proved in Court.
This publication includes statistics on a subset of the full set of aggravation/identifier codes on the CHS. The set of aggravations this publication covers are: domestic abuse, disability, racial, religious, sexual orientation and transgender. The legislation creating these aggravations is outlined in Annex C. The Abusive Behaviour and Sexual Harm (Scotland) Act 2016 created a statutory aggravation of domestic abuse, which came into force on 24th April 2017. The aggravation for domestic abuse in relation to a child under the Domestic Abuse (Scotland) Act 2018 came into effect on the 1st April 2019, so this is first year data has been presented on this aggravation.
Please note that statistics on statutory bail aggravations, which identify offences that were committed while the offender was on bail, are not included in this publication but are published alongside this bulletin, under the "supporting documents" menu on the website for this publication.
Statistics on aggravations
Please be aware that a single proceeding can have more than one aggravation recorded against it e.g. "domestic" and "disability". In these cases, the same proceeding would be counted twice in the aggravation tables but once in the other court tables.
Domestic abuse
The new statutory domestic abuse aggravation, used for the first time in 2017-18, was applied to 8,120 or 87% of convictions with a domestic identifier in 2019-20 – it is never applied to a proceeding without the non-statutory identifier, but it is not applied to convictions for the domestic abuse crime under the Domestic Abuse (Scotland) Act. The number of convictions with a statutory domestic abuse aggravation in 2019-20 was 5% higher than the number of 7,751 in 2018-19.
In 2019-20 the vast majority of people convicted of an offence with a domestic abuse statutory aggravation were male (7,243 convictions or 89%). This proportion has been identical since it was introduced.
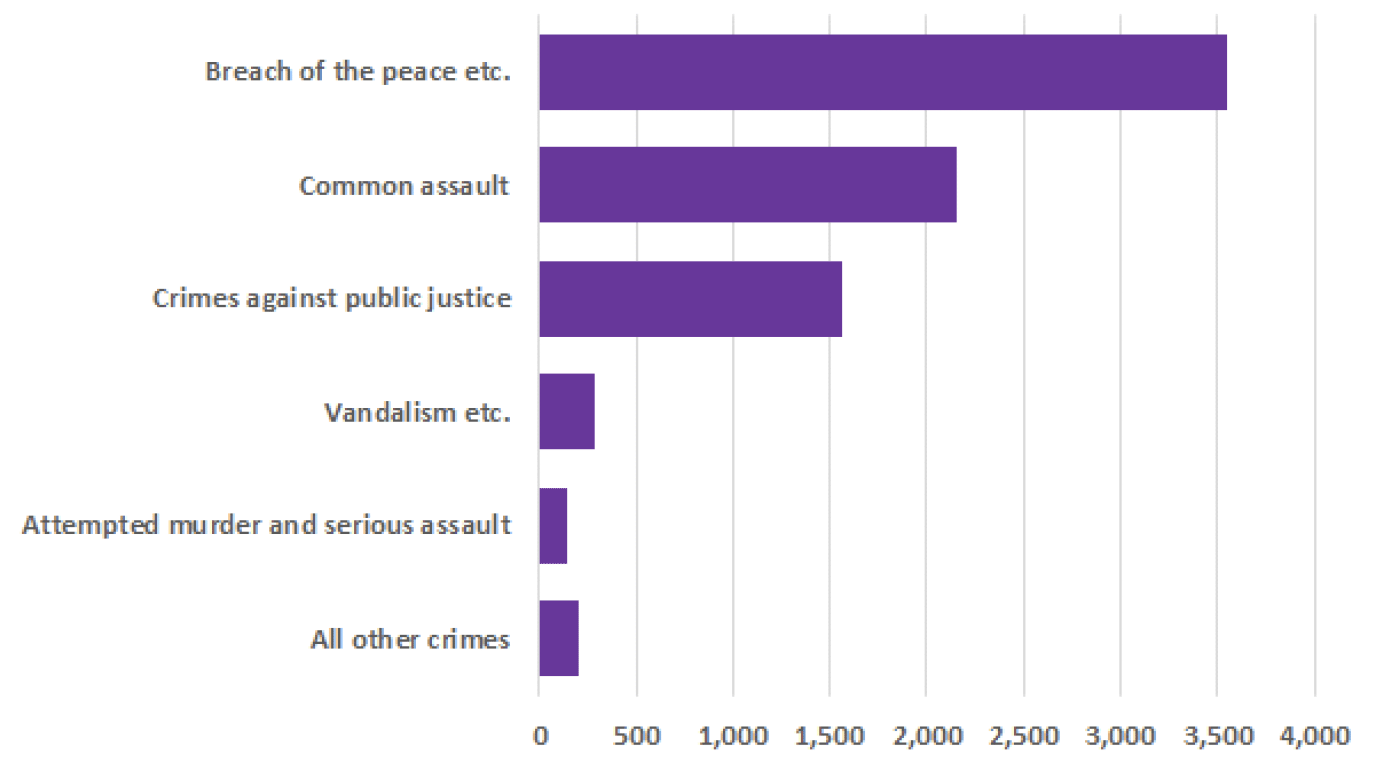
In 2019-20 the most common crime types (see Chart 11) with a domestic abuse statutory aggravation that people were convicted of were:
- breach of the peace, which made up 44% of domestic abuse convictions (3,547 convictions) – of these breach of the peace-type convictions, the vast majority of convictions were for offences of "threatening or abusive behaviour" (3,172), with the others for stalking (345) and breach of the peace (30);
- common assault (26% or 2,151 convictions); and
- crimes against public justice (19% or 1,560 convictions).
There were 9,355 convictions with a domestic abuse identifier in 2019-20, a 2% increase from 2018-19 (9,205 convictions). This is the first year this has increased after decreases each year from 2015-16 onwards. The highest level over the past ten years was 12,441 in 2014-15 and the lowest was 8,566 in 2010-11.
Note that the introduction of the new domestic abuse crime under the Domestic Abuse (Scotland) Act in 2019-20 may have affected the number of convictions with a domestic abuse identifier or statutory aggravation. This crime covers a course of conduct. Before the introduction of the crime, this may have resulted in multiple convictions for different offences at different times, whereas now they may result in a single conviction (with a more severe penalty). COPFS' Domestic Abuse and Stalking Charges 2019-20 Statistics on the number of charges reported to them showed that the percentage of charges for stalking with a domestic abuse identifier fell from 72% in 2018-19 to 65% in 2019-20.
Domestic abuse in relation to a child
There were 38 people with a conviction with a statutory aggravation for domestic abuse in relation to a child in 2019-20, which is the first year of data. This is only applied to the crime of domestic abuse under the Domestic Abuse (Scotland) Act. This number is likely to increase in the next few years as this covers a course of conduct that has taken place on or after 1st April 2019. Therefore there will have been a time lag before such crimes could be reported, so this year does not effectively cover a full year under the act.
Other aggravations
After the domestic abuse aggravation, the next most common types of aggravations recorded in 2019-20 were:
- racial (595 convictions);
- sexual orientation (420 convictions); and
- religious (230 convictions).
The number of convictions with a sexual orientation aggravation increased by 19% in the past year, and are the highest level in the past ten years in 2019-20. There was also an increase in the past year for convictions with a religion aggravation by 12%, but the 2019-20 figure was the second lowest in the past ten years. Convictions with the racial aggravation were 6% lower than last year, and were at their lowest level in the past 10 years. Disability aggravations in 2019-20 were at a similar level (87) compared to last year (89). Convictions with a transgender aggravation were higher than last year, but are relatively low and tend to fluctuate year to year, due to the small numbers recorded (14 in 2019-20).
14. Age and Sex
(Tables 5a-c, 6a-b, and 11)
Sex in this bulletin is generally based on a person's physiology as perceived by a police officer, rather than self-identified gender, and is recorded when a person's details are entered into the CHS. Sex may be different to that recorded at birth if a person has a Gender Recognition Certificate. In a small number of records sex will be recorded as unknown if a clear understanding of the sex of the individual is not known. See Annex D for further details.
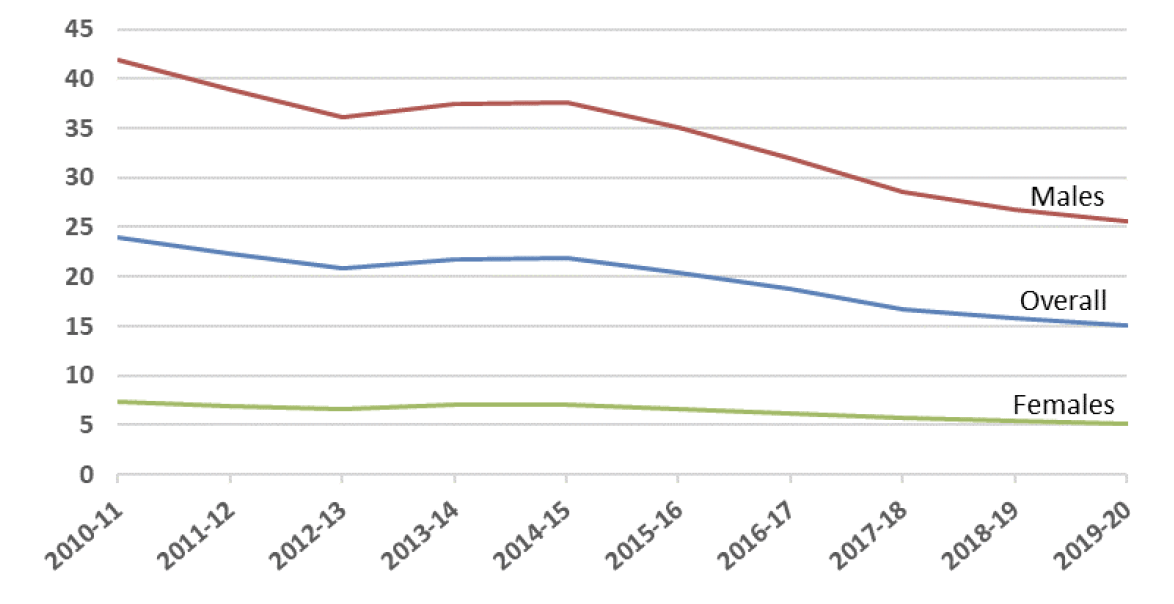
In 2019-20 there were 15 convictions per 1,000 population. There were more convictions for males at 26 convictions per 1,000 population compared to five for females.
The overall number of convictions per 1,000 population has declined over the last ten years from 24 convictions per 1,000 population in 2010-11. The decline has been driven by a decrease for males, down from 42 convictions per 1,000 population in 2010-11 to 26 in 2019-20. The number for females has been consistently much lower than for males, but also shows an overall decline, from seven to five convictions per 1,000 population between 2010-11 and 2019-20.
Over the past 10 years, the gap between the number of convictions per 1,000 population for younger people compared to older people has become smaller. This has been driven by a fall in the number of convictions per 1,000 population for younger people, especially younger men. For people aged 31-50, the number has been on a more gradual downward trend over the last decade.
In 2010-11, the age group with the highest numbers of convictions per 1,000 population was those aged 18-20, with 62 convictions per 1,000 population. Since then, this has changed. In 2019-20, the highest number of convictions per 1,000 population was for the 31-40 age group overall (32 per 1,000), the 21-30 age group also showing a similar 31 convictions per 1,000 population.
Convictions by sex/age and crime type
Males accounted for 83% of all convictions in 2019-20, a similar proportion as each year in the past ten years. More males than females were convicted in all crime/offence categories.
Whilst females accounted for 17% of all convictions, they accounted for relatively higher proportions of convictions for the following crime types in 2019-20:
- 46% (67 convictions) of other non-sexual crimes of violence. The vast majority of these were for "cruelty to and unnatural treatment of children" convictions;
- 34% (138 convictions) of all fraud convictions; and
- 32% (10 convictions) of all drunkenness and other disorderly conduct convictions.
Compared to older people, a larger proportion of convictions for people under 21 are for crimes against public justice and common assault. For example, about a quarter of convictions (26%) for females under 21 were for common assault with the corresponding figure for males being 13%. By contrast common assault accounted for smaller proportions of convictions for both men and women aged over 40 (9% and 10% for males and females respectively).
Convictions for motor vehicle offences accounted for higher proportions of convictions for those aged over 40; 41% of males, and 44% of females convicted. This compares to the under 21 age group where 24% of males and 23% of females were convicted of motor vehicle offences.
Sentencing by sex and age
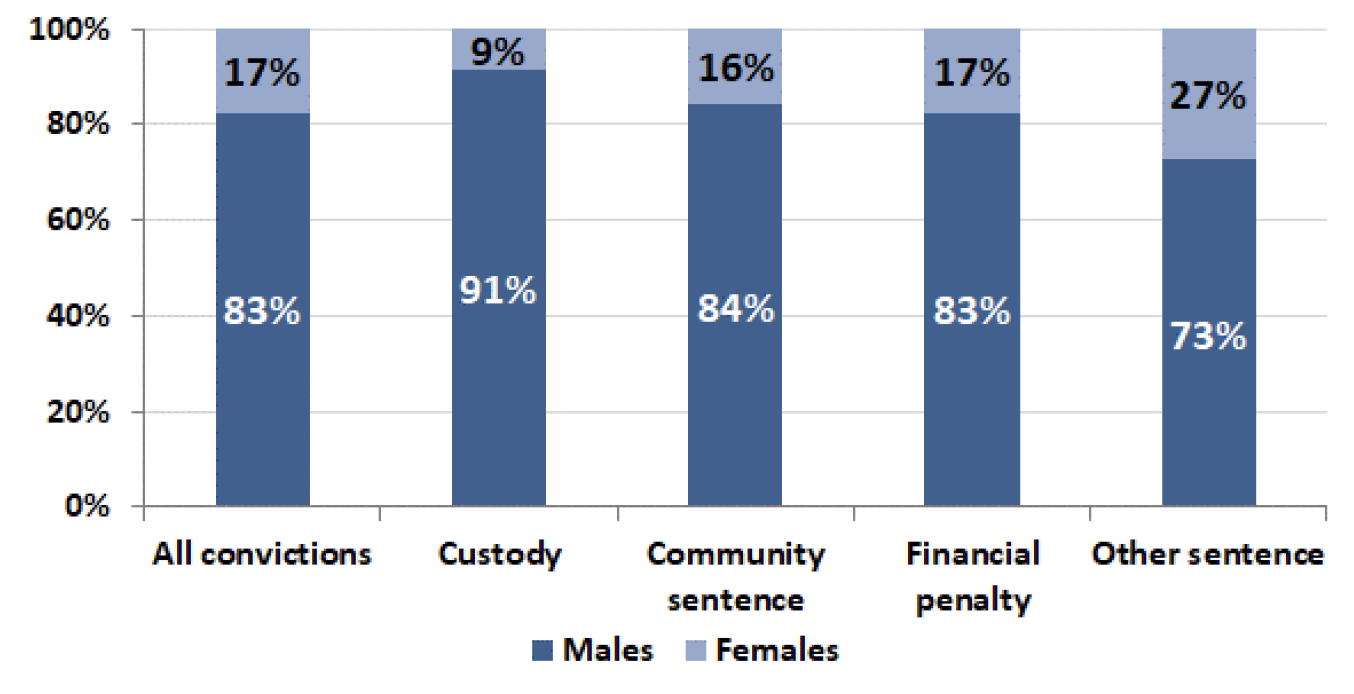
Overall, males are more likely to receive a custodial sentence than females. This is illustrated by males accounting for 83% of all people convicted in 2019-20 but representing a higher proportion of all custodial sentences (91%). Females were more likely to be issued with an "Other sentence" (which are mostly admonishments) with 27% of these types of punishments having been given to females compared to the 17% of all convictions that females represent.
Please note that sentencing decisions are reflective of a number of factors such as the severity of the crime and whether the individual has offended in the past. In addition, the decision on what type of punishment is reasonable will be based on the personal circumstances of the offender. These statistics do not take account of these factors. The Reconviction Rates in Scotland National Statistics present analyses on the last sentence received in a financial year, by the number and type of previous crimes and sentences.
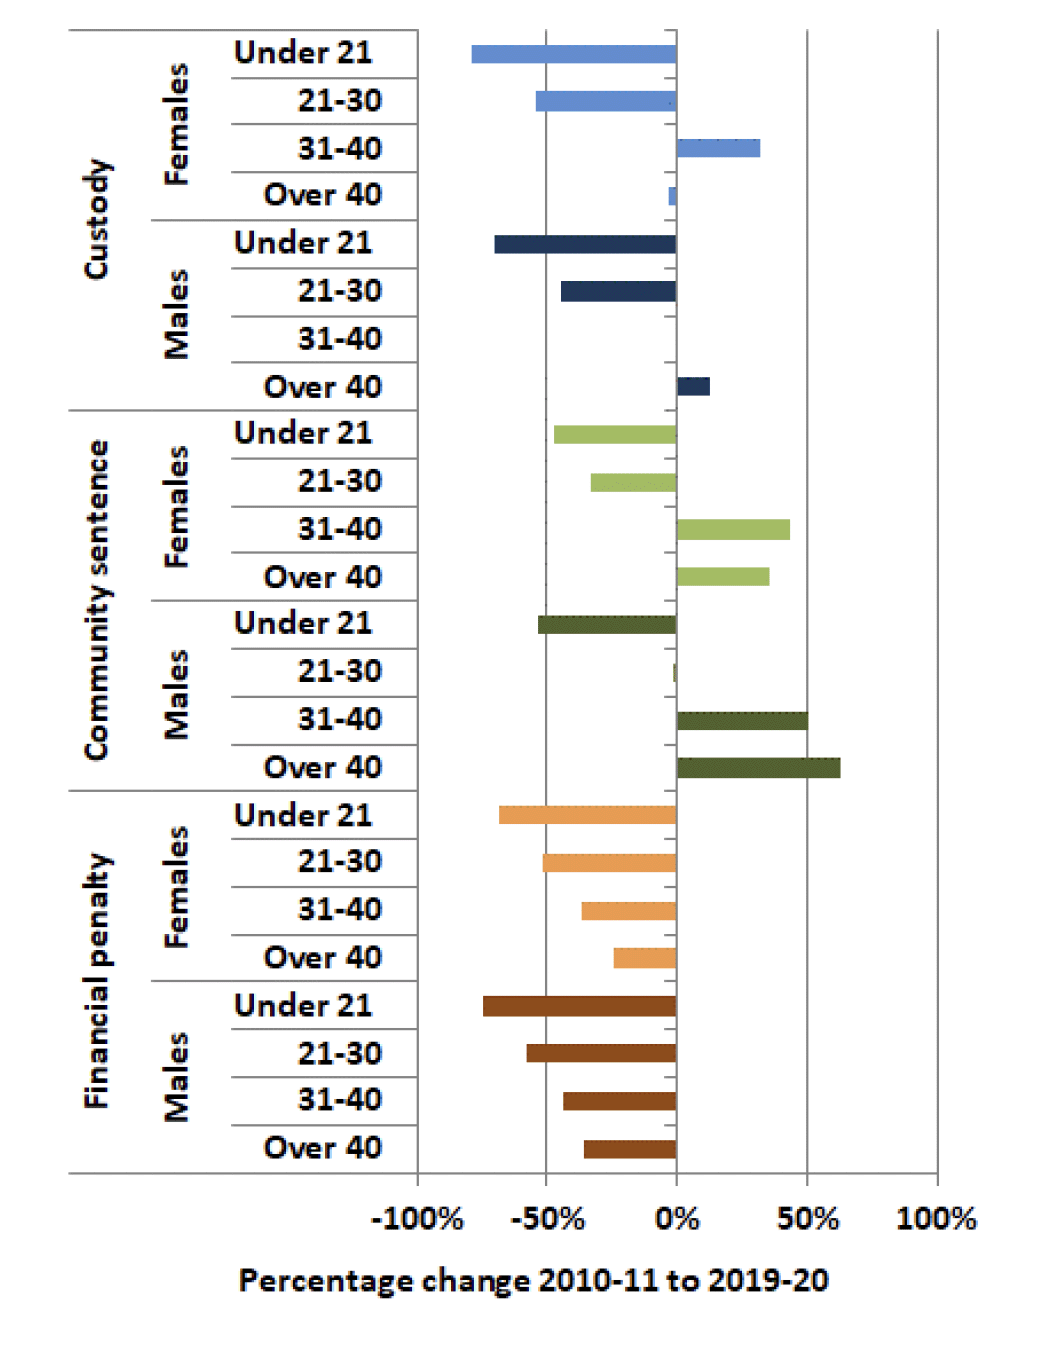
Table 11 illustrates different patterns by age and sex over the last ten years. Chart 14 above summarises the main changes between 2010-11 and 2019-20.
- There are falls in the total numbers of convictions across every sentence type. This fits with the overall fall in convictions, although the largest and most consistent falls are seen in financial penalties.
- Financial penalties are the only disposal types where the trend is in decline for all age-sex groups, with the largest decreases being for younger age groups.
- With respect to custodial sentences, numbers for males and females have fallen by 28% and 27%, respectively. There have been notable decreases of 70% for males under 21 and 79% for females under 21.
- Community sentences have seen an increase of 4%, decreases are seen in the under-30s, the over-30s are increasing, with a similar pattern in males and females. The number of community sentences had decreased each year since a high over the past ten years in 2015-16. However the number of community sentences increased by 7% in the past year, which may be associated with the extension of the presumption against short custodial sentences to 12 months or less that was introduced in July 2019.
15. Police Disposals
(Tables 17 - 20)
This section outlines detail on some of the measures available to the police for dealing with minor offences rather than referring individuals to COPFS and therefore potentially to court. Statistics are presented on Recorded Police Warnings (RPW), Anti-Social Behaviour Fixed Penalty Notices (ASBFPNs) and actions used specifically for juveniles (aged 8 to 17) such as Restorative Justice Warnings and Early and Effective Interventions (EEI). Formal Adult Warnings were phased out following the introduction of RPWs in January 2016.
In 2010-11, there were 64,171 police disposals, this increased to a peak in the last 10 years of 68,289 in 2013-14. Since 2013-14 numbers have generally decreased, (although they increased in 2018-19) and the number in 2019-20 was 34,631, which is 49% lower than the number in 2013-14.
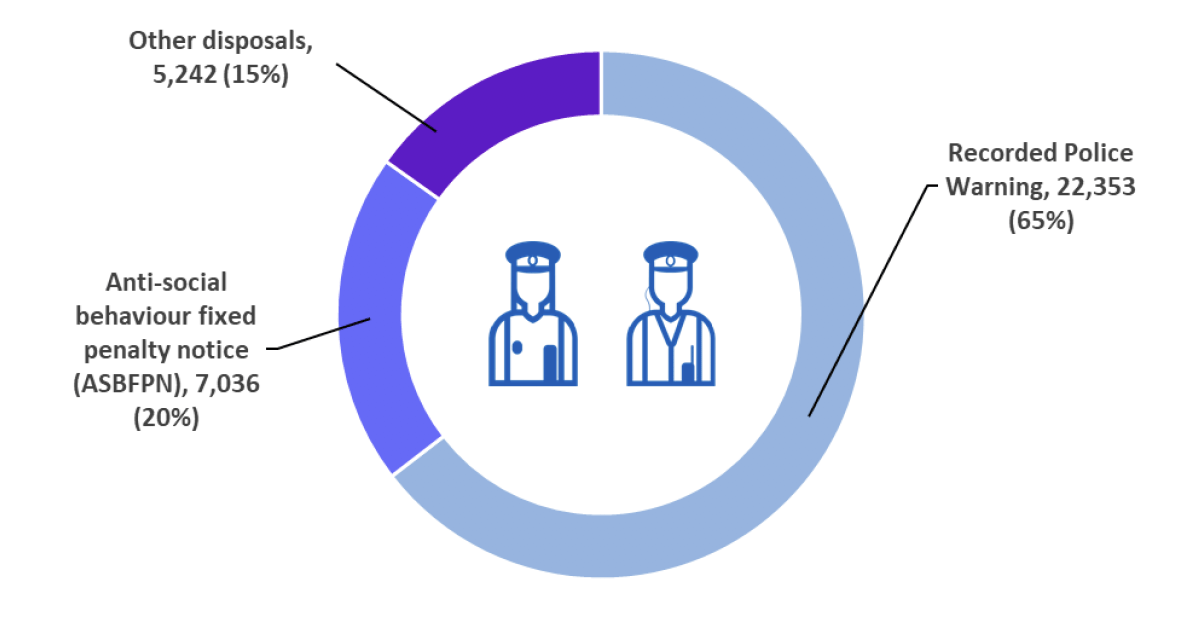
ASBFPNs accounted for more than 85% of the police disposals presented in this publication in 2010-11, but the number has been declining after 2013-14, and they now make up only 20% of police disposals this year. The most used police disposal in 2019-20 (65%) is now the Recorded Police Warning which was introduced in 2015-16. It is important to note, however, that there are other types of police measures not included in these statistics such as fixed penalty notices for moving motor vehicle offences and other youth justice measures. A more detailed listing of the disposals available in this publication can be seen in Annex D.
Recorded Police Warnings
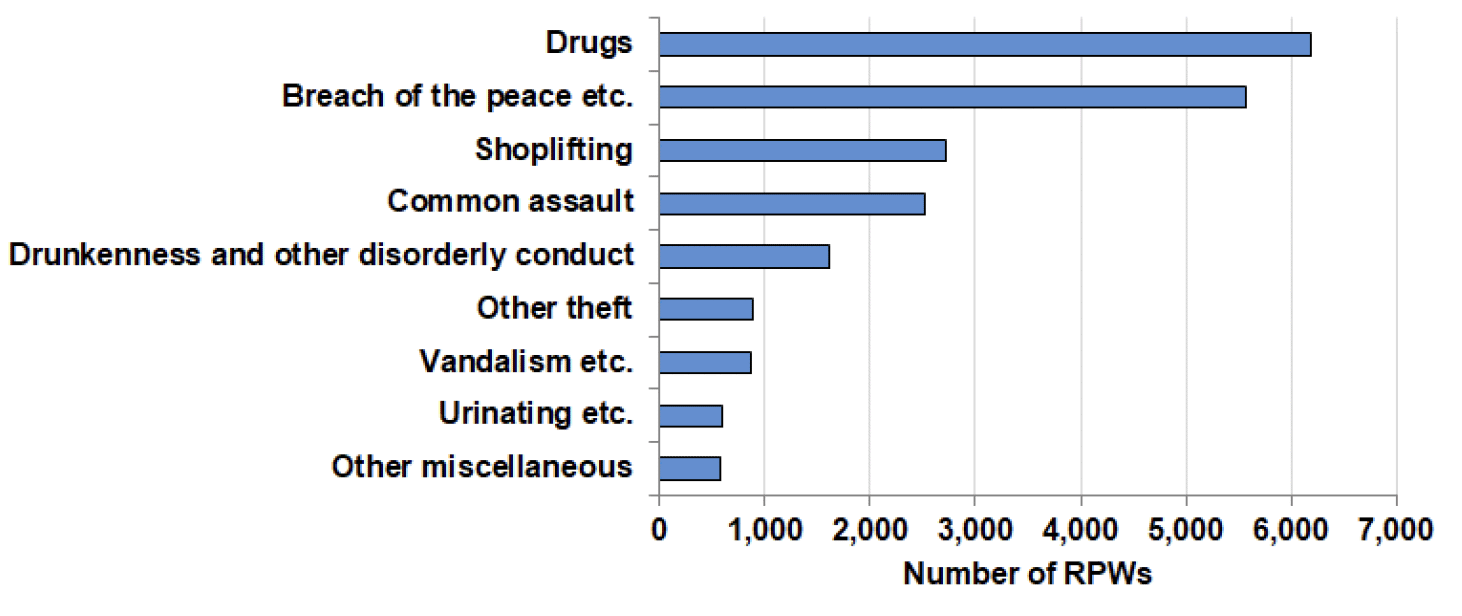
The use of Recorded Police Warnings (RPWs) grew quickly after their introduction in January 2016, becoming the most used police disposal in 2016-17 (19,678 issued). In 2019-20 there were 22,353 issued, which is a small increase of 1% from 22,108 in 2018-19.
RPWs were issued in 2019-20 for a wide range of offences, such as drugs (which made up 28% of the total number issued in 2019-20), breach of the peace etc (25%), and shoplifting (12%). Males received 72% of all RPWs in 2019-20.
The introduction of RPWs coincided with the phasing out of Formal Adult Warnings (FAWs), although wasn't a direct replacement. Only 18 FAWs were recorded in 2019-20, and they should disappear completely in the near future.
From 16 July 2018, it became possible to issue RPWs for less serious, non-sexual common assault, and this use made up 11% of the total number of RPWs in 2018-19.
Anti-Social Behaviour Fixed Penalty Notices
Anti-Social Behaviour Fixed Penalty Notices (ASBFPNs) allow the police to issue offenders a £50 fine for a range of offences including drunken-related behaviours and playing loud music. In 2019-20, 7,036 people received an ASBFPN as a main penalty, a decrease of 21% from 8,893 in 2018-19. Levels have decreased for the fifth year in a row after a period of relative stability between 2010-11 and 2013-14 (around 55,000 ASBFPNs per annum). Some of the decline may be due to Police Scotland issuing revised guidance around the use of ASBFPNs, and there may be also some displacement by the use of Recorded Police Warnings.
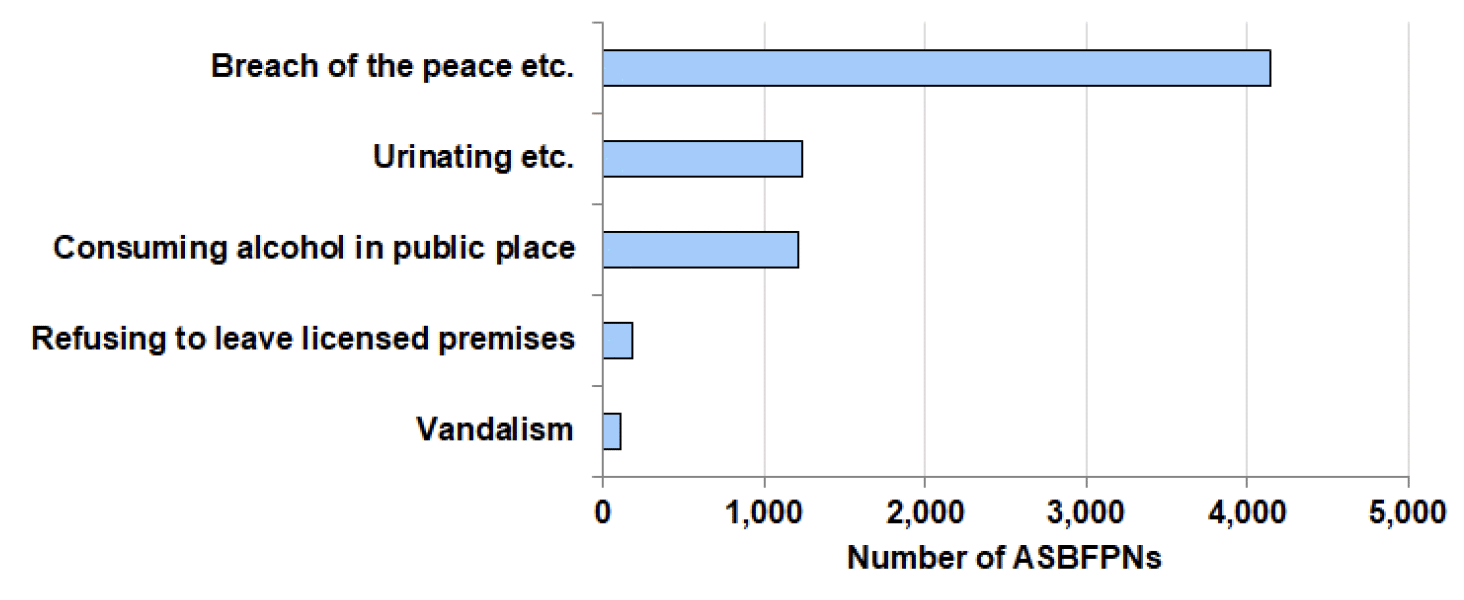
In 2019-20 the vast majority of ASBFPNs were issued for three offence types:
- 4,142 for breach of the peace (59% of total);
- 1,236 for urinating etc (18%); and
- 1,219 for consuming alcohol in a public place (17%).
Males received 83% of all ASBFPNs in 2018-19 (5,834 people) with the most common offences being for breach of the peace etc. (56% of ASBFPNs issued to males) followed by urinating etc. (20%). ASBFPNs issued to females (1,483 people in total) were primarily issued for breach of the peace (74% of ASBFPNs to females) and consuming alcohol in a public place (14%).
Police disposals for children and young people involved in offending
This section provides statistics on some of the police disposals that specifically target children and young people, under the age of 18, involved in offending. The disposals we have information for are Early and Effective Interventions (EEIs) and Restorative Justice Warnings as recorded on the Criminal History System (CHS).
Please note that these statistics are not a full measure of disposals for under-18s as there are a number of other measures managed by the police and other public bodies that we cannot quantify levels for.
There are a number of routes for dealing with young people who have offended in Scotland as follows:
- The Whole System Approach (WSA) is increasingly used to deal with young people aged 8 to 17. Following the preventing offending framework in 2008 and a WSA pilot in 2010, this approach was rolled out across Scotland in 2011 to encourage justice partners to channel young people away from the adult courts and hearing system. One approach used by the police to respond to the needs of children who offend is Early and Effective Intervention (EEI). Early and Effective Intervention is a multi-agency response to low level offending, typically offences of a less serious nature, which might previously have automatically resulted in referral to the Children's Reporter. The EEI process runs differently in each Local Authority and the involvement of the police can be different in each Local Authority. For these reasons, the statistics presented here should be seen as a minimum indication of EEI activity.
- Other young people are referred to the Scottish Children's Reporter Administration (SCRA), which manages the Children's Hearing system. This is a needs based system, including responding to occasions when children offend, rather than exposing them to the adult courts, which can be a damaging experience. The police can use a number of ways to refer individuals to SCRA such as restorative justice warnings, the disposal for which statistics are available. It is important to note that other organisations such as COPFS, social work and educational bodies can also make referrals to SCRA, though such referrals are not included in the statistics in this report, and can be found elsewhere[7].
- Depending on their age and the nature of the offence some young people who have offended move through the Criminal Justice System in the same way as adults i.e. they are issued a disposal by the police, COPFS or the adult courts. This tends to happen for young people accused of more serious crimes with activity for these cases included within the statistics elsewhere in the report. No one under the age of 12 can be prosecuted in the adult courts in Scotland.
- The focus of EEIs is to respond as quickly as possible to offending behaviour by children and young people and to put in place appropriate support with the aim of reducing the likelihood of reoffending. Practices vary by local authority with a range of agencies (police, education, social work and the third sector) being involved.
Trends in Police Disposals for Young People
In terms of police disposals specifically aimed at young people involved in offending, Restorative Justice Warnings have been in decline. The number issued has fallen from 1,715 people in 2010-11 to 328 people in 2019-20, but numbers have fluctuated since 2014-15.
By contrast, the number of young people referred for EEI increased steadily since their introduction, rising to 6,655 in 2015-16 as the use of these practices became more commonplace. Since then, numbers have decreased each year, up to last year. In 2019-20, the total number increased slightly by 1% to 4,806 from 4,742 in 2018-19.
16. Crown Office and Procurator Fiscal Service Disposals
(Tables 20-22)
When a report is submitted by the Police (or other specialist reporting agency) to the Procurator Fiscal, prosecution in court is only one of a range of possible options for dealing with people who have been charged. The Procurators Fiscal can decide to take no action e.g. if there is insufficient evidence, or if it is not in the public interest to proceed. Alternatively, the Procurators Fiscal can decide to use a non-court direct measure such as a fiscal fine or a diversion from prosecution. Where the Procurators Fiscal decide to offer a diversion from prosecution, this is not shown in the data in this publication.
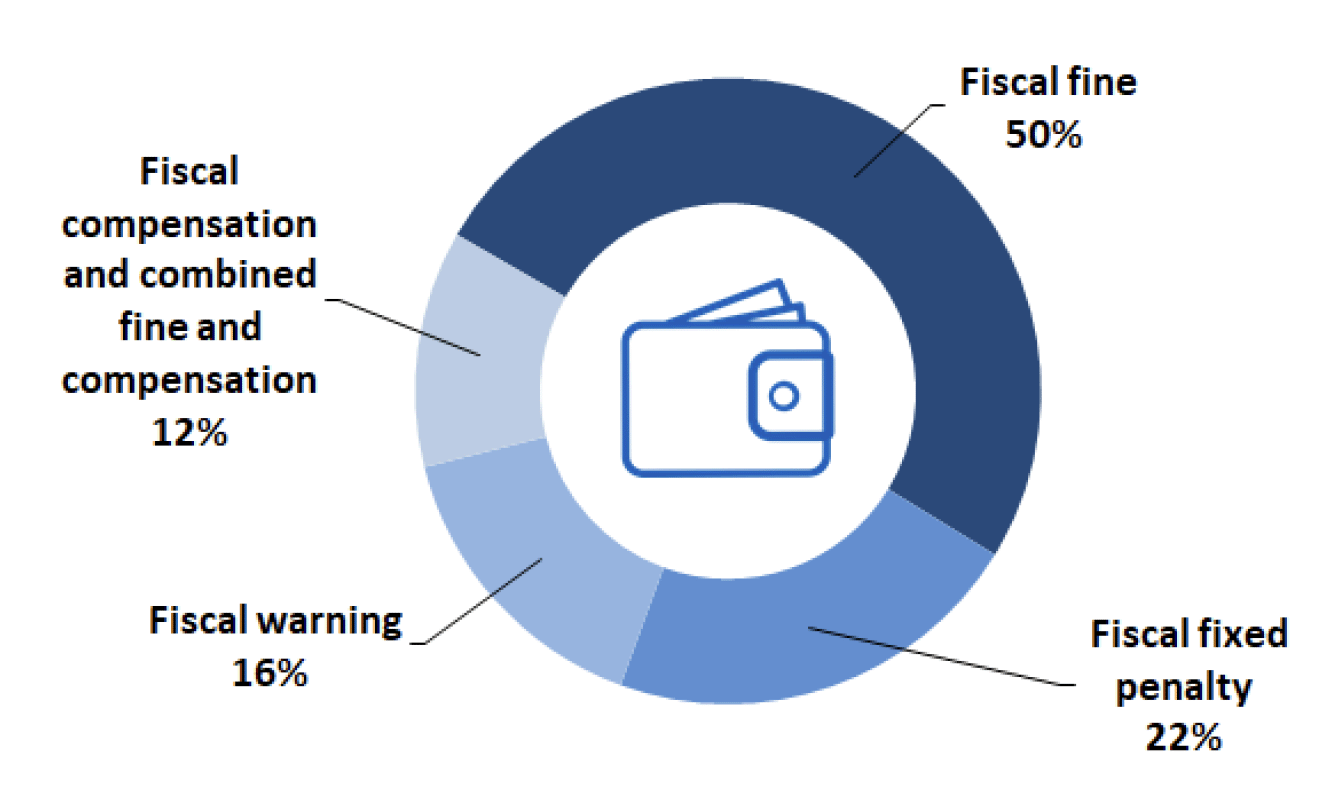
Of COPFS disposals included in this publication for 2019-20, around 50% were fiscal fines (18,354 people) with a further 22% being fiscal fixed penalties (7,955). Fiscal Warnings made up 16% of all COPFS disposals (5,650). The remainder were made up of compensation orders, where the accused pays a prescribed sum of money to court and it is then remitted to the victim, and combined offers which comprise a fine and a compensation element. A full listing of the range of disposals available can be seen in Annex D.
Procurator Fiscal Warnings (FW) provide a method of dealing with a case that doesn't involve prosecution, and if someone receives a FW, they cannot be prosecuted for that specific offence in the future. Figures are reported from 2012-13 onwards (earlier figures obtained from COPFS can be seen in Table 1). Different recording practices before this date meant that it wasn't possible to present older figures.
In 2019-20, there was a decrease of 9% from 6,216 FWs in 2018-19 to 5,650. Prior to this, the numbers had been relatively steady around 9,000 per year apart from a spike of around 14,000 in 2015-16 – the fall seen over the last two years is a notable change, and may be partly due to increased use of RPWs, and to a presumption that 16- and 17-year-olds will be referred to the Children's Reporter rather than given a FW. At the same time, the range of offences for which FWs are used has increased.
Fiscal Work Orders (FWO) were introduced across Scotland in April 2015 and provide the Procurators Fiscal with the option of offering an offender a period of unpaid work of between 10 and 50 hours, as an alternative to prosecution. Successful completion of the order discharges the right to prosecute. We are currently unable to derive statistics on Fiscal Work Orders due to uncertainty around the recording of this information on the Criminal History System. Work is ongoing to resolve this issue, with the intention of publishing FWO statistics in this bulletin in future. However, numbers of FWOs issued can be found elsewhere in the Criminal Justice Social Work statistics.
Fiscal fines
During the period covered by this bulletin, fiscal fines of between £50 and £300 could be offered to an accused by the Procurators Fiscal as an alternative to prosecution. Where a fiscal fine is accepted, the accused cannot be prosecuted, but if the fine is unpaid, it can be enforced through the courts. If the fine is actively rejected, prosecution for the original offence will normally follow.
In 2019-20 there were 18,354 people issued a fiscal fine as a main penalty, very similar to the number of 18,460 people they were issued to in 2018-19. The number issued in 2019-20 was less than half the number (62% lower) than the ten year peak of 47,969 in 2012-13. Fiscal fines were most commonly issued for the following crimes:
- 32% were for Drugs crimes (5,829 fines),
- 25% were for Other miscellaneous offences (4,509 fines), and
- 18% were for Unlawful use of vehicle, which totalled 3,217 fines.
Fiscal fixed penalties
Crown Office Fixed Penalties (COFPs) are generally issued for certain road traffic/motor vehicle offences and can involve a fine or a fine and points. The amount of the fine is prescribed by law. In 2019-20, 7,955 COFPs were issued to people as a main penalty, an increase of 14% from 6,977 in 2018-19. This is the second year in row that their use has increased, although the number issued now is 66% lower than the ten year high in 2013-14 (23,467 COFPs). This is related to a fall in the number of Road Traffic offences reported by the police.
The increase in the most recent year was driven by a rise in penalties for:
- Serious driving offences up 118% to 296 from 135,
- Speeding offences up 26% from 3,324 to 4,182; and
- Documentation offences up 12% to 1,592 from 1,786
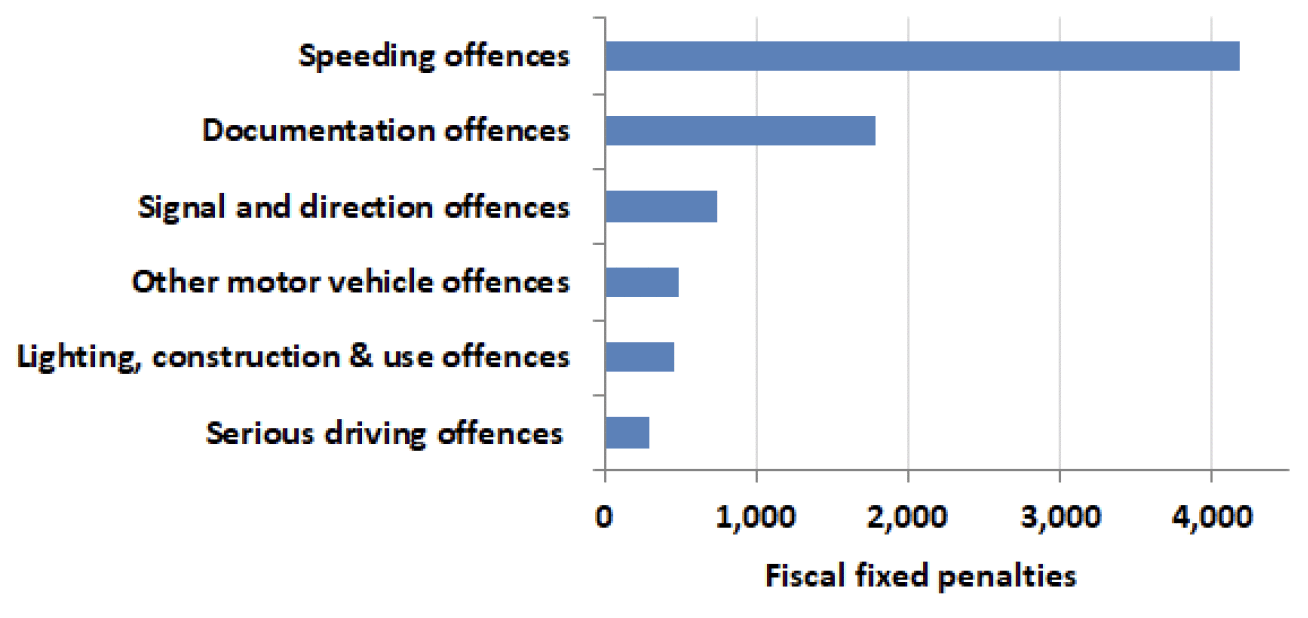
The most common crime that COFPs were issued for in 2019-20 was for speeding offences (4,182 penalties), which made up more than half (53%). After this COFPs were most commonly issued for the following crimes:
- 22% were for Documentation offences (such as using a vehicle without a test certificate, without a licence or failure to insure), totalling 1,786;
- 9% were for Signal and direction offences, totalling 741 penalties; and
- 6% were for Other motor vehicle offences (such as mobile phone and seatbelt offences), totalling 492 penalties.
In 2019-20, more than three-quarters (75% or 5,925) of COFPs were issued to males and 44% (or 2,587) of all COFPs were issued to males aged over 40.
17. Bail and undertakings
(Tables 14 - 16)
When a person is arrested or charged by the Police, the Police may decide to keep that person in custody. The police will submit a report to the Procurator Fiscal in respect of the person in custody and where the Procurator Fiscal decides that the accused is to be prosecuted, they will appear at court on the first lawful day after they were taken into police custody. At this point, the Court will decide whether the accused should be released on bail until they next need to appear in court for later stages of the proceedings.
In some circumstances, the individual is not merely cited to appear at Court at a later date, but the Police decide to release the individual on an Undertaking to appear at Court on a specified date and time.
On 25th January 2018, the law applicable to undertakings was changed, and is now set out under sections 25-30 of the Criminal Justice (Scotland) Act 2016. An Undertaking generally has conditions attached including that the person should not commit an offence; interfere with witnesses or evidence or otherwise obstruct the course of justice; or behave in a manner which causes, or is likely to cause, alarm or distress to witnesses. Any further condition that a constable considers necessary and proportionate to ensure that the undertaking conditions are observed may also be imposed. These undertaking conditions are similar to those for bail.
Please note that four additional tables on bail are published alongside this bulletin, and can be found under the "supporting documents" menu on the website for this publication. These include bail statistics by court type as well as age and sex. One of the tables presents bail aggravations i.e. offences that were committed while the offender was on bail.
Bail orders made, and by main crime type
The number of bail orders relates to individual bail orders. Unlike the number of proceedings, where we count only one 'main' charge per person in each proceeding, multiple bail orders can be issued to a person during one case. Bail orders can also be issued in circumstances which may not lead to proceedings. However, there is a direct correlation between numbers of bail orders and numbers of proceedings, and any overall trend is likely to be similar in both. This is the case in 2019-20, as the number of bail orders decreased by 16% from 34,735 in 2018-19 to 29,150 in 2019-20. Over the longer term, numbers have fallen by 37% since 2010-11. In the year to 2019-20, there were annual decreases in all crime categories.
Bail-related offences
Bail-related offences cover the offences of breach of bail conditions (e.g. interfering with a witness) and failure to appear in court when required to do so. There were 6,800 convictions for bail-related offences in 2019-20, an increase of 5% on 2018-19 (6,504).
The proportion of bail-related offences as a percentage of all bail orders granted in 2019-20 was 23%. This is the highest percentage in the last ten years, and in the previous nine years it ranged between 17% and 19%.
Undertakings
In 2019-20, there were 11,599 undertakings to appear in court, a fall of 26% from 2018-19 (15,646 undertakings). This is the biggest fall from the previous year in the past ten years. The total in 2019-20 is 58% below the ten year high in 2010-11. This may be related to changes introduced by the Criminal Justice (Scotland) 2016 Act - Part I (Police powers), which replaced written undertaking provisions from the Criminal Procedure (Scotland) Act 1995.
More than three-quarters of undertakings (77%) were issued to males in 2019-20 (8,961 people). The proportion of young people being issued with an undertaking has declined over the past ten years, with 14% of undertakings being issued to under-21 year olds in 2019-20 compared to 23% in 2010-11.
Contact
Email: Justice_Analysts@gov.scot