Public body procurement reports and strategies 2023 to 2024: analysis
An analysis of Scottish public bodies’ annual procurement reports and strategies for the 2023 to 2024 financial year.
2. Overview of information received
2.1 Requirement to prepare an annual procurement report and strategy
As noted in the introduction, the 2014 Act requires public bodies[12] with an estimated total value of regulated procurements of £5 million or over in a given financial year to prepare a procurement strategy and annual procurement report (Scottish Government, 2014).
Of the 124 public bodies (100%, n=124) that provided details of their regulated procurement expenditure in their 2023 to 2024 annual procurement reports, 93 (75%) had a regulated procurement spend of £5 million or over, and were therefore required to prepare a procurement strategy and annual procurement report. The remainder (31, 25%) reported the total value of their regulated contracts as below £5 million. These bodies were not required to publish a strategy or annual procurement report under the terms set out in the 2014 Act, but elected to do so. Of these 31 public bodies, 12 were Registered Social Landlords (RSLs), seven were health bodies, six were universities and colleges and six were central government bodies.
In total, 30 strategies and annual procurement reports were received from local government bodies, 29 from central government bodies, 25 from universities and colleges, 23 from RSLs, and 18 from health boards.
2.2 Total number and value of regulated contracts
In the 2023 to 2024 financial year, 5,819 regulated contracts were reported as awarded across the 124 reporting bodies. This represents an average of 47 regulated contracts per public body.
Across the 124 public bodies (100%, n=124) who provided data in their annual procurement reports on their regulated procurement expenditure, the total reported value of regulated contracts awarded in the 2023 to 2024 financial year was £11.5 billion. This is over £2 billion more reported regulated procurement spend than in each of the two previous financial years (despite fewer reports being submitted). The average total reported value of regulated contracts awarded was also higher, with an average of £92.7 million per public body in 2023 to 2024 compared to £72.0 million reported in 2022 to 2023.
| Measure | 2021 to 2022 | 2022 to 2023 | 2023 to 2024 |
|---|---|---|---|
| Number of public bodies that provided data about number of regulated contracts awarded | 128 | 129 | 124 |
| Total combined number of regulated contracts awarded | 6,359 | 7,025 | 5,819 |
| Number of public bodies that provided data about value of regulated contracts awarded | 127 | 127 | 124 |
| Total combined value of regulated contracts awarded | £9.3 billion | £9.2 billion | £11.5 billion |
| Average number of regulated contracts awarded (per public body) | 50 | 54 | 47 |
| Average total value of regulated contracts awarded (per public body) | £73.5 million | £72.0 million | £92.7 million |
Source: 2021 to 2024 annual procurement reports.
Figure 2.1 shows the number of regulated contracts detailed in annual procurement reports across sectors for the previous three reporting periods. As with previous years, the local government sector accounted for the highest reported number of regulated contracts awarded across all sectors in the 2023 to 2024 period, representing 39% (2270, n=30) of the total regulated contracts reported as awarded. This was followed by the central government sector, which represented 32% (1851, n=29) of all regulated contracts detailed in annual procurement reports in 2023 to 2024.
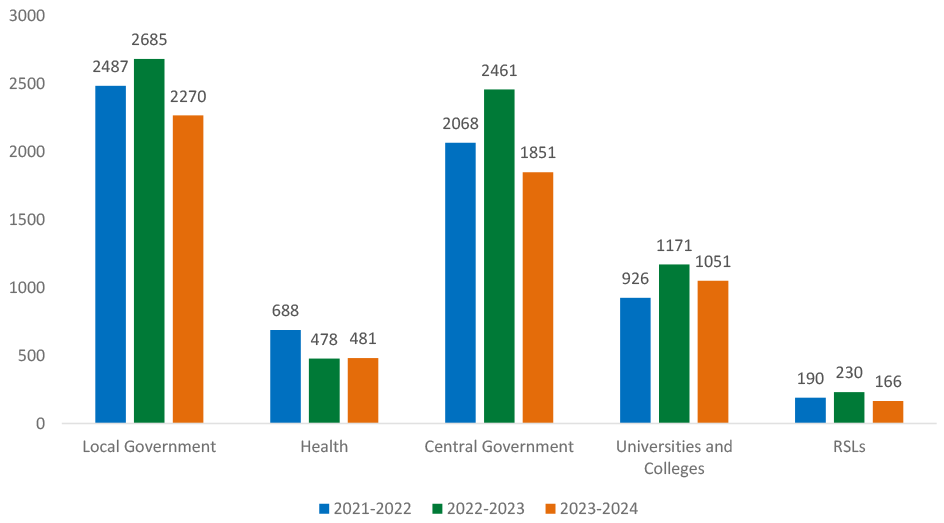
Source: 2021 to 2024 annual procurement reports
Base: n=128 for 2021 to 2022, n=129 for 2022 to 2023 and n=124 for 2023 to 2024. Including all respondents who inserted a numerical value including (0) but excluding those entries which are blank or have entries such as ''information not collected/not known/unavailable'' and ''N/A''
The local government sector also accounted for the highest total reported value of regulated contracts awarded in the 2023 to 2024 financial year, representing 39% (£4.5 billion, n=30) of the total reported value. The health sector accounted for the second highest total reported value of regulated contracts awarded, with 35% (£4.0 billion, n=18) of the contracts reported as awarded in 2023 to 2024. This is higher than what was reported in previous years (Figure 2.2).
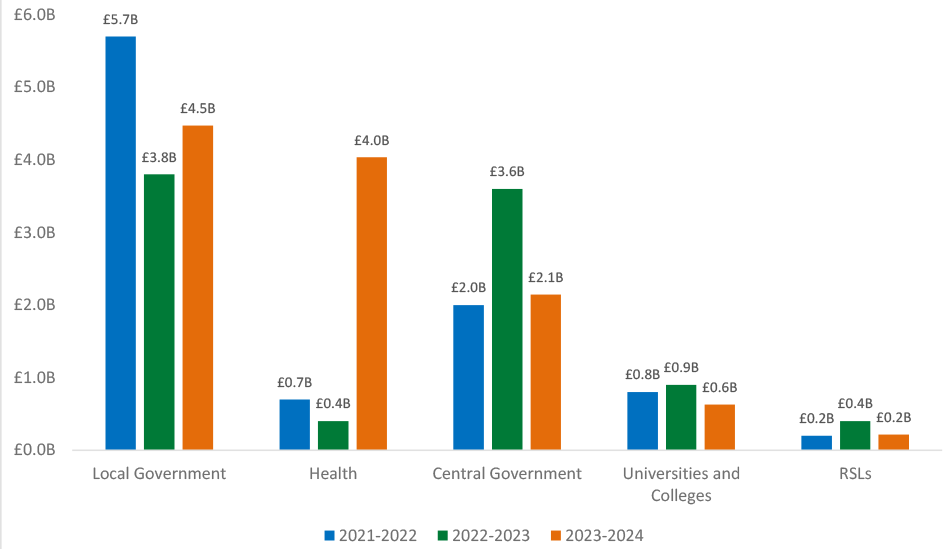
Source: 2023 to 2024 annual procurement reports
Base: n=127 for 2021 to 2022, n=129 for 2022 to 2023 and n=124 for 2023 to 2024. Including all respondents who inserted a numerical value including (0) but excluding those entries which are blank or have entries such as ''information not collected/not known/unavailable'' and ''N/A''. Note: all figures cited have been rounded.
2.3 Examples of the types of regulated contracts awarded by sector
Across the 2023 to 2024 period, all but one annual procurement report (124, 99%, n=125) provided examples of the types of regulated contracts awarded. Many reports included extensive information about the regulated contracts awarded, including a description of the contract, the date of the award, the successful supplier and the value of the contract. Others provided less detail or a high-level overview instead.
A summary of the most common examples of regulated procurements by sector is provided below.
- Local government: waste management services, health and social care provision, construction and refurbishment, roadworks, utilities, cyber security, consultancy, children’s services, sports and leisure provision.
- Central government and other significant bodies: catering and hospitality services, user research, IT systems, cyber security, legal services, financial management systems, facilities management, postal services.
- Universities and colleges: insurance services, legal services, utilities, maintenance and repair services, occupational health, travel, IT services and software, CCTV and security services, catering.
- Health: medical supplies and equipment, patient transport services, training and education programmes, legal services, maintenance and repair services.
- RSLs: design, architecture and building works, landscaping, insurance and legal services, utilities management, cleaning, maintenance and repair services.
In addition, annual procurement reports noted that many contracts which relate to climate change, environmental wellbeing and net zero initiatives were awarded across a range of sectors. Examples included design and installation of solar panels, energy improvement works, decarbonisation work and carbon capture and storage leasing advice.
2.4 Total number of unique suppliers awarded a place on a regulated contract
Based on information provided by 120 public bodies in their annual procurement reports (97%, n=124), a total of 7,330 unique suppliers were awarded a place on a regulated contract in the period 2023 to 2024. This represents an average of 61 unique suppliers per public body.
Figure 2.3 shows that the local government sector accounted for the highest number of unique suppliers awarded a place on a regulated contract, comprising 50% (3,677, n=27) of the total number reported.
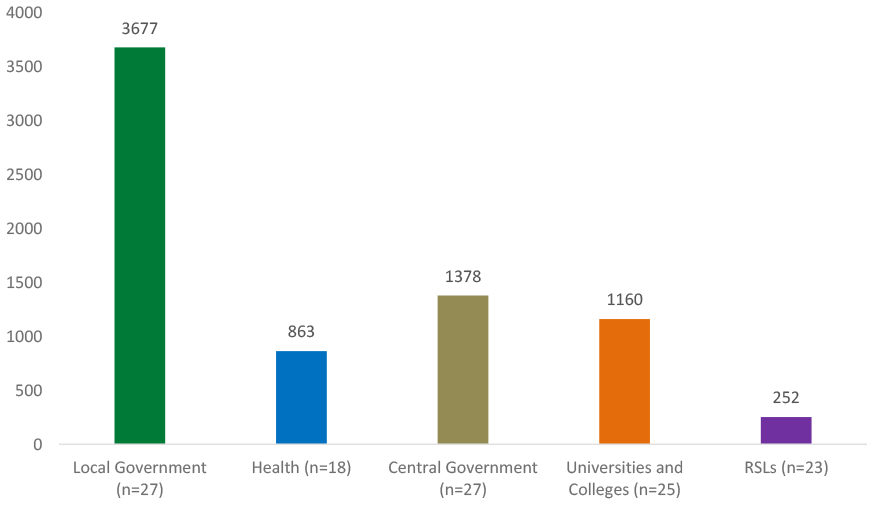
Source: 2023 to 2024 annual procurement reports
Base: n=120. Including all respondents who inserted a numerical value including (0) but excluding those entries which are blank or have entries such as ''information not collected/not known/unavailable'' and ''N/A''.
One hundred and eight annual procurement reports (87%, n=124) included information on the number of unique suppliers awarded a place on a regulated contract during the 2023 to 2024 financial year. Of the combined total of 7,330 unique suppliers reported, 5,136 (n=119) were SMEs, and 398 (n=108) were third sector organisations.
Table 2.2 shows that the different sectors of public bodies reported relatively similar proportions of SMEs as unique suppliers, ranging from 72% (182, n=22) for RSLs, to 67% (780, n=25) for universities and colleges. There was more variation reported in the proportion of unique suppliers that are third sector organisations, with 8% for both local government (287, n=24) and health bodies (66, n=18), but only 1% for universities and colleges (6, n=21).
| Sector | Number of unique suppliers | Number of unique suppliers that are SMEs | Number of unique suppliers that are third sector bodies |
|---|---|---|---|
| Local government | 3,677 | 2,613 (71%) | 287 (8%) |
| Health | 863 | 591 (68%) | 66 (8%) |
| Central government | 1,378 | 970 (70%) | 35 (3%) |
| Universities and colleges | 1,160 | 780 (67%) | 6 (1%) |
| RSLs | 252 | 182 (72%) | 4 (2%) |
| Total | 7,330 | 5,136 (70%) | 398 (5%) |
| Base | 120 | 119 | 108 |
Source: 2023 to 2024 annual procurement reports
Contact
Email: socialresearch@gov.scot