Universal Health Visiting Pathway evaluation: phase 1 report - routine data analysis - implementation and delivery
The Universal Health Visiting Pathway was introduced in Scotland in 2015 to refocus the approach to health visiting in Scotland. This is the final report of four that provides findings about the implementation and delivery of the pathway as part of the national evaluation of Health Visiting.
First visit
Reviews provided each month
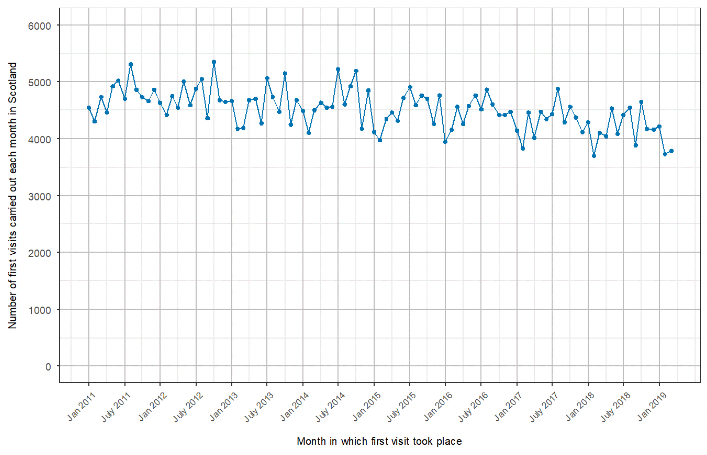
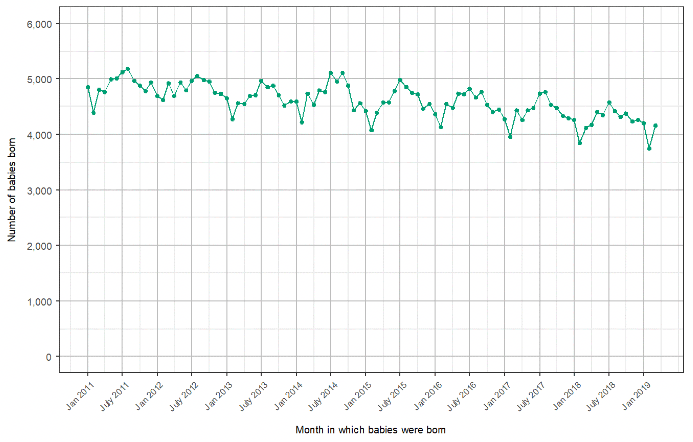
Over the course of 8.25 years, almost 446,400 first visits were recorded, averaging just over 4,500 visits per month (Figure 5). Some fluctuation is apparent, and there is a slight downward trend over the course of the period: the monthly average for the first two years (January 2011 to February 2013) is about 4,725 reviews, then 4,550 reviews per month (March 2013 to February 2016), and 4,310 reviews per month (March 2016 to March 2019). However, this downward trend can be seen to mirror the number of live births each month (Figure 1).
Overall coverage
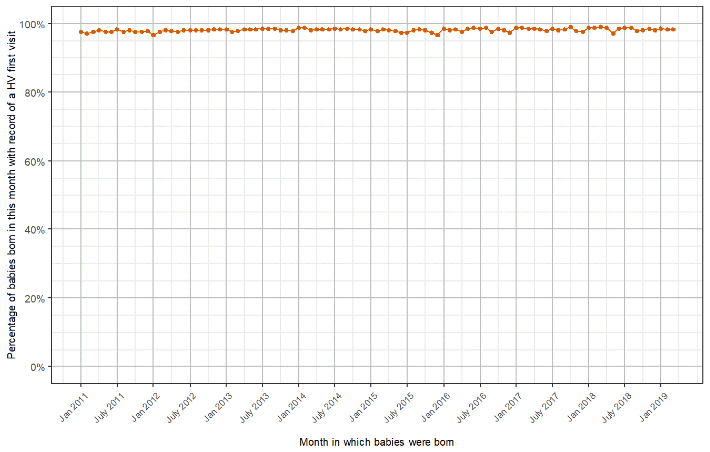
Mean coverage for this review over the time period is 98.1%. Although Figure 6 shows some months have lower coverage, this never drops below 96%. Since this usually falls for births in December or January, it is probably attributable to staff holidays over the festive period.
Coverage of first visit stratified by SIMD quintile
Annual coverage of the first visit stratified by SIMD quintile is displayed in Figure 7. The average annual coverage is 98% for each SIMD quintile. The lowest coverage is 97.5% (SIMD 1, SIMD 3 and SIMD 5 for babies born in 2011/12 and SIMD 5 in 2015/16); the highest is 98.6% (SIMD 3 for babies born in 2013/14) (see Table 3 below). Thus coverage does not vary systematically by SIMD for this review.
Comparison of first visit coverage between SIMD 1 and SIMD 5
A comparison of the difference in coverage – both absolute and relative – for the health visitor's first visit to babies living in the most and least deprived areas is presented in Table 3. As can be observed, for six of the eight birth cohorts, the 95% confidence intervals (95% CI) for the absolute difference between least and most deprived quintiles include 1, thereby demonstrating that there is no significant difference between the coverage for the two quintiles in these years.
Notes to Figures 5-7
1. The first visit should be delivered by the time the baby is 14 days old. However, in certain instances, it may be delayed; for example, for sick children in neonatal care. Therefore some 'late' reviews will be expected (and are clinically appropriate).
2. The review is deliverable from January 2011 and should therefore be delivered to all children born from January 2011 onwards.
3. Overall coverage = Number of children born in month with subsequent record of a health visitor first visit on CHSP-PS (by May 2020) / Number of children born in month.
4. Coverage of SIMD 1 reviews = Number of children born in financial year in SIMD 1 area with subsequent record of a health visitor first visit on CHSP-PS (by May 2020) / Number of children born in financial year in SIMD 1 area.
Source for Figures 5-7
The source for all child health data is CHSP-PreSchool May 2020, Public Health Scotland. The source for births data is NRS.
| Birth cohort (i.e. births occurring in financial year ending March 20XX) | Coverage of first visit (%) | Absolute difference in coverage (SIMD 5 – SIMD 1) | Absolute difference in coverage: 95% CI | Relative difference in coverage (SIMD 5 / SIMD 1) | ||||
|---|---|---|---|---|---|---|---|---|
| SIMD 1 | SIMD 2 | SIMD 3 | SIMD 4 | SIMD 5 | ||||
| March 2012 | 97.53 | 97.63 | 97.46 | 97.70 | 97.47 | -0.06 | -0.476 to 0.352 | 0.9994 |
| March 2013 | 97.73 | 97.98 | 97.88 | 98.06 | 98.01 | 0.28 | -0.107 to 0.662 | 1.0028 |
| March 2014 | 98.18 | 98.42 | 98.60 | 98.13 | 98.29 | 0.11 | -0.243 to 0.471 | 1.0012 |
| March 2015 | 98.06 | 98.30 | 98.49 | 98.26 | 98.34 | 0.29 | -0.064 to 0.637 | 1.0029 |
| March 2016 | 97.60 | 97.80 | 97.97 | 98.00 | 97.50 | -0.10 | -0.515 to 0.310 | 0.9989 |
| March 2017 | 98.17 | 98.26 | 98.01 | 98.13 | 98.12 | -0.05 | -0.415 to 0.316 | 0.9995 |
| March 2018 | 97.94 | 98.44 | 98.30 | 98.14 | 98.35 | 0.42 | 0.045 to 0.786 | 1.0042 |
| March 2019 | 97.80 | 98.19 | 97.84 | 98.20 | 98.25 | 0.45 | 0.065 to 0.841 | 1.0046 |
Source:
The source for all child health data is CHSP-PreSchool May 2020, Public Health Scotland. The source for births data is NRS.
Contact
Email: justine.menzies@gov.scot