Universal Health Visiting Pathway evaluation: phase 1 report - routine data analysis - implementation and delivery
The Universal Health Visiting Pathway was introduced in Scotland in 2015 to refocus the approach to health visiting in Scotland. This is the final report of four that provides findings about the implementation and delivery of the pathway as part of the national evaluation of Health Visiting.
Health Plan Indicator (HPI)
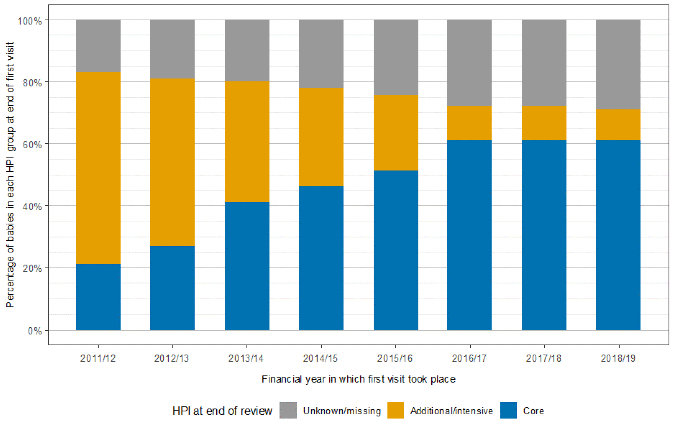
First visit
In 2011/12, 20.6% of babies were allocated core HPI status at the first visit (Figure 31); core HPI status increased steadily until it stabilised at just over 60% in the final three years of data analysed (2016/17 to 2018/19). Conversely, additional/intensive status was allocated to 62.4% of babies in 2011/12, and decreased steadily until it reached 10-11% in the final three years. The percentage of babies with missing or unknown HPI status also increased over the study period, from 17% in 2011/12 to 29.3% in 2018/19. This HPI pattern mirrors health visiting practice prior to the introduction of the UHVP. Prior to 2016, health visitors were encouraged to record HPI status by the 6-8 week visit. If a family were recorded as core HPI status, then the family may receive limited or no health visitor support after the 6-8 week check.[7]
The introduction of the pathway saw a revision in the guidance to the recording of HPI status with health visitors encouraged to use professional judgement with provisional recording encouraged in the 11-14 day visit and a further period of time for allocation of the HPI indicator, allowing the Health Visitor time to get to know families. Therefore it became more common for HPI status to be provisional or not recorded at the first visit.
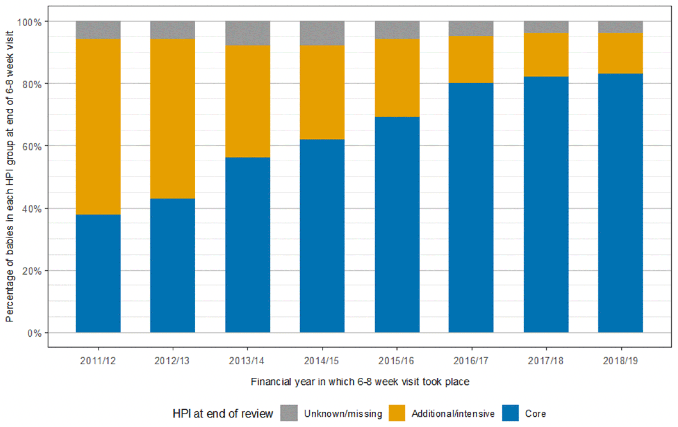
6-8 week visit
The pattern of HPI status allocation for the 6-8 week visit is similar to that in the first visit, although allocation of core HPI status was higher in 2011/12 (37.6%), it stabilises at 80-83% in the final three years (Figure 32). Similarly to the first visit, additional/intensive HPI status was allocated to 56.8% of babies in 2011/12 and declined to 15% and lower from 2016/17; the percentage with unknown or missing HPI status varied over the period although declined in the latter two years (the value ranging from 7.9% in 2013/14 and 2014/15 to 3.5% in 2017/18).
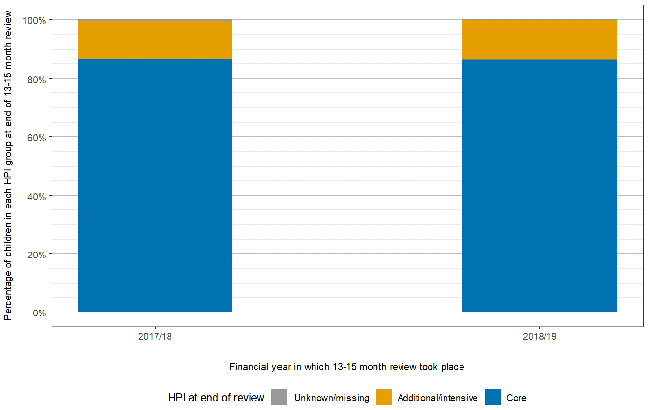
13-15 month review
At the end of the 13-15 month review, almost all children have been allocated either core or additional HPI status (less than 0.5% have unknown status). Due to the timing of the introduction of this review, data are only available for two years (2017/18 and 2018/19): in both years, 86% of children were recorded as having core status and 13% additional HPI status (Figure 33).
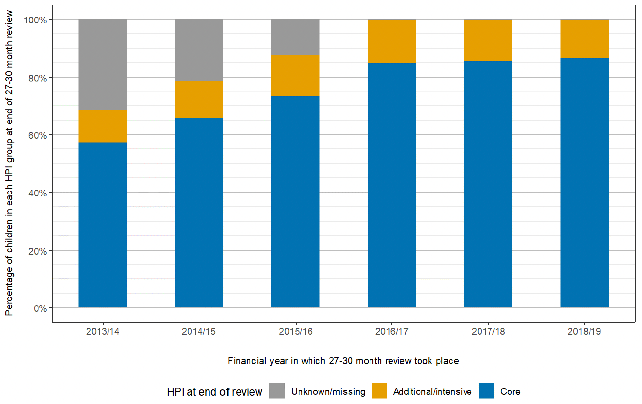
27-30 month review
In 2013/14, 31.8% of toddlers have unknown HPI status; this declines to less than 0.5% from 2016/17 onwards indicating that almost all children have an HPI indicator at the 27-30 month review point. The percentage of children with additional HPI status varies a small amount over the course of the six years: from 10.9% in 2013/14 to 15.2% in 2016/17, and then 13.5% in 2018/19 (Figure 34).
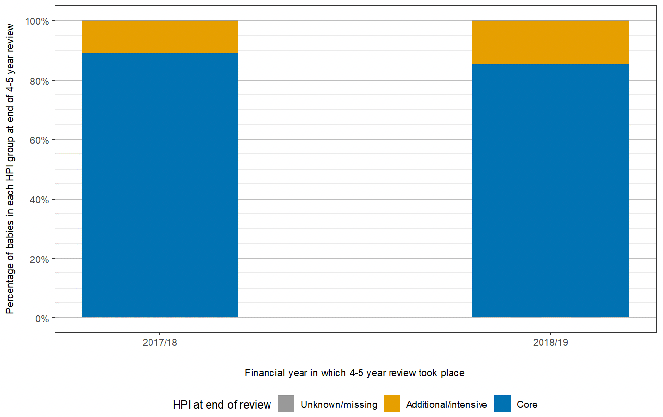
4-5 year review
About 0.1% of children have an unknown HPI status at this review. Again, there is very little data available. In 2017/18, out of 6,043 children with reviews, 10.9% had an additional HPI status; in 2018/19, this had increased to 14.4% (20,220 reviews) (see Figure 35).
Notes to Figures 31-35
1. See Table 1 above for the number of reviews delivered in each financial year. If fewer than 1,000 reviews were delivered in a financial year, data for that year have not been analysed (e.g. for the 13-15 month review, 125 were conducted in 2016/17; for the 27-30 month review, 296 were provided in 2012/13; and for the 4-5 year review, 19 were provided in 2016/17).
Source for Figures 31-35
The source for all child health data is CHSP-PreSchool May 2020, Public Health Scotland. The source for births data is NRS.
Contact
Email: justine.menzies@gov.scot