Universal Health Visiting Pathway evaluation: phase 1 report - routine data analysis - implementation and delivery
The Universal Health Visiting Pathway was introduced in Scotland in 2015 to refocus the approach to health visiting in Scotland. This is the final report of four that provides findings about the implementation and delivery of the pathway as part of the national evaluation of Health Visiting.
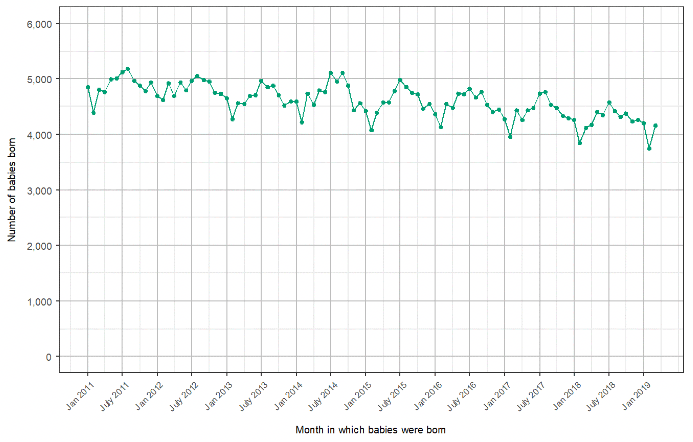
Births
Data on the number of live births recorded each month, from 1 January 2011 to 31 March 2019, in Figure 1, shows that there is an annual trough in February, the shortest month of the year, and annual peaks in the summer months. Over the eight-year period, the average number of births per month decreased: between 1 January 2011 and 28 February 2013, the mean number of live births per month was 4,830; between 1 March 2013 and 28 February 2016, the mean number of live births per month had dropped to 4,645; and between 1 March 2016 and 31 March 2019, it had dropped further to 4,390. This pattern should be borne in mind when examining all the graphs of the number of reviews delivered.
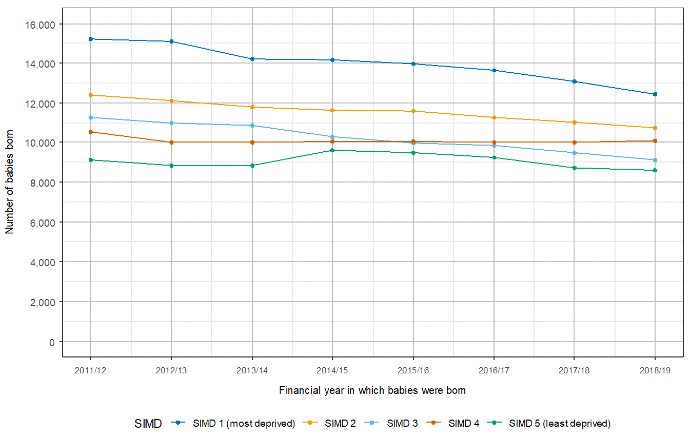
When births are explored by SIMD quintile (Figure 2), differences in the number of births in each quintile can be observed. There are 67% more births in the SIMD 1 (most deprived) quintile (n = 15,239) compared with SIMD 5 (least deprived, n = 9,132) in the financial year 2011/12, and 44% more in SIMD 1 than SIMD 5 in 2018/19 (n = 12,434 and 8,625 respectively). The annual numbers of births in the other quintiles lie between these two extremes, with number of births decreasing as affluence increases; in the least deprived quintile, however, there is an increase in births between March 2014 and March 2015, after which births decrease again. The decrease in annual births over the course of the period is most apparent in the three quintiles in the more deprived areas.
Contact
Email: justine.menzies@gov.scot