Universal Health Visiting Pathway evaluation: phase 1 report - routine data analysis - implementation and delivery
The Universal Health Visiting Pathway was introduced in Scotland in 2015 to refocus the approach to health visiting in Scotland. This is the final report of four that provides findings about the implementation and delivery of the pathway as part of the national evaluation of Health Visiting.
Location of review
The pathway is based on evidence which indicates that all visits should be undertaken by a health visitor in the home. Health visitors are, however, advised to use professional judgement in assessing where this may not be appropriate, such as in cases / suspected cases of domestic abuse.[3] Visits could be recorded as taking place in more than one location.
First visit
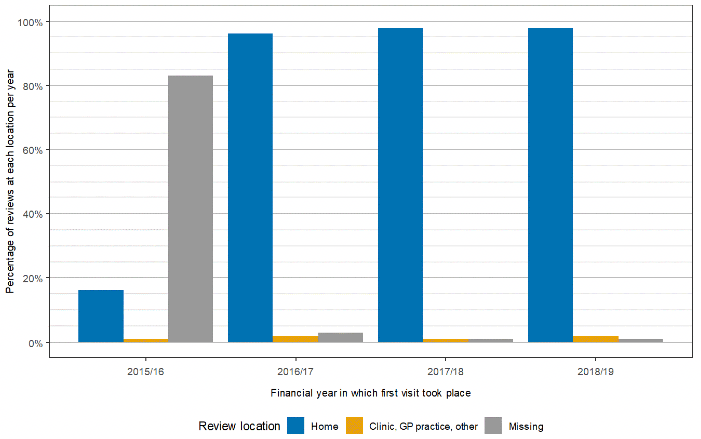
The location of the first visit was not able to be recorded by the health visitor until February 2016. In the financial year ending March 2016, 16% of all reviews conducted in that year were recorded as taking place in the baby's home, 0.5% another location, and 83.4% were missing (see Figure 18). In the subsequent three years, the percentage of first visits taking place in the home increased from 95.9% to 97.7%.
6-8 week visit
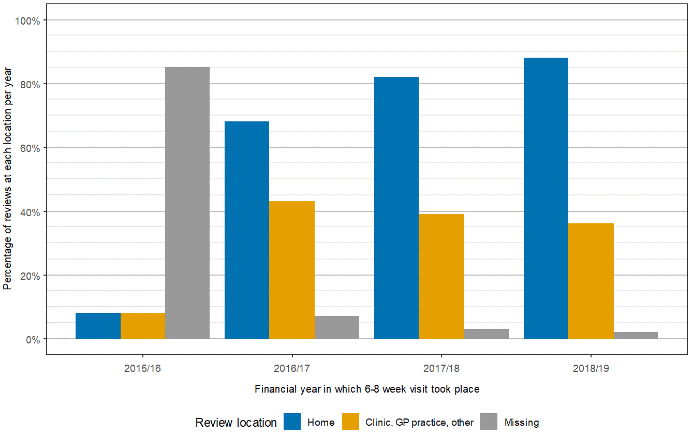
Similarly for the 6-8 week visit (see Figure 19), the location was not recorded for the first four years; in 2015/16, about 8% of 6-8 week reviews were recorded as taking place at the child's home and a further 8% at another location. In the final three years, the number of reviews taking place in the baby's home steadily increased, from 68.0% in 2016/17 to 87.6% in 2018/19. This review is more complex however as it is intended to be a shared two-stage review between health visitor and GP, with the health visitor component provided at home, and the GP component provided in the surgery. This has resulted in multi-coding of the location of reviews with reviews being coded as occurring in the home and clinic/GP practice. This inconsistency in recording can make it difficult to disentangle if all sites are recording both locations i.e. home and GP surgery.
13-15 month review
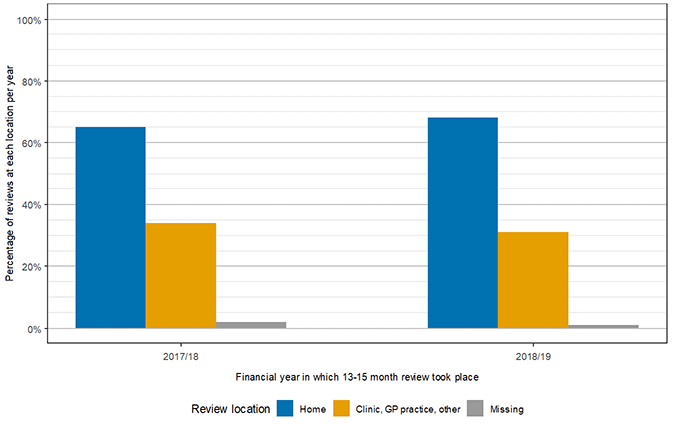
This review was only provided from April 2017, and hence there are only two years of data available. In Figure 20, the review location has been recorded for most reviews: the percentage being delivered in the home increased from 65.0% in 2016/17 to 67.6% in 2018/19.
27-30 month review
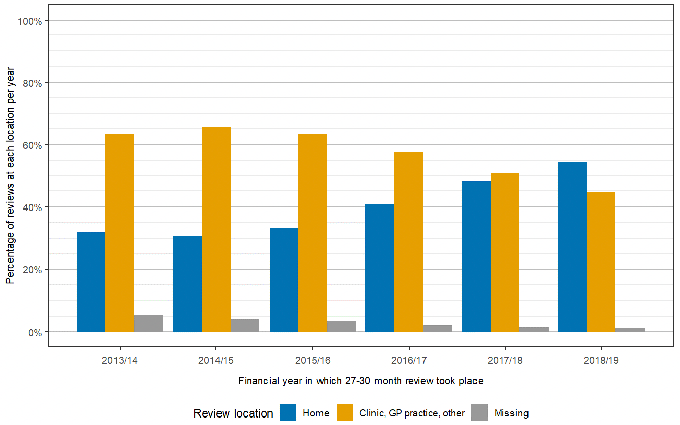
The 27-30 month review was provided from April 2013 onwards and the location of the review was reported in most instances. Historically, the 27-30 month review was conducted in clinics, however the introduction of the UHVP in 2016 provided guidance that these reviews should be taking place in the home. This is reflected in data from 2013/14 to 2015/16 when slightly more than 30% of reviews were conducted in the child's home (see Figure 21); this increased subsequently as the UHVP was rolled out with 54.5% reviews taking place in the family home by 2018/19.
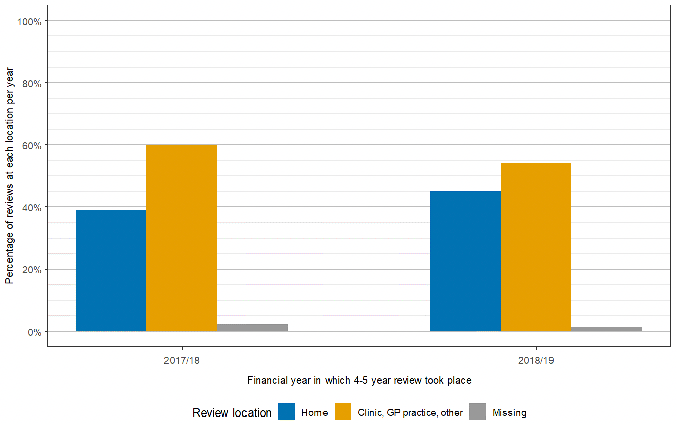
4-5 year review
This review was provided in April 2017 by some health boards, although it was not intended to be introduced until April 2020: some 6,043 reviews have been recorded for the year 2017/18 and 20,220 for 2018/19. In 2017/18, 38.7% of reviews took place in the child's home and 59.7% took place elsewhere (Figure 22); in 2018/19, 45.2% of reviews took place in the child's home.
Note
Location of first visit started being recorded on the new CHSP form during February 2016, i.e. a few weeks before the end of financial year 2015/16.
Note
Location of 6-8 week visit started being recorded on the CHSP form during February 2016, i.e. a few weeks before the end of financial year 2015/16.
A total of 6,043 4-5 year reviews were delivered in the financial year 2017/18, when the review was introduced; 20,220 reviews were delivered in 2018/19
Notes to Figures 18-22
1. See Table 1 above for the number of reviews delivered in each financial year. If fewer than 1,000 reviews were delivered in a financial year, data for that year have not been analysed (e.g. for the 13-15 month review, 125 were conducted in 2016/17; for the 27-30 month review, 296 were provided in 2012/13; and for the 4-5 year review, 19 were provided in 2016/17).
Source to Figures 18-22
The source for all child health data is CHSP-PreSchool May 2020, Public Health Scotland. The source for births data is NRS.
Contact
Email: justine.menzies@gov.scot