Understanding the changing nature and context of poverty in Scottish rural and island communities since 2010
Analysis of existing data to compare poverty trends and potential drivers across Scottish rural and island communities from 2010, with policy and research implications.
3. Potential drivers of poverty trends in rural and island communities in Scotland
Key findings
Shifting demographics
- Between 2011 and 2021, accessible rural areas experienced the strongest population and working-age growth, while remote small towns saw population decline, an 8.2% drop in working-age residents, and a shift toward single-person, childless, and older households. Working-age populations grew only in accessible rural areas and large urban areas.
Employment challenges
- The increase in relative poverty in remote small towns and remote rural areas between 2012 and 2017 coincided with a temporary decline in employment rates. Accessible rural areas maintained the lowest unemployment rates while large urban areas consistently showed the highest.
- Rural employment showed significant sectoral variation between 2015 and 2023, with land-based industries experiencing substantial growth while the energy supply sector declined markedly.
Housing pressures
- Housing tenure patterns varied by geography, with householders in remote small towns experiencing the largest decline in owner-occupation alongside increased private renting, while the proportion of owner-occupiers increased in remote and accessible rural areas between 2010 and 2023.
- Householders in large urban areas consistently spend a higher proportion of income onhousing than other areas, with those in rural areas maintaining the best housing affordability ratios[51] despite geographical convergence over time.
- The uptick in relative poverty between 2012 and 2017 disproportionately affected householders in different tenure types. Renters in rural areas experienced sharp increases in relative poverty that led to temporary geographical convergence in poverty rates with the rest of Scotland, while homeowners maintained stable relative poverty rates across all geographical areas. Similar patterns by household tenure were apparent for working-age people, children and pensioners.
- Stakeholders and experts by experience expressed a view that short-term holiday lets were intensifying housing pressures and reducing affordability in rural and island communities by removing stock from the long-term residential market. Scottish Government analysis provided some support for this trend, though further research would be needed to establish this impact.
Housing stock and energy infrastructure
- The housing stock in rural and island communities increases fuel poverty risks and has knock-on impacts on other poverty outcomes. Rural and island areas have proportionally more older, larger, detached properties with lower energy efficiency ratings, combined with limited gas grid access that forces reliance on more expensive, often unregulated heating fuels or electricity. This housing stock disadvantage will continue to hamper poverty resilience in these communities.
Access to public and essential services
- Stakeholders and experts by experience suggested that the centralisation of services (e.g. moving services to fewer, more central locations) may create barriers to access, while limited retail competition may increase costs, compounding disadvantages for low income remote, rural and island households.
Geopolitical developments
- Stakeholders and experts by experience identified the lead up to Brexit as a contributing factor to increasing poverty rates in rural and island communities between 2012 and 2017, with Scottish Government analysis confirming that many of the most economically vulnerable areas were located in Scottish rural and island areas.
Findings
The observed changes in the trends and patterns of poverty across geographical areas are likely due to a complex interplay of various factors spanning domains including demographics, employment, housing, welfare policy, geopolitical developments and availability and delivery of public services.
Shifting demographics
Over a 10-year period (2011-2021) there were substantial changes in levels of population growth across several geographical areas (Figure 13). The largest change was observed in accessible rural areas where an increase of 10.6% was noted, and this was followed at a distance by large urban areas (5.1%). In contrast, remote small towns were the only geographical area that saw a steady decline in population numbers and to a certain extent remote rural areas. The remote areas that saw a population decline include the same geographical areas that saw an increase in relative poverty between 2012 and 2017.

Source: National Records of Scotland via Urban Rural Dashboard (2021) using the Scottish Government 6-fold Urban Rural Classification.
These population trends are associated with a changing age profile across areas. For example, over the same period the only two areas that saw an increase in the proportion of working-age people included accessible rural areas and large urban areas, a 5.8% and 3.9% growth respectively (Table 3). In addition, findings covering the period from 2011 to 2021 indicate that the age distribution in remote rural areas continues to be different from other areas with smaller numbers of working-age people[52]. Whereas the proportion of people aged 65 years and over is increasing across Scotland, this trend is particularly strong in accessible rural areas (32.4% growth), with the lowest growth in large urban areas (12.2%) and remote small towns (14.8%).
| 0-15 years | 16-64 years | 65+ years | |
|---|---|---|---|
| % change | % change | % change | |
| Scotland | -0.5 | 0.2 | 19.8 |
| Large urban areas | 3.9 | 3.9 | 12.2 |
| Other urban areas | -3.6 | -3.4 | 21.3 |
| Accessible small towns | -4.0 | -3.5 | 23.9 |
| Remote small towns | -10.8 | -8.2 | 14.8 |
| Accessible rural areas | 5.9 | 5.8 | 32.4 |
| Remote rural areas | -10.4 | -4.5 | 23.5 |
Source: National Records of Scotland via Urban Rural Dashboard (2021) using the Scottish Government 6-fold Urban Rural Classification.
Between 2010 and 2023 different geographical areas experienced distinct changes in the profile of household types. The only household types that saw an increase in remote rural areas were older smaller[53] and single older[54] households, by 2.0% and 3.6% respectively. In contrast, remote small towns saw an increase in single[55] and small adult[56] households (4.8% versus 5.4%) and to a smaller extent in single older households. This was combined with a substantial decrease of 6.2% in small family[57] household types. As such, the increase in relative poverty in remote areas may reflect a higher and increasing proportion of smaller, older households at risk of poverty.
Views from the experts by experience panel highlighted that an increase in the proportion of pensioners in certain geographical areas may reduce poverty resilience, as most pensioners are on a fixed income. This means that if prices rise considerably, pensioners may find it harder to make ends meet and are likely to have limited opportunities to find alternative sources of income. However, it is worth nothing that pensioners are less likely to be in relative poverty after housing costs than other groups (Table 1).
Employment challenges
The rate of employment and the types of industries in which people are employed differ across geographical areas. Whereas the employment rate[58] of the highest income householder[59] for Scotland showed a steady upward trend between 2010 and 2019, a temporary downward trend was observed for remote small towns and remote rural areas. The employment rate of the highest income householder dropped from 80.5% in 2013, to 71.0% in 2014 in remote small towns, before returning to levels previously seen by 2017/18 (Figure 14). A less pronounced decrease in the employment rate was noted in remote rural areas after an initial peak at 83.6% in 2014 to 76.8% in 2016 before returning to levels seen earlier. In general, householders in accessible rural areas have the highest rate of employment and the lowest rate is consistently observed in large urban areas. This pattern was also reflected in more recent data from 2023. The decrease in the employment rate in remote areas broadly mirrored the uptick in relative poverty noted in the same period (Figure 3).
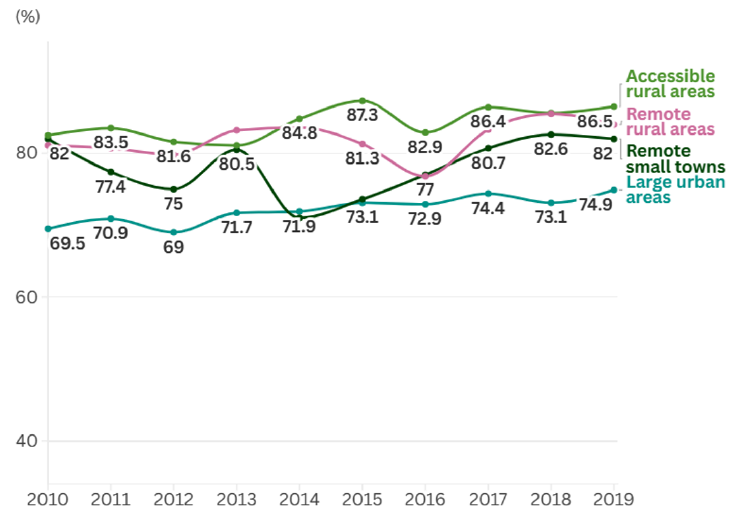
Source: Scottish Household Survey using the Scottish Government 6-fold Urban Rural Classification. Estimates for other urban areas, accessible small towns and Scotland overall can be found in the supporting documentation. No data are presented for 2020 and 2021 due to the impacts of the Coronavirus (COVID-19) pandemic on the survey.
Stakeholders and members of the expert by experience panel were of the view that levels of unemployment are currently low in rural and island areas with many people working multiple part-time jobs to fit around caring responsibilities. In addition, they perceived that there were many more jobs than people to fill them and that labour shortages were particularly felt in the early years setting, health and construction. At a community level, these shortages hampered business growth and at an individual level people were unable to take up certain jobs because, for example, the required childcare provision was not available. They also suggested that efforts to shift from fossil fuels to renewable energy production in rural and island areas led to a decrease in well-paid jobs in the fossil fuel industry that were replaced with lower-paid jobs in the renewable energy industry that often required a different skill set.
Between 2015 and 2023, rural industry sectors remained stable in their job composition distribution but varied significantly in growth. The largest sectors were wholesale and retail trade, repair of motor vehicles and motorcycles (40,000 jobs), followed by human health and social work activities (39,000) and accommodation and food service activities (37,000). Similar patterns were observed in 2023. Over the same period, agriculture, forestry and fishing (i.e. land-based industries) demonstrated the highest growth at 129%, while electricity, gas, steam and air conditioning supply (i.e. the energy supply sector) experienced the steepest decline at 33% (Figure 15). Island industry sectors followed the same job composition distribution with the largest sectors being human health and social work activities (9,000 jobs), followed by accommodation and food service activities and wholesale and retail trade; repair of motor vehicles and motorcycles, both 6,000 jobs (2015). The distribution of jobs across sectors remained stable over time in island areas, although the largest increase was noted in the energy supply sector, with a doubling of the number of jobs, whereas mining and quarrying saw the biggest decline (-42%), although the absolute numbers of jobs in the latter are small[60].
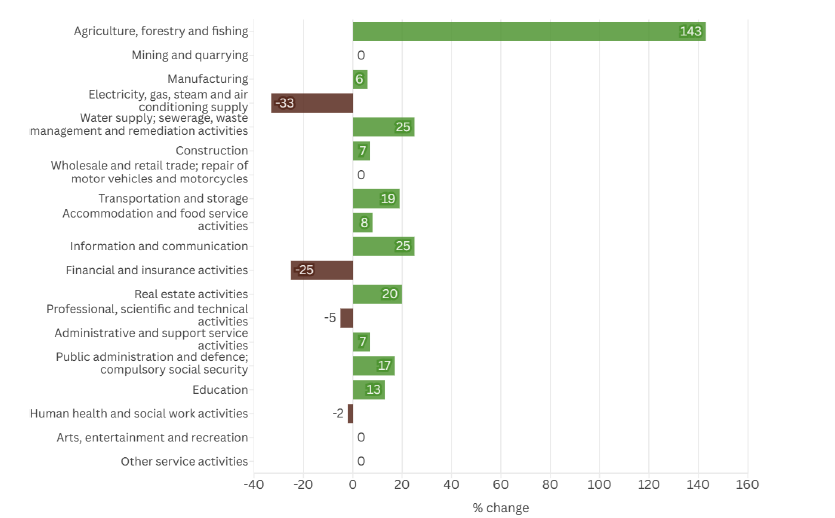
Data source: Business Register and Employment Survey using the Scottish Government Urban Rural Classification, rural datazones only. Sectors that showed no or very minimal change ( ± 5% were excluded from the histogram (i.e. mining and quarrying, wholesale and retail trade; repair of motor vehicles and motorcycles, real estate activities, professional scientific and technical activities, administrative and support services, human health and social work activities.
Housing pressures
The type of accommodation people live in differs across geographical areas and this is informed by, for example, the availability of housing stock. Social housing availability is lower in rural and island communities[61] and this influences changes observed in housing tenure between 2010 and 2023. The proportion of households living in owner occupied accommodation[62] decreased from 69.4% to 63.2% in remote small towns whereas an increase was noted in remote rural areas from 69.6% to 76.3% (Figure 16). Furthermore, a rise was seen in owner occupied households in accessible rural areas. This is against a backdrop of reduced homeownership and increased reliance on private rented accommodation across Scotland. The only area type that saw a small increase in the proportion of households living in social rented accommodation was remote small towns[63].

Source: Scottish Household Survey using the Scottish Government 6-fold Urban Rural Classification.
The experience of poverty is also influenced by the amount of money households spend on their housing. Figure 17 shows that the proportion of net income[64] households spend on their housing[65] continues to be higher in urban areas compared to rural areas. Whereas the housing affordability ratio has been relatively stable in remote rural and accessible rural areas, a small but steady decline was noted across other geographical areas resulting in a more closely aligned ratio. Although, households in large urban areas continue to spend a larger proportion of their income on housing than those in other areas.
Source: Family Resources Survey using the Scottish Government 6-fold Urban Rural Classification. Estimates for 2018-21 to 2020-23 are two year averages instead of three year averages due the impacts of the Coronavirus (COVID-19) pandemic on the survey.
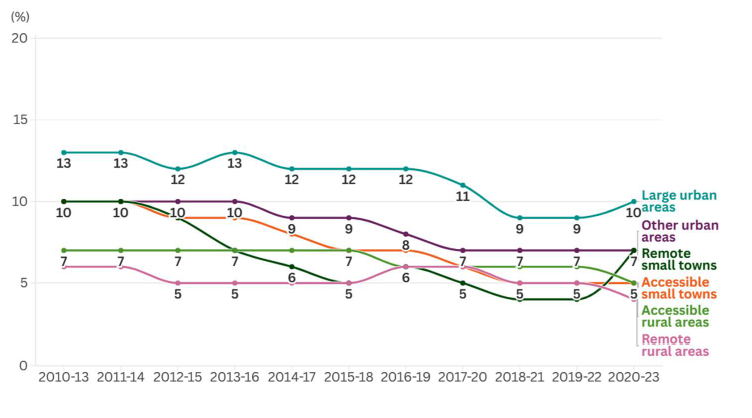
The uptick in relative poverty after housing costs between 2012 and 2017 did not impact different types of households equally. In 2012-15, about two in ten households in rented housing were in relative poverty in remote rural areas and this increased to four in ten households in 2018-21 (Figure 18). However, this reduced to just over three in ten households by 2020-23. A similar increase was observed for households in accessible rural areas. In contrast, rates of relative poverty among households who own their home outright or with a mortgage, remained relatively stable and comparable across rural areas and the rest of Scotland, at approximately 10%. When focusing on working-age people, similar findings were found.
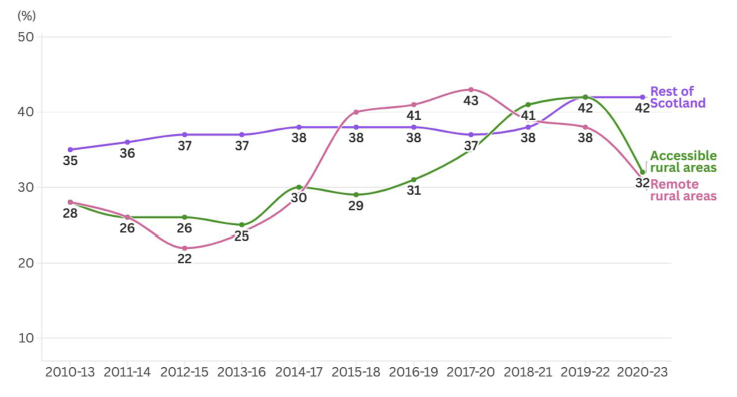
Source: Family Resources Survey using the Scottish Government 3-fold Urban Rural Classification. Estimates for 2018-21 to 2020-23 are two year averages instead of three year averages due the impacts of the Coronavirus (COVID-19) pandemic on the survey.
Across both urban and rural areas, a steady increase was noted in the relative child poverty rate among children living in rented housing. Estimates from 2020-23 indicated that one in two children in rented housing are in relative poverty, compared to just over one in three in 2010-13. No such upward trend was identified among children living in households who own their home outright or with a mortgage. A similar pattern was apparent among pensioners, although 2020-23 estimates indicated that approximately three in ten pensioners in rented housing were in relative poverty, compared to two in ten in 2010-13.
A potential driver of the increase in relative poverty raised by our stakeholders and experts by experience panel included the increase in short-term holiday lets in rural Scotland and the Scottish islands that may have disproportionally impacted island and rural communities. They believed that this development has further strained both the range of housing required and affordability, while also increasing competition for the limited remaining residential housing stock[66],[67],[68]. This was viewed to be compounded by limited social housing availability in rural and island communities. A Scottish Government report found that between 2016 and 2019 a three-fold increase was noted in the number of short-term holiday lets in Scotland listed on Airbnb[69]. Of those listed, one in two short-term lets were found in the City of Edinburgh and Highland. However, when looking at the number of Airbnb listings[70] by the total number of dwellings, nearly one in five dwellings in Skye were listed on Airbnb and nearly one in ten in Fort William. When focusing only on entire property listings (rather than all listings that may include letting out a room within an otherwise occupied home), this reduces to just over one in ten dwellings in Skye and one in twenty dwellings in Fort William. Insights from both the survey and interviews in that report pointed to an emerging trend where housing stock previously used for long-term housing was increasingly being repurposed as short-term holiday rentals. Most recent data from the Scottish Island Survey (2023) indicated that only one in ten islanders agreed that there is enough housing to meet local demand, down from two in ten in 2020[71].
Despite stakeholders’ concerns about short-term holiday lets impacting rural housing markets, private sector rental growth data suggests this may not be the core driver of the increase in poverty between 2012 and 2017, with rural areas generally experiencing more modest rental increases compared to urban areas during this period when poverty increased among all renters[72].
House prices across Scotland have increased, but findings from the Registers of Scotland indicated that prices rose at a quicker pace in the Scottish island regions compared to prices for mainland Scotland[73]. In the period from 2004 to 2023, the Scottish island regions[74] saw an increase in the median residential property price of 180% compared to 114% in mainland Scotland. When only focusing on the five years to 2023, the island regions saw a price increase of 30%, compared to 23% for mainland Scotland. As such, the median price of properties in the island regions as a whole was £182,000 compared to £185,000 for Scotland overall in 2023, although there are significant price differences between the island regions. When taking a closer look at house prices in urban and rural areas between 2016 and 2023, findings showed that median house prices in remote small towns, whether on the islands or mainland Scotland, were relatively aligned with overall Scottish house prices (Figure 19). In contrast, remote rural house prices in mainland Scotland were consistently higher than those in island remote rural areas. Hower, it is important to acknowledge that urban and rural house price comparisons can be affected by the type of housing stock. Urban areas have more flats, and these are typically cheaper than detached houses that are more common in rural areas[75].
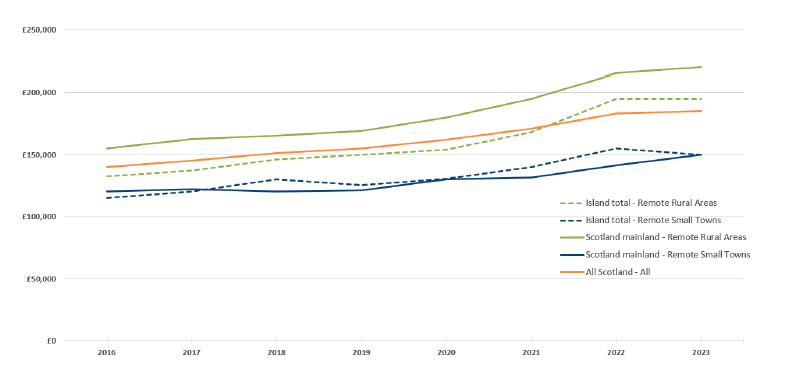
Data source: Registers of Scotland using Scottish Government 6-fold Urban Rural Classification. Graph derived from Registers of Scotland (2024) Residential property sales in Scottish Island regions report.
Input from our stakeholders and experts by experience panel highlighted differences in housing stock availability across geographical areas that are important to consider, which have also featured widely across Government reports and research done by other organisations[76],[77]. Rural and island communities have proportionally more older, larger and detached houses compared to urban areas which have more newer, smaller, terraced houses and flats. As dwelling characteristics associated with lower energy efficiency are disproportionately represented in rural areas, the average energy efficiency profile of rural properties is lower than in urban areas[78]. This is compounded by cold, wet and more windy climates in rural areas. Additionally, the majority of rural dwellings are not within gas grid coverage[79], meaning rural and island households are more reliant on electricity or unregulated fuels that often cost more than mains gas. These factors interact across the four recognised drivers of fuel poverty – energy efficiency, fuel costs, income levels and energy usage patterns[80] – leading to higher fuel poverty rates in rural and island communities. In engagement, stakeholders perceived that islanders were aware of financial support schemes to make residential properties more energy efficient, however, implementation was hampered by a lack of skilled workers to undertake the work. A housing stock mismatch was also reported, whereby large properties were available but local demand was for single-occupancy and small family homes.
Access to public and essential services
Stakeholders reported substantial centralisation of public services over recent years, with healthcare, community services and job centres either shifting to digital platforms or consolidating into larger towns and cities. The digital shift was not universally welcomed, as communities valued face-to-face interaction, experienced digital connectivity challenges around the cost and quality of connections, and some struggled with online systems, particularly older residents and those with limited technical skills. This service centralisation was seen as creating significant access barriers for remote communities, especially for households lacking adequate transport to reach remaining services or those unable to afford public transport costs[81],[82]. There was consensus among those spoken to that public transport provision has declined in rural and island areas over time. Even where public transport existed, poor service alignment was viewed as driving continued car dependency[83].
It was also discussed that island communities faced additional challenges, particularly when ferry services are disrupted by bad weather, preventing islanders from travelling to access education, employment, or healthcare with no alternative transport options[84]. On rare occasions, ferry disruptions cause supply chain interruptions, leaving local shops with empty shelves. While mainland rural communities retained road access during adverse weather, car-free households faced similar service access barriers[85],[86]. Service centralisation may reduce employment opportunities for people in island and rural communities. For example, the NHS as a community anchor institution plays an important employment role in these communities. Evidence indicates that NHS island Boards employ a higher percentage of the working-age population and women than NHS mainland Boards[87],[88]. Reducing local health services provision and consolidating central functions may therefore have a disproportionate impact on employment opportunities in island areas, with workers facing additional barriers from transport and childcare challenges compared to mainland areas.
Stakeholders and expert by experience panel members also took the view that limited retail competition in remote rural and island areas compounded these challenges, with households having restricted shopping options without traveling significant distances. Local convenience stores were seen to charge higher prices than supermarkets and stocked limited ranges dominated by more expensive branded products rather than cheaper own-brand alternatives. Stakeholders highlighted that affordable staple vegetables were often unavailable, while local shops stocked more expensive varieties and non-essentials like pineapple. It was suggested this disproportionately affected lower-income households who spend a larger share of their income on essential goods. While online shopping mitigated some of these concerns, delivery surcharges and extended wait times could disadvantage households in remote rural and island communities. Input from our stakeholders and expert by experience panel members indicated that these cumulative pressures contributed to a ‘rural premium’ that undermines household resilience against economic shocks, thereby disproportionately affecting low income households.
Welfare policies
Views from the experts by experience panel indicated that the implementation of Universal Credit may have contributed to the increasing rate of poverty in island and rural communities as well as the changing pattern of poverty with a larger proportion of children in low income families that are in work. The panel indicated that benefit take-up[89] may be lower as there is reduced access to support services available in rural and island communities in case people need help with their benefit claim (e.g. job centres, advice centres). Even so, if a local office is available, people may face transport barriers to get there. These barriers in combination with higher levels of digital exclusion experienced in rural and island communities, a higher proportion of older adults who may lack digital skills to make an application online, poorer broadband or mobile phone coverage (and at a higher cost), potentially higher levels of benefits stigma and reduced anonymity in close knit communities, were thought to hamper benefit take-up. In addition, considering the reduction of the real-term value of benefits over the years[90], in combination with the ‘rural premium’ experienced in these communities, it was felt that the minimum income required to achieve the same standard of living would be substantially higher for people who did successfully claim benefits[91]. There is scarce evidence to support or refute these suggestions around benefit take-up in rural and island communities specifically[92]. Previous research indicated that households in rural areas were as likely to claim benefits they were eligible for as households in urban areas, although this research was carried out before the implementation of Universal Credit[93].
Geopolitical developments
Stakeholders and expert by experience panel members spoke about the possible negative impact of the lead up to, and aftermath of, Brexit on the rate and patterns of poverty experienced by rural and island communities during the period of the notable relative poverty increase in remote areas. A Scottish Government report highlighted areas in Scotland that were likely to face the greatest impact from Brexit and its key contributing factors[94]. Many of the most vulnerable areas[95] identified were in rural locations and particularly on the Scottish islands (Figure 20).
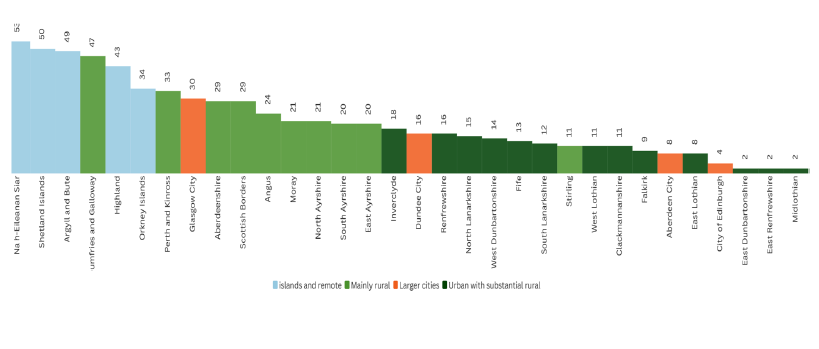
Source: Data from the Brexit Vulnerabilities Index (Scottish Government) by 4-fold Rural and Environment Science and Analytical Services classification. Graph recreated using data from the Scottish Government (2019) Local Level Brexit vulnerabilities in Scotland: Brexit Vulnerabilities Index (BVI) repor t.
It is likely that the vote to leave the EU in June 2016 had a significant and disproportionate effect on Scotland’s rural and island communities. These areas are often reliant on sectors such as agriculture, fishing and tourism, that may have experienced a sharp decline in business confidence due to uncertainty over future trade arrangements, labour availability and the loss of EU funding. Many rural businesses are dependent on access to European markets and seasonal or skilled EU workers, particularly in farming, food processing and hospitality. The reduction in EU migration most likely intensified existing labour shortages, further challenging local economies already facing a shrinking working-age population and limited workforce mobility.
Contact
Email: ocspa@gov.scot