Understanding the changing nature and context of poverty in Scottish rural and island communities since 2010
Analysis of existing data to compare poverty trends and potential drivers across Scottish rural and island communities from 2010, with policy and research implications.
2. Trends and patterns of poverty in rural and island communities in Scotland
Key findings
Trends in rural and island poverty
- Post-2010 analysis showed that while rural Scotland continues to experience lower overall poverty rates than urban areas, significant and changing disparities in rates of poverty exist between and within rural, remote and island communities.
- Remote rural areas (including most Scottish islands) and remote small towns[18] have experienced a marked and consistent, although temporary, increase in relative poverty after housing costs between 2012 and 2017, a trend not seen elsewhere in Scotland.
- In remote areas, the poverty rate increased from one in eight individuals to one in five individuals during this period, resulting in poverty rates more closely aligned with those seen in urban areas.
- The steep increase in relative poverty primarily affected working-age individuals in remote areas.
- Since 2018, relative poverty rates in remote areas have broadly returned to the lower levels seen before this period.
- Accessible rural areas only saw a consistent small increase in relative poverty between 2015 and 2019 from one in seven individuals to one in six individuals.
- Child poverty continued to be less prevalent in accessible rural areas than in the rest of Scotland between 2010-13 and 2020-23.
- However, a small but steady increase in child poverty was noted in accessible rural areas from one in seven children in 2014-17 to one in five children in 2018-21, narrowing the gap between child poverty rates in these areas and in the rest of Scotland during this period.
- Relative poverty rates among pensioners showed a consistent, slightly rising trend across Scotland, with rates remaining geographically comparable across areas. In 2020-23, approximately one in seven pensioners were in relative poverty, up from one in eight in 2010-13.
- In-work poverty increased in both remote and accessible rural areas, with rates now approaching those seen in the rest of Scotland. Approximately one in seven working households were in poverty.
Children in low income families
- In addition to child poverty rates, data on children in low income families were explored to provide a more robust and complete picture of economic disadvantage and family structures across different geographical areas.
- Despite lower baseline rates of children in low income families, islands and remote areas[19] experienced the same rising trend affecting all of Scotland. Overall, the proportion of children in relative low income families has increased from one in seven to one in five children between 2015 and 2023[20]. Importantly, islands and remote areas showed a distinct poverty profile: nearly threequarters of children in relative low income families are in families where someone is in work compared to six in ten in other areas.
- Since 2015, relative low income families in rural, islands and remote areas have shown a steady increase in the proportion of children in lone parent families, and they now represent a majority. The opposite pattern is seen in larger cities.
Fuel poverty
- In Scotland, fuel poverty rates declined between 2013 and 2019, particularly in large urban areas and accessible small towns, from one in three households to one in four households in fuel poverty.
- In 2019, households in remote rural areas experienced higher levels of fuel poverty than households in other geographical areas, except for households in remote small towns that showed similar levels. Four in ten households in remote rural areas were fuel poor in 2019.
- In 2013, in remote rural areas nearly seven in ten fuel poor households were in extreme fuel poverty. Nearly eight in ten fuel poor households were in extreme fuel poverty by 2019.
- In 2023, one in three households were fuel poor in Scotland, indicating a reversal of the declining trend seen up to 2019.
Poverty proxies
- Food insecurity remains lower in rural areas compared to the rest of Scotland. In 2019-22 and 2020-23, approximately one in ten households in rural areas were food insecure compared to one in seven households in the rest of Scotland.
- Free school meal registrations increased across Scotland between 2018 and 2023, with rural areas showing the smallest rise and thus retaining lower registration rates compared to other geographical areas.
Findings
Relative and absolute poverty
In the period since 2010 relative poverty[21] rates in rural areas remained lower compared to urban areas. Despite this, relative poverty rates steadily increased between 2012 and 2018 in rural areas but not in urban areas, narrowing the gap (Figure 2). However, between 2019-22 and 2020-23, relative poverty rates in rural areas in Scotland reduced, widening the gap again between urban and rural areas, although most recent data suggested a reversal of this trend[22].
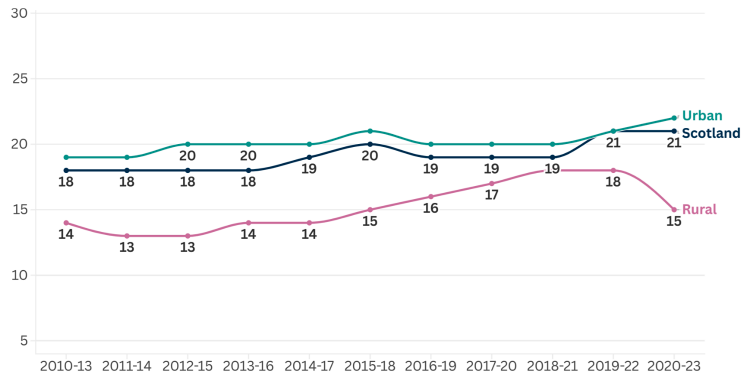
Source: Family Resources Survey using the Scottish Government 2-fold Urban Rural Classification. Estimates for 2018-21 to 2020-23 are two year averages instead of three year averages due the impacts of the Coronavirus (COVID-19) pandemic on the survey.
At a lower level of geography, a more nuanced picture emerged, though some rates are volatile due to reduced sample sizes[23]. There was a steep increase in relative poverty in remote rural areas and remote small towns[24] between 2012 and 2017, before rates decreased to previously observed levels (Figure 3). For example, the rate of relative poverty doubled from 11% to 22% in remote small towns during this period (temporarily exceeding the urban rate). Accessible rural areas only saw a consistent slight increase from 2015-18 onwards. A diverging trend of decreasing relative poverty was noted in accessible small towns but rates are volatile. These trends were mirrored when looking at relative severe poverty as well as when exploring both outcomes for working-age people only[25].
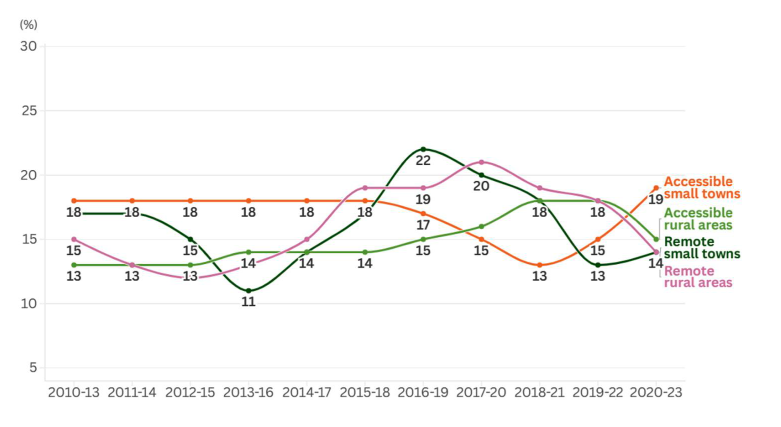
Source: Family Resources Survey using the Scottish Government 6-fold Urban Rural Classification. Estimates for large and other urban areas can be found in the supporting documentation. Estimates for 2018-21 to 2020-23 are two year averages instead of three year averages due the impacts of the Coronavirus (COVID-19) pandemic on the survey.
The relative poverty rate among pensioners showed a consistent, slightly rising trend across all areas in Scotland, increasing from around 12% in 2010-13 to around 15% in 2020-23, with rates remaining geographically comparable (Table 1).
| 2010–13 | 2011–14 | 2012–15 | 2013–16 | 2014–17 | 2015–18 | 2016–19 | 2017–20 | 2018–21 | 2019–22 | 2020–23 | |
|---|---|---|---|---|---|---|---|---|---|---|---|
| Scotland | 12% | 12% | 12% | 12% | 13% | 14% | 15% | 14% | 14% | 15% | 15% |
| Rest of Scotland | 11% | 12% | 12% | 13% | 14% | 15% | 15% | 15% | 14% | 15% | 15% |
| Accessible rural areas | 12% | 11% | 12% | 15% | 16% | 16% | 14% | 15% | 16% | 17% | 14% |
| Remote rural areas | [u] | [u] | [u] | [u] | [u] | [u] | [u] | [u] | [u] | [u] | [u] |
Source: Family Resources Survey using the Scottish Government 3-fold Urban Rural Classification. Estimates for 2018-21 to 2020-23 are two year averages instead of three year averages due the impacts of the Coronavirus (COVID-19) pandemic on the survey. [u]: Unreliable due to small sample size. Rest of Scotland includes urban areas and small towns.
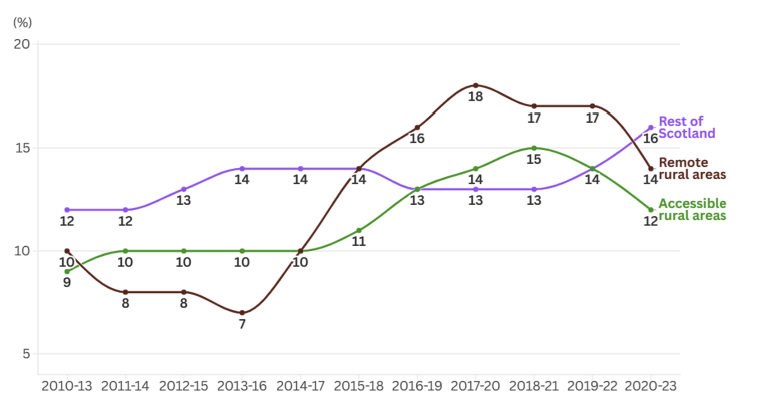
The rate of child poverty has been broadly stable across Scotland since 2010, although a small but mostly steady increase was seen in rural child poverty mirroring the period of the relative poverty increase seen among all people (Figure 2)[26] before returning to previous levels. Some differences were noted between geographical areas. For example, a distinct gap in the relative child poverty rate between accessible rural areas and the rest of Scotland remained between 2010 and 2013: the rate of relative child poverty was 15% among children living in accessible rural areas (2010-13), compared to 22% in the rest of Scotland (Figure 4). For the latter, this increased to 28% in 2020-23, whereas the former remained stable at 16%[27]. A similar upward trend was noted when exploring severe relative child poverty[28] for the rest of Scotland, whereas the rate remained consistent in accessible rural areas. The gap in the absolute poverty rate, whereby children live in a household with an income below 60% of the 2010/11 UK median income, has been broadly stable; children living in remote rural areas are less likely to be living in absolute poverty compared to those living in the rest of Scotland (15% versus 23% in 2010-13 and 15% versus 24% in 2020-23).
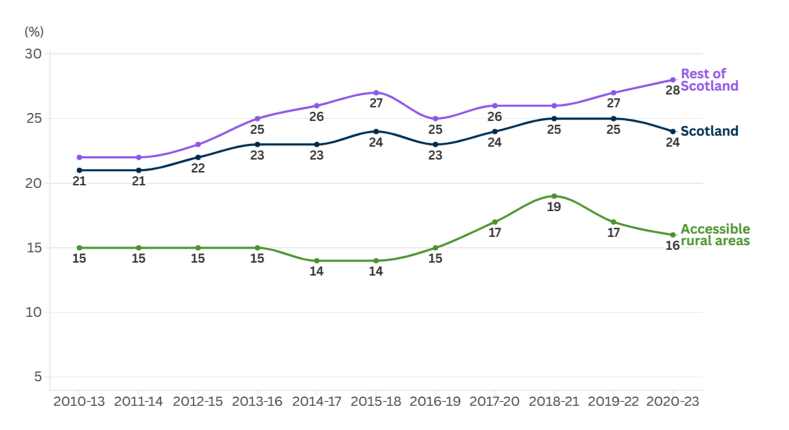
Source: Family Resources Survey using the Scottish Government 3-fold Urban Rural Classification. Estimates for 2018-21 to 2020-23 are two year averages instead of three year averages due the impacts of the Coronavirus (COVID-19) pandemic on the survey. Remote rural area estimates are unreliable due to small sample size and cannot be presented. Rest of Scotland includes urban areas and small towns.
Household characteristics and poverty
Poverty trends and patterns may differ depending on household characteristics. The relative poverty rate among households with a disabled person saw a sustained increase over time in accessible rural areas, from 15% in 2010-23 to 21% in 2020-23, while remaining broadly stable in the rest of Scotland at 23% in 2010-13 and 25% in 2020-23. In addition, there was a marked increase in the relative poverty rate among single adult households in rural areas from 24% in 2010-13 to 32% in 2015-18, before a steady decline to levels previously seen. In contrast, the relative poverty rate among single adult households in urban areas remained broadly stable over the same period. Similar poverty trends and patterns were noted when restricting these analyses to working-age people.
Remote rural and accessible rural areas both experienced increases in the rates of working-age poverty among working households, peaking in 2016-19 and 2018-21 respectively, before broadly stabilizing, while the rest of Scotland saw a marginal upward trend since 2010 (Figure 5). Despite recent improvements, poverty rates in rural working households continue to be more closely aligned with urban rates and remain higher than before 2014-17.
Source: Family Resources Survey using the Scottish Government 3-fold Urban Rural Classification. Estimates for 2018-21 to 2020-23 are two year averages instead of three year averages due the impacts of the Coronavirus (COVID-19) pandemic on the survey. Rest of Scotland includes urban areas and small towns.
Children in low income families
This section presents an analysis of the ‘Children in Low Income Families (CiLIF) dataset’[29],[30]. Data on children in low income families were explored to provide a more robust and complete picture of economic disadvantage and family structures across different geographical areas. The proportion of children in relative low income families continues to be the lowest in islands and remote areas[31] compared to other areas, despite a steady increase over time across geographical areas[32]. Figure 6 shows that 10.5% of children in island and remote communities were in relative low income families in 2015 compared to 17.8% in 2023[33]. In 2015, 13-14% of the children in mainly rural or urban with substantial rural areas were in relative low income families, increasing to 20-21% in 2023. The increase in the proportion of children in relative low income families was even more pronounced among those in large cities. A similar upward trend and geographical pattern was found when focusing on children in absolute low income families[34].
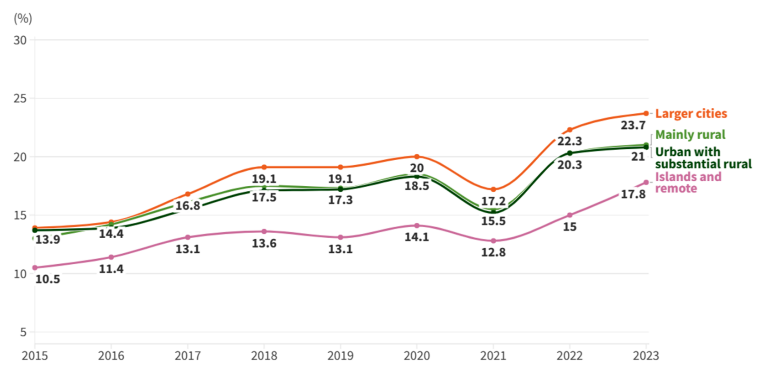
Source: Children in Low Income Families (CiLIF) using the 4-fold Rural and Environment Science and Analytical Services classification. Caution needed for the interpretation of 2021 estimates due to the impact of the Coronavirus (COVID-19) pandemic.
In island and remote communities, children in relative low income families are much more likely to be in a working household compared with other areas, with nearly three in four living in families where someone is in work[35]. This was followed at a distance by those living in mainly rural areas (Figure 7), a gap that has widened since 2015. A similar trend was observed when exploring family work status among children in absolute low income families.
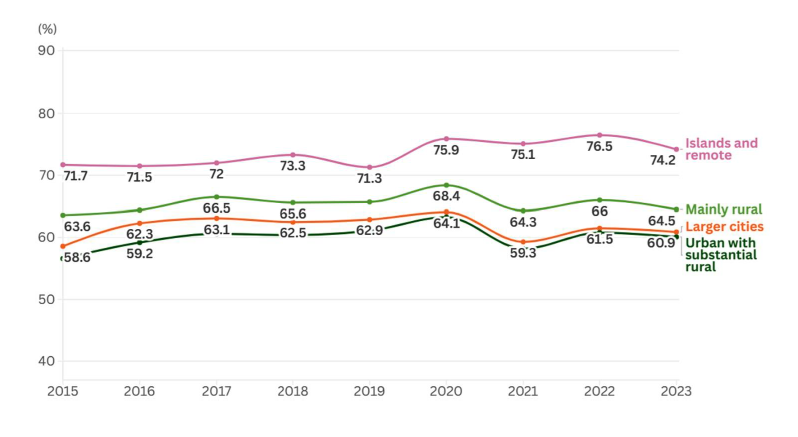
Source: Children in Low Income Families (CiLIF) using the 4-fold Rural and Environment Science and Analytical Services classification. Caution needed for the interpretation of 2021 estimates due to the impact of the Coronavirus (COVID-19) pandemic.
Since 2015, relative low income families in rural, islands and remote areas have shown a steady increase in the proportion of children in lone parent families[36], and they now represent a majority. The opposite pattern is seen in larger cities (Figure 8). Among absolute low income families, this steady increase in the proportion of children in lone parent families was apparent across all geographical areas including larger cities. On a population level, a decrease in the proportion of lone parent families has been observed between 2011 and 2022[37], although this analysis was not restricted to families claiming means-tested benefits as is the case in the CiLIF dataset.
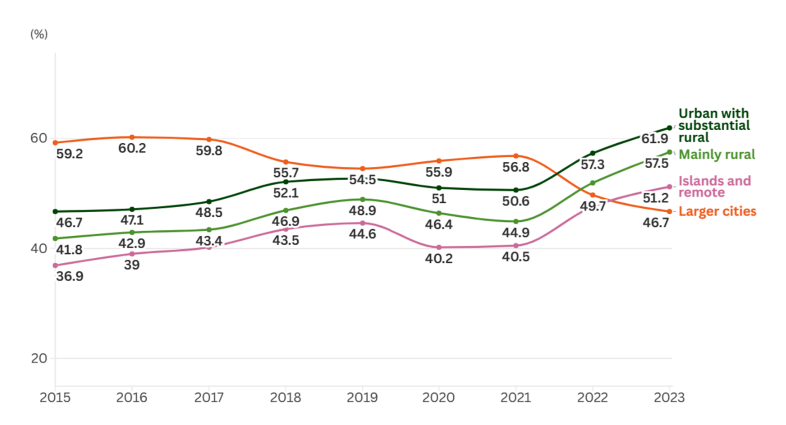
Source: Children in Low Income Families (CiLIF) using the 4-fold Rural and Environment Science and Analytical Services classification. Caution needed for the interpretation of 2021 estimates due to the impact of the Coronavirus (COVID-19) pandemic.
Fuel poverty and heating satisfaction
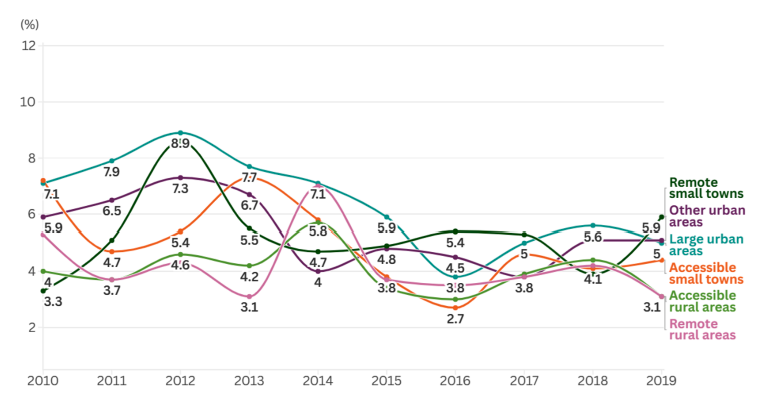
Rates of fuel poverty[38] declined in Scotland overall from 31.7% in 2013 to 24.6% in 2019. However, over the same period, no such declining trend was noted in remote rural areas or remote small towns (Figure 9).
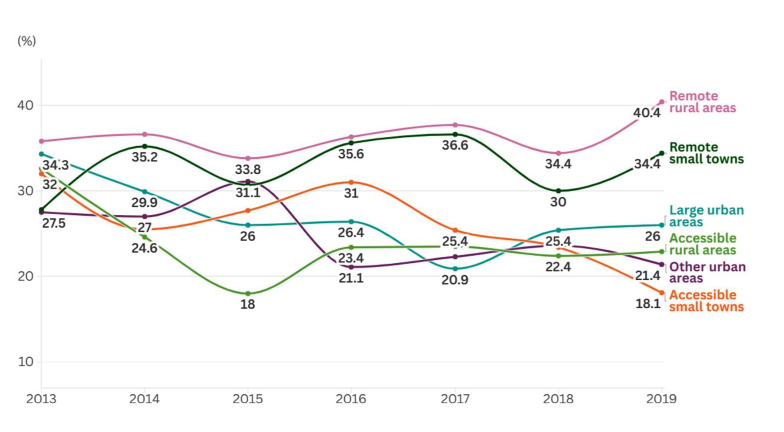
Source: Scottish House Condition Survey using the Scottish Government 6-fold Urban Rural Classification.
In 2019, four in ten households in remote rural areas were in fuel poverty, and this rate was higher compared to other geographical areas, except for remote small towns where rates were broadly similar. As such, rates of fuel poverty have become more divergent over time when comparing households in remote areas with those in other geographical areas. In 2023, the fuel poverty rate was 34% in Scotland indicating a reversal of the declining trend seen up to 2019[39]. The recent data showed a similar geographical pattern with the highest rates of fuel poverty in remote rural areas and remote small towns with two in five households in these areas experiencing fuel poverty.
Across geographical areas, rates of extreme fuel poverty[40] declined or remained relatively stable between 2013 and 2019. However, in remote rural areas, the proportion of households in extreme fuel poverty was 24.6% in 2013 compared with 31.8% in 2019, while similar. Among fuel poor households in remote rural areas, nearly eight in ten were in extreme fuel poverty in 2019 compared to approximately five in ten in other areas (Figure 10). More recent estimates suggest that in Scotland overall, levels of extreme fuel poverty have increased from 12.4% in 2019 to 19.4% in 2023. Evidence from the Scottish House Condition Survey (2023) indicates that households with incomes below £15,000, social sector tenants, properties using electricity as the primary heating fuel, dwellings with poor energy ratings and households outside gas grid coverage were more likely to be in extreme fuel poverty[41].
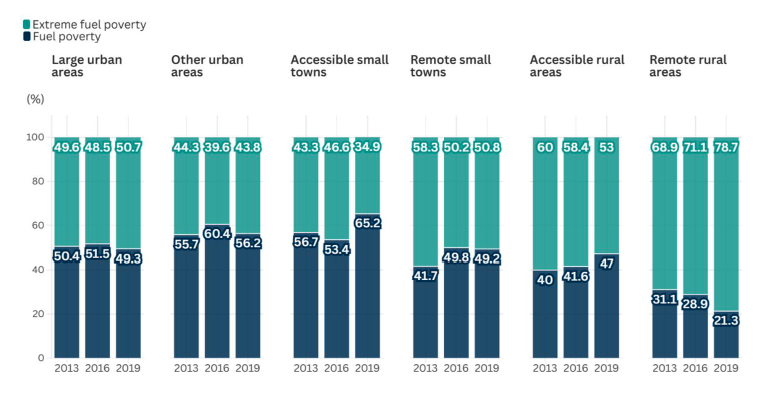
Source: Scottish House Condition Survey using the Scottish Government 6-fold Urban Rural Classification.
Views from the experts by experience panel suggested that households outside gas grid coverage had limited options to purchase alternative fuel due to restricted supplier competition and unregulated prices. Addressing heating costs was highlighted as an important priority for supporting people facing financial hardship in remote rural and island communities. Panel members reported that those unable to adequately heat their homes during cold and windy weather experienced negative impacts on their physical and mental health, indicating that fuel poverty could also be seen as a public health concern.
Household’s views on their ability to keep warm in the winter provide a useful context for understanding fuel poverty statistics and energy efficiency in the home. Heating satisfaction[42] has improved across geographical areas; in 2012 approximately one in four households reported that their heating kept them warm enough only sometimes or never in winter compared to approximately one in six in 2019. However, this trend was reversed somewhat when looking at more recent estimates with one in five households reporting heating dissatisfaction in 2023. In general, satisfaction with heating was slightly higher in accessible small towns and other urban areas while urban and remote areas were more likely to be dissatisfied. In 2023, 28.7% of island households reported that their heating kept them warm enough only sometimes or never in winter compared to 21.7% in Scotland overall.
Perceived household finances, affordability of transport and childcare
An alternative way of understanding the experience of poverty is exploring how well households report they are managing financially[43]. Despite some volatility in the estimates between 2010 and 2016, the proportion of households reporting some or deep financial difficulties declined over that time resulting in closely aligned rates across geographical areas (Figure 11). Most recent estimates from 2023 indicated that 1.8% of Scottish islanders reported some or deep financial difficulties, while the Scottish rate was 4.0%.
Source: Scottish Household Survey using the Scottish Government 6-fold Urban Rural Classification.
Household’s views on the affordability of transport and childcare provide a useful context in understanding the experiences of poverty. Across all geographical areas, an improvement in the perceived affordability of transport was observed between 2022-23 whereby a smaller proportion of households reported difficulties affording transport, with the sharpest decline seen in both accessible (14.9% versus 6.3%) and remote rural areas (13.9% versus 7.3%) versus the rest of Scotland (10.4% versus 8.4%)[44]. This compared to 5.9% of households on the islands (2023). Further data are required to see whether this trend continues over time.
Approximately one in four households reported difficulties affording childcare in 2018-19 and this was broadly comparable across geographical areas[45]. In 2022-23 this reduced to approximately one in seven households, most likely coinciding with the phased roll-out of funded childcare in Scotland from 2021 onwards[46]. Only one in ten island households reported difficulties affording childcare in 2023[47]. However, views from stakeholders and the experts by experience panel highlighted that in some island and rural communities, childcare opportunities were not available, partly due to recruitment challenges in early years education, or did not meet the needs of the families, suggesting that the availability of sufficient childcare places, and not affordability, was the most pertinent issue.
Food security and free school meal registrations
Food insecurity remains lower in rural areas compared to the rest of Scotland. Approximately one in ten households in rural areas were food insecure compared to one in seven households in the rest of Scotland (Table 2)[48]. A similar pattern was noted when focusing on households with children, with lower rates of food insecurity observed in rural households compared to urban households, 13% versus 25% respectively (2020-23).
| 2019–22 | 2020-23 | |
|---|---|---|
| Scotland | 14% | 16% |
| Rest of Scotland | 16% | 18% |
| Accessible rural areas | 9% | 11% |
| Remote rural areas | 9% | 7% |
Source: Family Resources Survey using the Scottish Government 3-fold Urban Rural Classification. Estimates for 2019-22 to 2020-23 are two year averages instead of three year averages due the impacts of the Coronavirus (COVID-19) pandemic on the survey. Rest of Scotland includes urban areas and small towns.
The proportion of children registered for free school meals[49] in primary school (P6-P7) increased across geographical areas from 2018 to 2023 with the steepest increase in large urban areas and remote small towns, 6.2% and 7.0% respectively[50] (Figure 12). Both accessible and remote rural areas continue to have substantially lower rates of children registered for free school meals compared to other areas. This trend was also reflected among secondary school children (S1-S6).
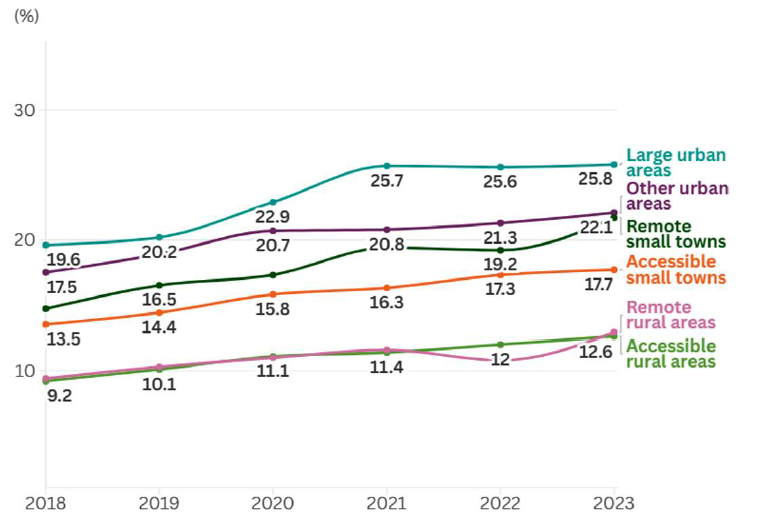
Source: Pupil Census using the Scottish Government 6-fold Urban Rural Classification. Caution needed for the interpretation of 2021 estimates due to the impact of the Coronavirus (COVID-19) pandemic.
Contact
Email: ocspa@gov.scot