Tackling Child Poverty delivery plan: progress report 2025-2026 - annex A - child poverty measurement framework
Child poverty measurement framework with the latest data on the drivers of child poverty. The indicators in the child poverty measurement framework are intended to monitor these drivers of poverty.
Driver: Cost of Living
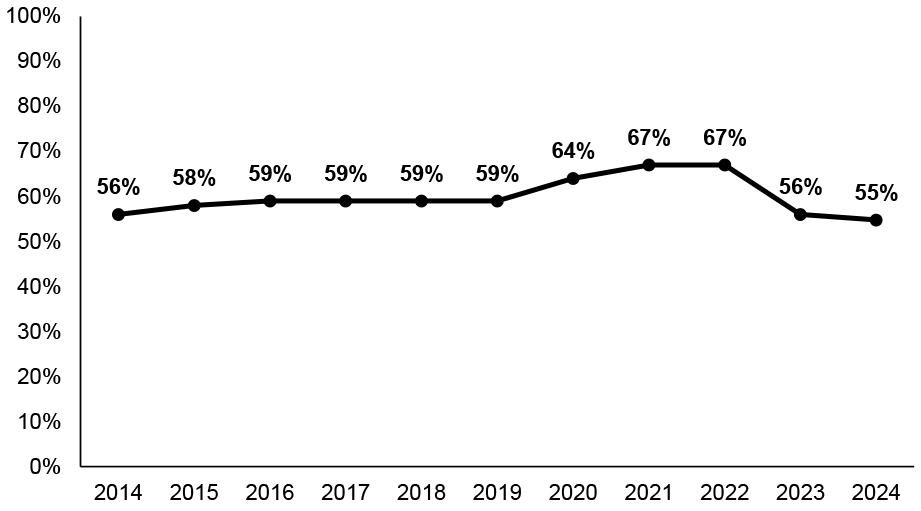
Indicator 8: Childcare availability - Holidays
Percentage of settings providing children's day care places that operate during the school holidays. Day care is care provided for infants and toddlers, pre-schoolers and school-aged children in a centre-based facility, such as a nursery, playgroup or afterschool club.
Source: Care Inspectorate Data
How this indicator relates to the child poverty targets:
Relative poverty √
Absolute poverty √
Low income + material deprivation √
Persistent poverty √
A lack of childcare availability during the school holidays can limit opportunities for paid employment.
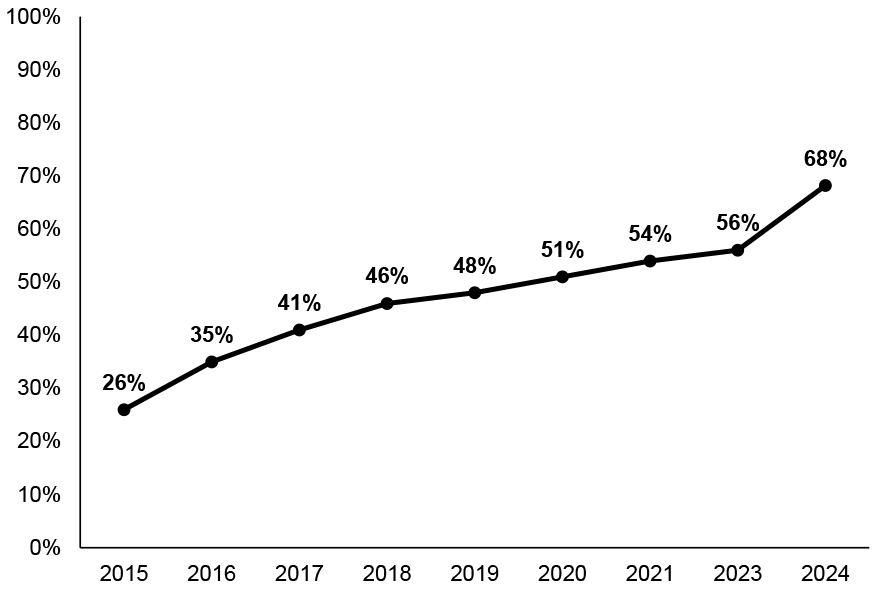
Indicator 9: Childcare availability – Outside school hours
Percentage of children's day care places that are in settings that are open before, during and after school hours.
Source: Care Inspectorate Data
How this indicator relates to the child poverty targets:
Relative poverty √
Absolute poverty √
Low income + material deprivation √
Persistent poverty √
A lack of childcare availability outside of school hours can limit opportunities for paid employment.
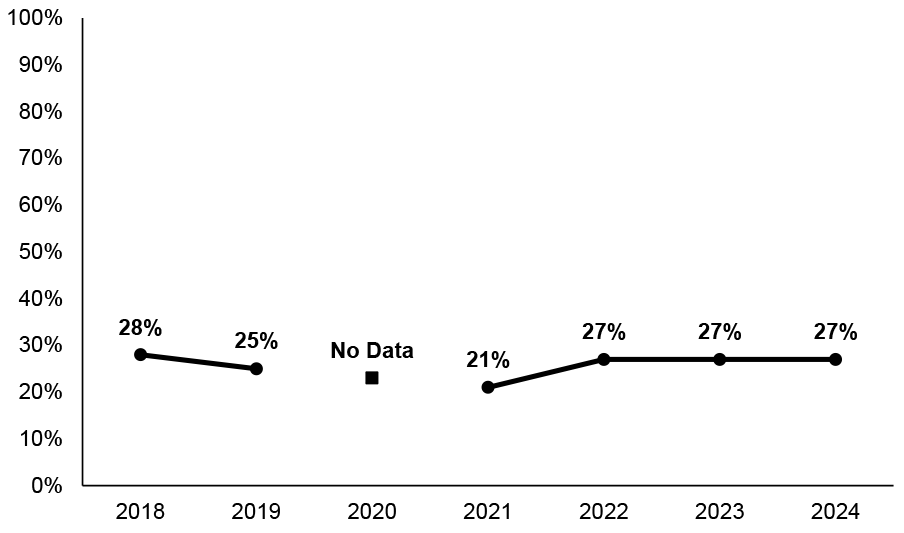
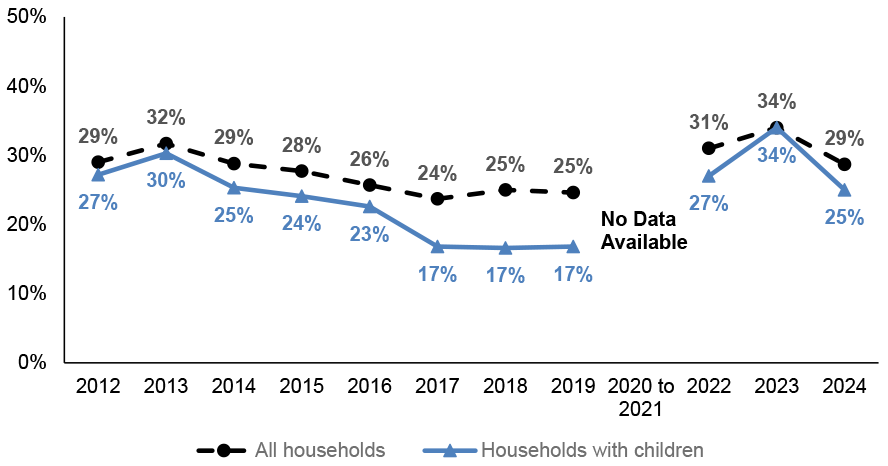
Indicator 10: Childcare affordability
Percentage of households with one or more children aged between 0 and 11 who pay for childcare and that say they find it difficult or very difficult to afford their household’s childcare costs.
Source: Scottish Household Survey. There was a question change between 2019 and 2020. Before 2020, the question was only asked amongst those paying for childcare. From 2020 onwards, this question was asked of all households. In 2020, due to COVID related restrictions on data collection, the sample size was too small to show the percentage for only those paying for childcare so there is a gap in the time series. However, we are able to show this for 2021 onwards.
How this indicator relates to the child poverty targets:
Relative poverty √
Absolute poverty √
Low income + material deprivation √
Persistent poverty √
Childcare can be a significant cost for households with children. And a lack of affordable childcare can limit opportunities for paid employment.
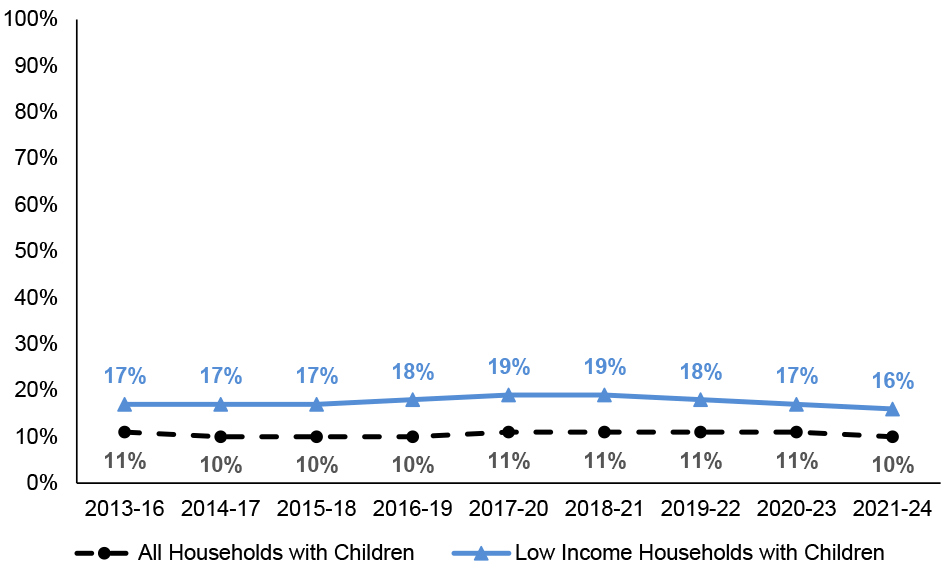
Indicator 11: Childcare costs
Annual household spend on childcare (all households with children 0-11 paying for childcare) as a percentage of annual income. Source: Scottish Household Survey
The proportion of households with children spending 0% of income on childcare. Source: Scottish Household Survey
How this indicator relates to the child poverty targets:
Relative poverty √
Absolute poverty √
Low income + material deprivation √
Persistent poverty √
Childcare can be a significant cost for households with children. A lack of affordable childcare can limit opportunities for paid employment.
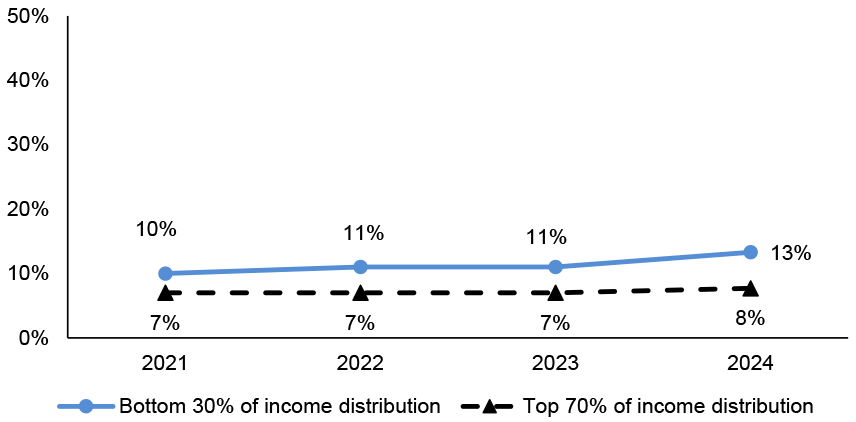
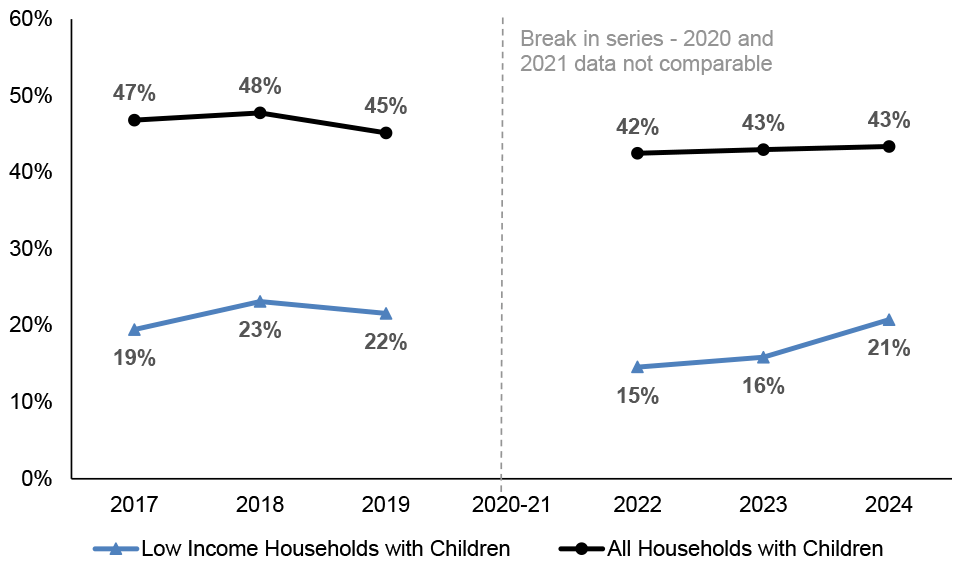
Indicator 12: Transport affordability
Percentage of people, from low-income families with children, reporting that they find it fairly, or very, difficult to afford their individual transport costs.
While this indicator is now being updated as a time series the 2022 figures are not considered comparable with 2021. In 2021 the Scottish Household Survey was being conducted by phone due to COVID restrictions and in 2022 returned to face-to-face interviews (as had been the case pre-COVID). 2021 had a lower response rate and a change in the profile of respondents compared to typical survey years.
Although the 2021 and 2022 figures aren’t considered comparable, travel costs are likely to be higher in 2022 than 2021 due to restrictions on travel in 2021 and higher fuel prices in 2022.
Source: Transport Scotland analysis of Scottish Household Survey
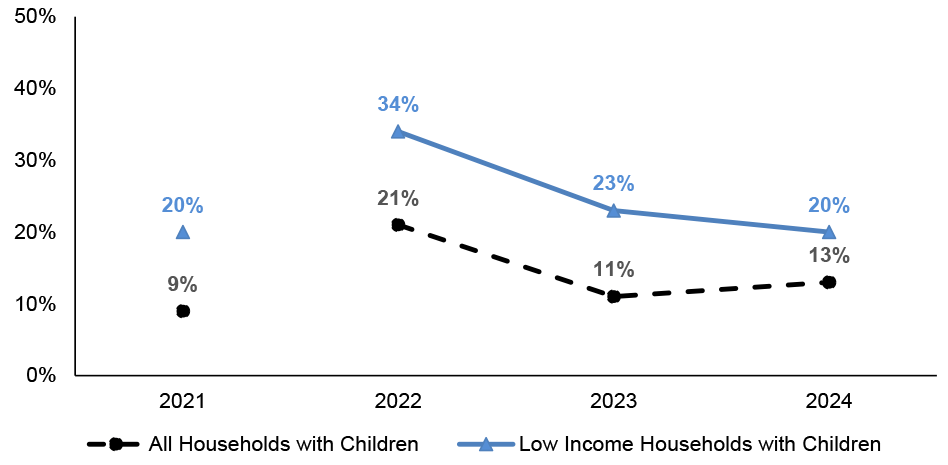
How this indicator relates to the child poverty targets:
Relative poverty √
Absolute poverty √
Low income + material deprivation √
Persistent poverty √
Lack of affordable transport options can restrict people’s access to goods and services (for example, having a choice of where to shop which could save money). It may also limit access to employability as the cost of travelling for work detracts from potential earnings.
Indicator 13: Transport costs
Percentage of income spent on transport costs by low-income households with children (median proportion spent of annual net income).
While this indicator is now being updated as a time series the 2022 figures are not considered comparable with 2021. In 2021 the Scottish Household Survey was being conducted by phone due to COVID restrictions and in 2022 returned to face-to-face interviews (as had been the case pre-COVID). 2021 had a lower response rate and a change in the profile of respondents compared to typical survey years.
Although the 2021 and 2022 figures aren’t considered comparable, travel costs are likely to be higher in 2022 than 2021 due to restrictions on travel in 2021 and higher fuel prices in 2022.
Source: Transport Scotland analysis of Scottish Household Survey
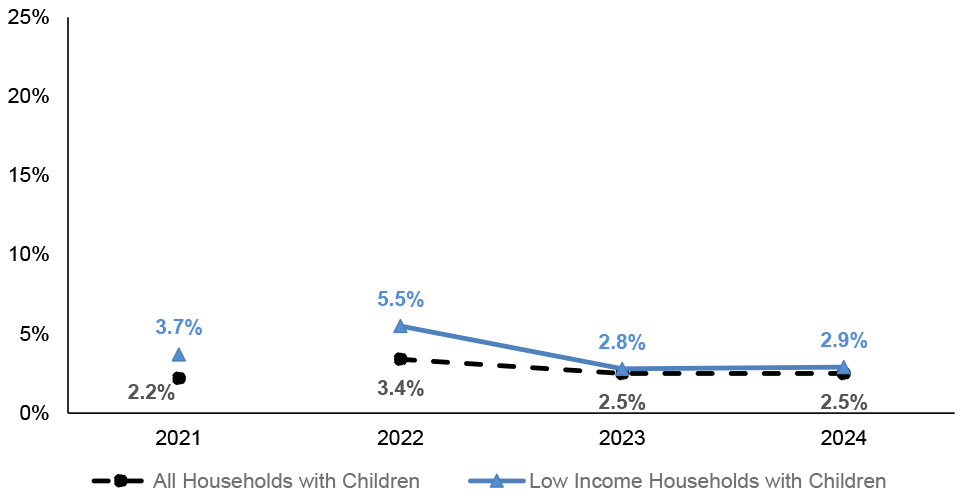
How this indicator relates to the child poverty targets:
Relative poverty √
Absolute poverty √
Low income + material deprivation √
Persistent poverty √
Transport costs are a largely unavoidable expense and higher spend on transport can contribute to households experiencing material deprivation.
Indicator 14: Housing costs
Percentage of net household income spent on housing by low income households (bottom three income deciles) with children. Figures for all households with children are also provided for context.
Source: Family Resources Survey. Note, due to data linkage carried out to benefits data the 2019-22 estimates have been suppressed.
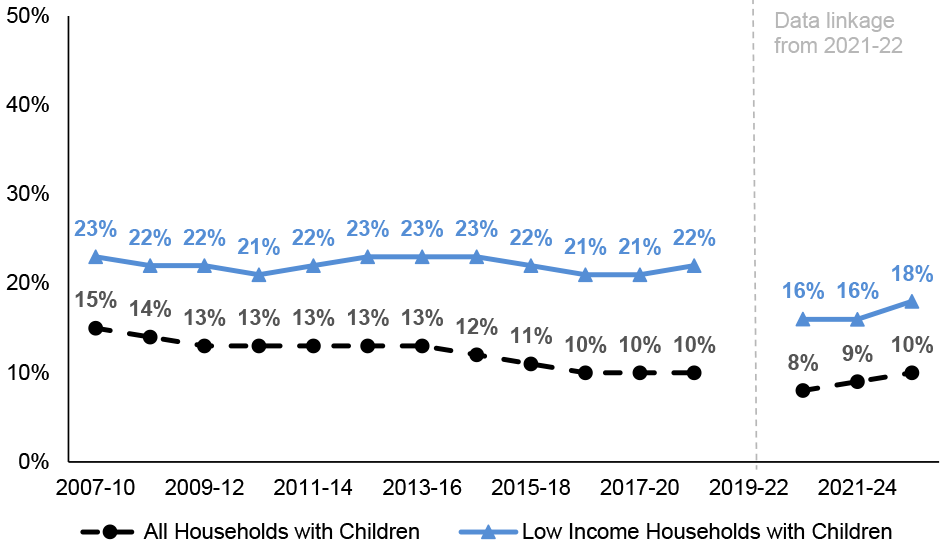
How this indicator relates to the child poverty targets:
Low income + material deprivation √
Housing costs are often the largest single cost a household will face, particularly for those on low incomes. All four of the child poverty targets are based on the income that households have left after housing costs have been deducted.
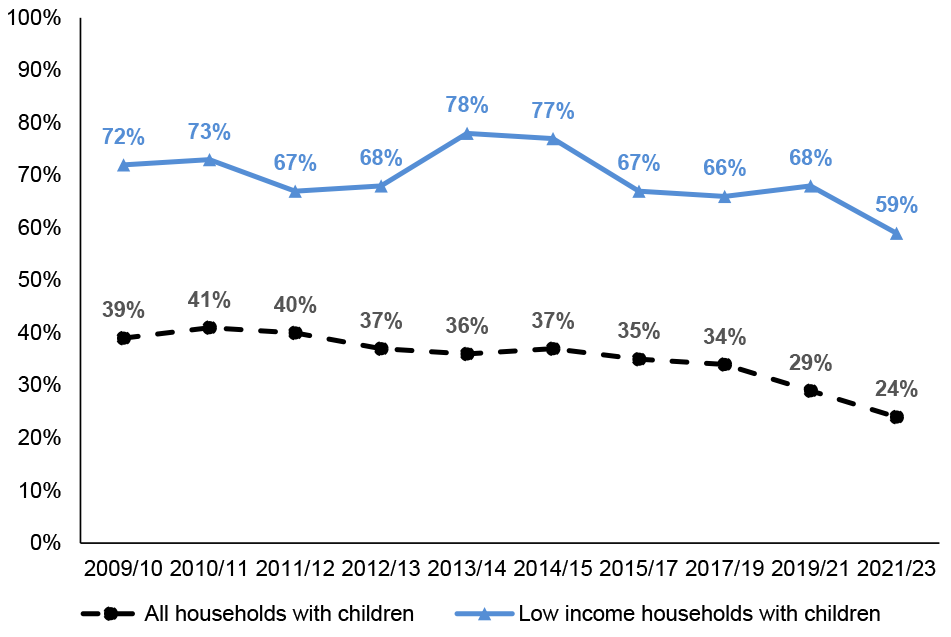
Indicator 15: Fuel poverty
The percentage of households with children in fuel poverty or extreme fuel poverty. The rate for all households is shown for comparison.
A household is in fuel poverty if:
- in order to maintain a satisfactory heating regime, total fuel costs necessary for the home are more than 10% of the household's adjusted (i.e. after housing costs) net income; and
- if, after deducting those fuel costs, benefits received for a care need or disability and childcare costs, the household's remaining adjusted net income is insufficient to maintain an acceptable standard of living.
Source: Scottish House Condition Survey (SHCS). Due to Covid-19 restrictions the 2020 SHS and the 2021 SHS were undertaken using a push to telephone/video approach. It was not possible to resume the 2020 SHCS but the 2021 SHCS was undertaken using an external+ approach. However, due to the change in approach for the 2021 SHCS, the results are not directly comparable with the National Statistics from previous waves of the survey. The 2022 SHCS returned to full in-home surveying in April 2022, and was published as Accredited Official Statistics in February 2024.
How this indicator relates to the child poverty targets:
Relative poverty √
Absolute poverty √
Low income + material deprivation √
Persistent poverty √
Fuel costs are not deducted from income for the purposes of determining whether a household is in income poverty. However, spending a high proportion of household income on fuel is a risk factor for material deprivation as households may struggle to afford a reasonable standard of living.
Indicator 16: Food affordability
Percentage of net income spent on food and non-alcoholic drinks by low income households with children. The rate for all households with children is shown for comparison.
Source: Living Cost and Food Survey
How this indicator relates to the child poverty targets:
Relative poverty √
Absolute poverty √
Low income + material deprivation √
Persistent poverty √
Food costs are not deducted from income for the purposes of determining whether a household is in income poverty. They do, however, affect the risk of material deprivation, as families spending a greater percentage of their income on food will be less likely to afford essential goods and services.
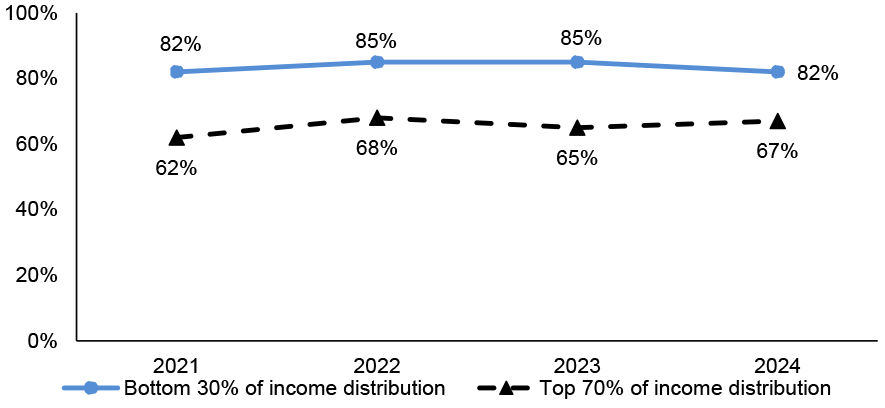
Indicator 17: Managing Well Financially
Percentage of low income households with children who feel that they are managing well financially, figures are also provided for all households with children for comparison. Note, this is a new indicator included in 2026.
Source: Scottish Household Survey. The results of the 2020 and 2021 SHS telephone surveys were published as experimental statistics. They are not directly comparable to SHS face-to-face survey results for other years and are not presented in time series data.
How this indicator relates to the child poverty targets:
Low income + material deprivation √
How well families feel they are managing financially gives an indication of the stability of household finances, alongside the “no savings” indicator this provides a picture of financial wellbeing for low income households with children.
Indicator 18: No savings
Percentage of low income households (bottom three income deciles) with children that have no savings (survey respondents answering that they have no savings or investments at all) . Figures for all households with children are also provided for context.
Source: Scottish Household Survey. This question is asked biennially and was updated in 2025, the next update to the series is due in 2027.
How this indicator relates to the child poverty targets:
Low income + material deprivation √
Savings protect against problem debt and material deprivation. They act as a buffer against unexpected costs (e.g. replacing a broken washing machine) and fluctuations in income.
Contact
Email: TCPU@gov.scot