Tackling Child Poverty delivery plan: progress report 2025-2026 - annex A - child poverty measurement framework
Child poverty measurement framework with the latest data on the drivers of child poverty. The indicators in the child poverty measurement framework are intended to monitor these drivers of poverty.
Driver: Income from employment
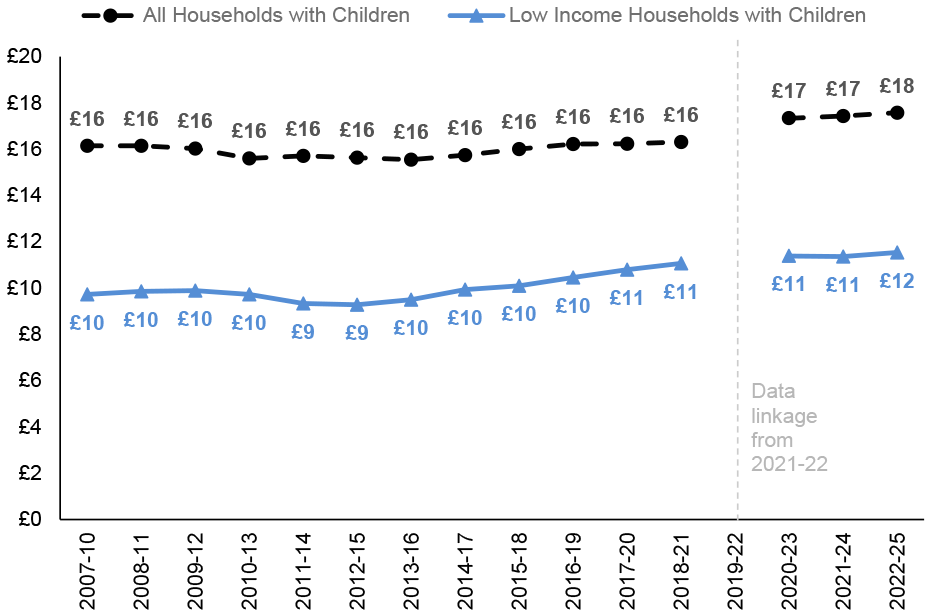
Indicator 1: Hourly pay
Average hourly earnings, in 2024/25 prices, of low income households (bottom three income deciles) with children where at least one adult is in employment. Figures for all households with children are also provided for context.
Source: Family Resources Survey. To note amounts have been rounded to the nearest pound but decimals still evident in the line of data shown. Due to data linkage carried out to benefits data the 2019-22 estimates have been suppressed.
How this indicator relates to the child poverty targets:
Relative poverty √
Absolute poverty √
Low income + material deprivation √
Persistent poverty √
Hourly pay is a direct driver of income from employment, and therefore influences all four targets. Because poverty is measured at the household level, the hourly pay indicator monitors the average hourly pay per household rather than per parent. Earnings for all years are presented in 2024/25 prices, in order to adjust for inflation when looking at trends over time.
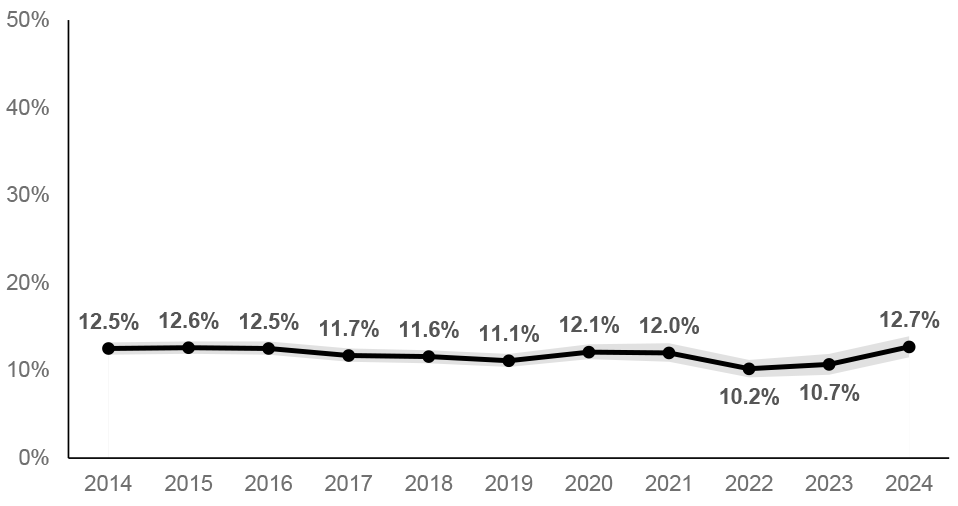
Indicator 2: No Paid employment
Percentage of children living in households where no adult is in paid employment in Scotland.
Source: Annual Population Survey. Shaded area show confidence intervals.
How this indicator relates to the child poverty targets:
Relative poverty √
Absolute poverty √
Low income + material deprivation √
Persistent poverty √
Households with no-one in paid employment are at significantly higher risk of being in poverty.
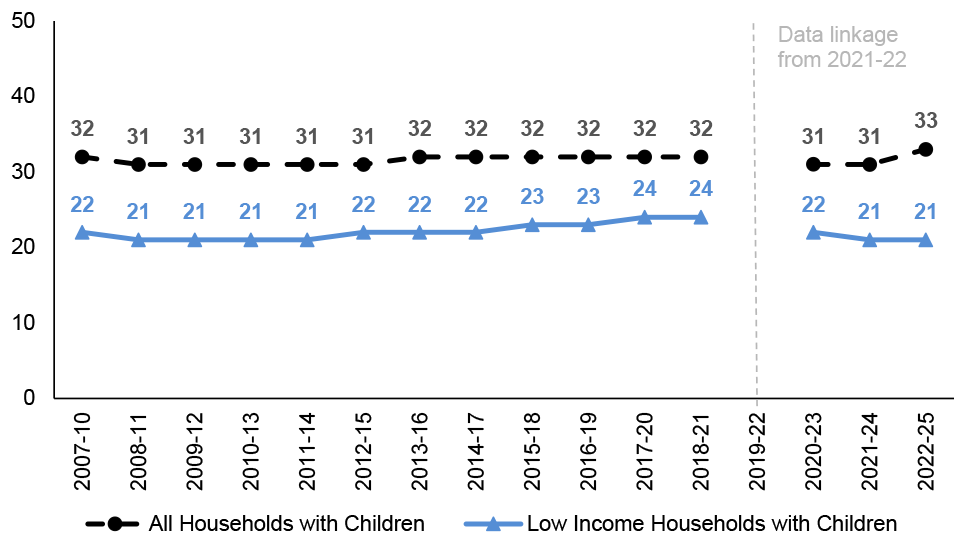
Indicator 3: Hours worked
Average (median) number of hours of paid employment per working-age adult, in low income households (bottom three income deciles) with children where at least one adult is in employment. Figures for all households with children are also provided for context.
Source: Family Resources Survey. Due to data linkage carried out to benefits data the 2019-22 estimates have been suppressed.
How this indicator relates to the child poverty targets:
Relative poverty √
Absolute poverty √
Low income + material deprivation √
Persistent poverty √
Hours worked is a direct driver of income from employment, and therefore influences all four targets. The risk of poverty reduces as the number of hours worked increases.
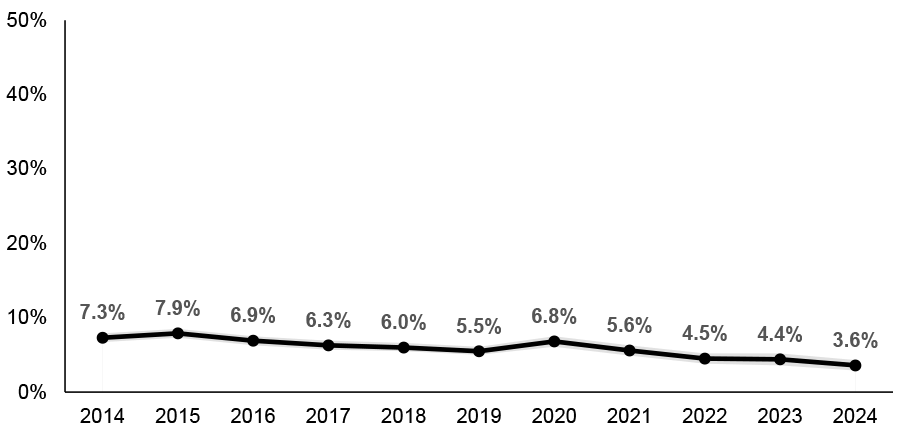
Indicator 4: Under-employment
Percentage of parents (16-64) who are in work but would prefer to work more hours in their current job (at the same rate of pay), in an additional job or in a new job with longer hours to replace their current job.
Source: Annual Population Survey. Shaded area show confidence intervals.
How this indicator relates to the child poverty targets:
Relative poverty √
Absolute poverty √
Low income + material deprivation √
Persistent poverty √
Various factors impact parents’ ability or desire to work extra hours, for example, people may not be able to take on additional work hours due to issues such as caring responsibilities or availability of childcare. In addition, the number and type of jobs in the job market as well as the needs of individual businesses have an impact on parents’ ability to increase their working hours. While respondents may state a preference to work more hours this may not always be possible.
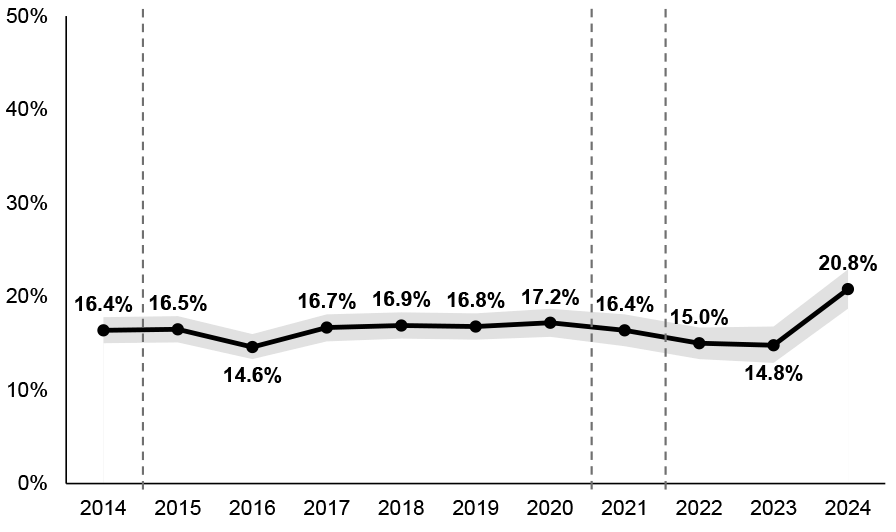
Indicator 5: Underutilisation of skills
Percentage of employed working age (16-64) parents with degrees who are in low or medium skilled occupations.
Source: Annual Population Survey. There are breaks in series between 2014 and 2015 and between 2021 and 2022 due to changes to the education questions. This was to reflect new qualifications within the list of possible responses. Estimates are still broadly comparable before and after breaks but additional caution is advised when interpreting differences. There is a break in the series between 2020 and 2021 due to changes in the Standard Occupation Classifications (SOC) used to code occupation.
How this indicator relates to the child poverty targets:
Relative poverty √
Absolute poverty √
Low income + material deprivation √
Persistent poverty √
While increasing people’s skills may improve their employment prospects, in turn allowing them to access higher skilled and better paid job opportunities, it is not a straightforward relationship. Those with degree level qualifications may have the skills to take up better-paid work but this relies on a match between the number and types of job available in the labour market and those with the skills to carry them out. In addition, even where those roles exist parents may choose a low or medium skilled alternative if higher paid roles do not allow them to carry out their caring responsibilities.
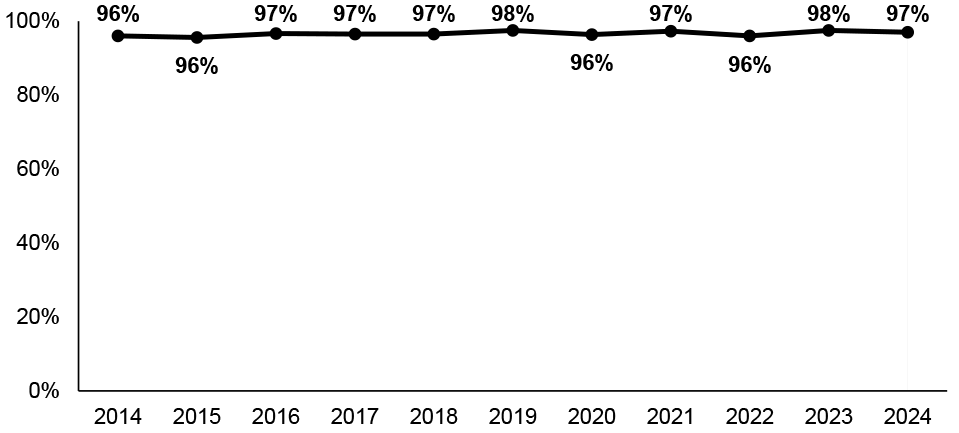
Indicator 6: Secure work
Percentage of parents (16+) in employment who have a permanent work contract.
Source: Annual Population Survey. Confidence intervals at +/-0.5%, hence shaded area is not visible.
How this indicator relates to the child poverty targets:
Relative poverty √
Absolute poverty √
Low income + material deprivation √
Persistent poverty √
Being in insecure work can lead to fluctuating household incomes which can make managing finances difficult. It can also make it harder to get a loan or mortgage which can lead to higher spending. Insecure contracts are also generally associated with lower paid work.
Estimates of the proportion of employees in contractually secure work do not currently differentiate between the types of agreed working arrangement. Zero-hours contracts, which may reflect insecure work patterns depending on individual experiences of hours worked, are therefore included in overall number of employees deemed to be ‘contractually secure’.
Employees are those who have reported that they are in employment and are paid a wage by an employer for the work that they do. To be classed as being in employment, a person must have done at least one hour of paid work in the week prior to their interview or have a job that they are temporarily away from (e.g. by being on holiday or off sick).
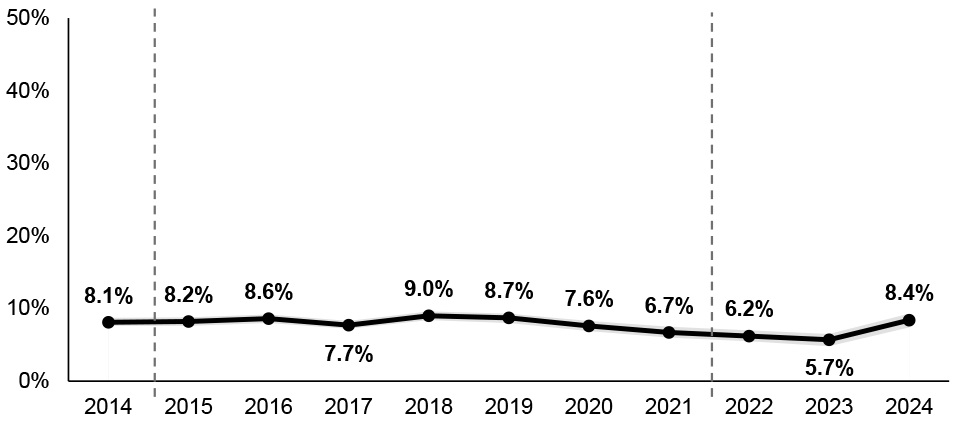
Indicator 7: Parents’ Qualifications
Percentage of parents (16-64) with no or low qualifications. Low, or no, qualifications is equivalent to Scottish Credit & Qualifications Framework level 4 or lower.
There are breaks in series between 2014 and 2015 and between 2021 and 2022 due to changes to the survey question. This was to reflect new qualifications within the list of possible responses. Estimates are still broadly comparable before and after breaks but additional caution is advised when interpreting differences.
Source: Annual Population Survey. Shaded area shows confidence interval.
How this indicator relates to the child poverty targets:
Relative poverty √
Absolute poverty √
Low income + material deprivation √
Persistent poverty √
People with higher qualifications are much less likely to experience poverty than those with no or lower qualifications. Skills and qualifications affect income from employment in two main ways: the likelihood of getting a job, and how much someone is paid.
Contact
Email: TCPU@gov.scot