State of the economy: October 2022
This report summarises recent developments in the global and Scottish economy and provides an analysis of the performance of, and outlook for, the Scottish economy.
Comparison of current economic conditions to previous recessions
The full extent of the high inflation and recessionary economic outlook is yet to emerge, in terms of scale, duration and long term impacts. The context and nature of the current economic environment is different to previous economic shocks/downturns, however comparisons to periods of higher inflation and economic downturns can be made to draw key similarities and differences and provide an element of scale.
The graph below shows previous UK recessions denoted by the grey bars and that rising inflation and falling output is a similar pattern to the recessions of the mid 1970s, early 1980s, particularly the link to energy price volatility, and early 1990s.
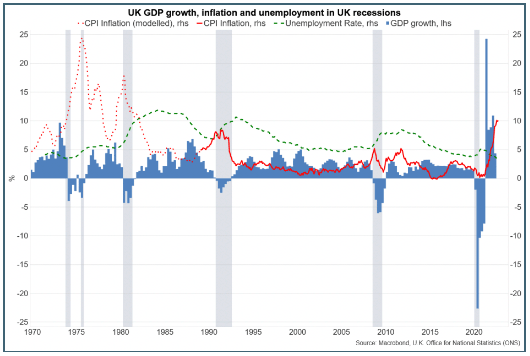
There are important differences between the current economic situation and previous recessions:
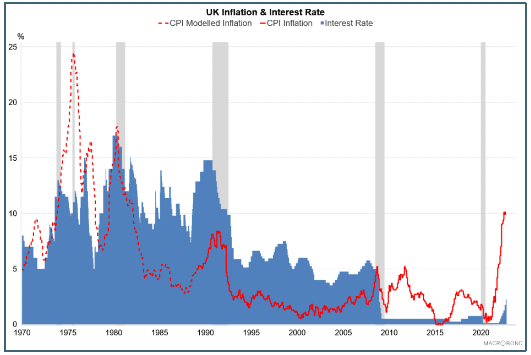
- Inflation: The Bank of England currently expect inflation to rise to 11%; higher than its peak in the early 90s (c.8%), but is notably below the peak inflation rates of the mid-70s (c. 25%) and early 80s (c.18%).
- Unemployment: currently at a near record low rate of 3.3% in Scotland (UK: 3.5%) and is forecast to rise at a UK level to slightly above 6% in 2025, but remain below the +10% rates of the 1980s and early 1990s recessions.
- Interest rates: markets expect interest rates to rise and peak at around 4.75%[15] in 2023, but this remains notably lower than during the recessions of the mid 1970s (c.12%); 1980s, (peak 17%) and 1990s (peak 14.8%).
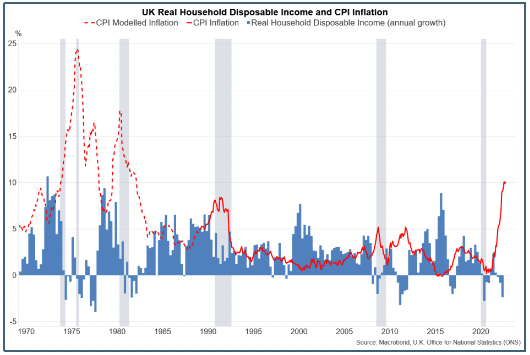
However the chart below shows that periods of higher inflation and falling output have tended to result in periods of falling real disposable household income thereby affecting household wellbeing. This was evident in the 1970s and early 1980s. The rise in inflation in the early 1990s recession saw household disposable income growth slow but remain positive. Real household disposable income fell following the financial crisis, with a further fall emerging following the pandemic. In August, the Bank of England projected real post-tax income to fall by 1.5% in 2022 and a further 2.25% in 2023, however this was before the announcements of the UK Government fiscal support package.
Contact
Email: OCEABusiness@gov.scot