State of the economy: October 2022
This report summarises recent developments in the global and Scottish economy and provides an analysis of the performance of, and outlook for, the Scottish economy.
Impacts on Businesses
Rising inflationary pressures are causing a cost crisis for businesses as well as households. Business costs have risen significantly over the past year due to rising prices for energy and materials alongside rising labour costs. This has presented significant challenges for businesses and their operating models as they continue to recover from the pandemic and ensure the resilience of cash flow in the face of challenging demand conditions. Even with the energy price support in place, energy prices are significantly higher than last year and it is not clear what the long term response to prices will be nor what will happen when Government support ends. This section considers some of the implications for businesses.
Producer input price inflation rose to a record high annual rate in June (24.1%) before easing back slightly over the third quarter to 20% in September.[18]
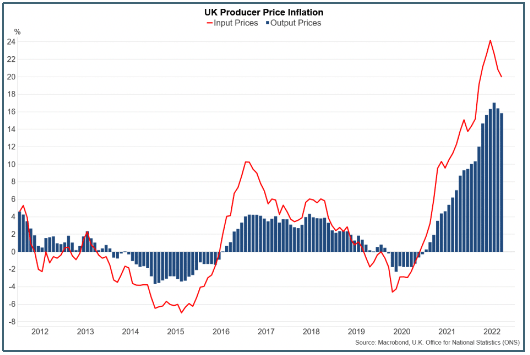
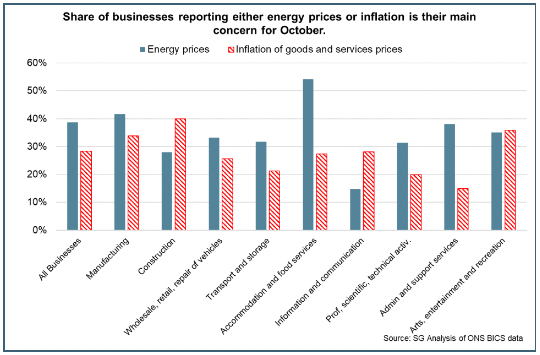
The rise in input prices has been broad based across product groups. Crude oil (54.2%) and fuel (48.6%) have had the largest increases reflecting the rise in energy prices driving cost pressures, however metals and non-metallic minerals provided the largest upward contribution to the annual rate of input price inflation in September. Business surveys indicate that the pace of input cost increases have eased slightly in recent months, however remain significantly elevated, and a key concern for businesses. The Business Insights and Conditions survey reported that the main concerns for businesses for October 2022 were energy prices (38.7%) and inflation of goods and services (28.4%).[19]
In addition to the direct costs of higher energy prices to businesses, they also face the risk of secondary impacts from those on households which may take the form of reduced demand, particularly in consumer facing sectors that depend on 'discretionary' spend, or in the form of higher wage claims.
Businesses have been responding to the increased energy costs by adjusting their output prices, absorbing costs through reduced profits, and seeking to make efficiency savings where possible. However, the extent to which sectors and businesses are more or less exposed to the rising costs of doing business depends in part on their energy intensity (see Box C).
Box C – Energy Intensive Sectors
There are different measures of energy intensity. ONS published detailed analysis of energy spending using a definition of energy intensity based on energy purchases as a share of total purchases.[20] Alternative definitions are consumption based. Both are presented below.
The table below shows energy intensity based on energy purchases as a share of total purchases by sector for businesses in Scotland. Transport and storage is the most energy intensive sector with 17.5% of all purchases spent on energy. Accommodation and food sector is also one of the most energy intensive with 7.2% of all purchases spent on energy. Other services, which includes personal service activities (e.g. hairdressing), also has a relative high energy intensity with 10.1% of all purchases spent on energy.
| Energy Intensity based on purchases by sector (Scotland) | No. of Units | Total Employment | Total Purchases of Goods and Services | Purchases of goods bought for resale | Purchases of energy supplied for own consumption | Energy Intensity |
|---|---|---|---|---|---|---|
| (000's) | (£ million) | (£ millions) | (£ millions) | |||
| Scotland | 192,826 | 1,858 | 142,222 | 52,505 | 4,788 | 5.3% |
| Primary Industries | 6,161 | 77 | 19,072 | 5,990 | 923 | 7.1% |
| Manufacturing | 10,226 | 169 | 22,428 | 1,925 | 829 | 4.0% |
| Construction | 21,818 | 132 | 12,169 | 407 | 256 | 2.2% |
| Wholesale, retail and repairs | 35,197 | 345 | 49,154 | 39,796 | 570 | 6.1% |
| Transport and storage | 7,558 | 106 | 7,544 | 1,080 | 1,133 | 17.5% |
| Accommodation and food service activities | 17,595 | 210 | 3,412 | 459 | 213 | 7.2% |
| Information and communication | 11,482 | 77 | 4,240 | 770 | 74 | 2.1% |
| Real estate activities | 6,761 | 38 | 1,055 | 24 | 43 | 4.2% |
| Professional, Scientific and Technical Activities | 33,602 | 184 | 10,364 | 1,266 | 229 | 2.5% |
| Administrative and support service activities | 16,945 | 187 | 5,746 | 465 | 148 | 2.8% |
| Education, human health and social work activities | 9,958 | 227 | 2,512 | 67 | 160 | 6.6% |
| Arts, entertainment and recreation | 6,292 | 66 | 3,248 | 92 | 96 | 3.0% |
| Other service activities | 9,231 | 41 | 1,279 | 165 | 113 | 10.1% |
Note: Scotland Total excludes financial sector, parts of agriculture and the public sector.
Note: Energy Intensity = energy purchases / (all purchases - purchases bought for resale).
These findings are in line with the ONS analysis for the UK which found:
- The most energy intensive industry section was electricity, gas, steam and air conditioning supply, with 24% of the industry's total purchases of energy, materials, goods and services spent on energy.
- Transportation and storage was the second most energy intensive, with 21% of total purchases spent on energy.
- At the more detailed industry group level, the three most energy intensive groups in 2019 were sea and coastal freight water transport (38%), passenger air transport (36%) and freight transport by road and removal services (31%).
- The majority of businesses in residential care activities spent more than 10% of their total purchases on energy in 2019.
The ONS study also found that the smallest "micro" businesses with 0 to 9 employees were much more likely than larger businesses to have a very high energy intensity of more than 20% of total purchases being spent on energy in 2019.
The majority of businesses in electricity, gas, steam and air conditioning supply had low energy intensity, despite this being a very energy intensive industry on aggregate. This implies that a few large purchasers of energy are driving the aggregate result in this industry.
The next table below shows energy intensity based on consumption with energy use of more than 1 GWh/£ million GVA. Energy Intensive Industries tend to be sectors such as steel, chemicals, engineering and brick making industries where energy usage makes up a significant part of production costs. These sectors consume a higher proportion of energy and so are more exposed to energy price increases. It shows manufacturing and transport to be highly energy intensive in terms of consumption.
| 1 | Mining and quarrying, excluding support activities | 42.7 |
|---|---|---|
| 2 | Manufacture of coke, refined petroleum and chemicals | 22.2 |
| 3 | Manufacture of other non-metallic mineral products | 10.2 |
| 4 | Fishing and aquaculture | 6.6 |
| 5 | Electricity, gas, steam and air conditioning supply | 6.2 |
| 6 | Water transport | 5.4 |
| 7 | Manufacture of paper products | 4.7 |
| 8 | Land transport | 3.4 |
| 9 | Agriculture and hunting | 3.0 |
| 10 | Manufacture of wood products, except furniture | 1.9 |
| 11 | Air transport | 1.8 |
| 12 | Manufacture of textiles | 1.7 |
| 13 | Waste Management and Remediation Activities | 1.6 |
| 14 | Manufacture of rubber and plastic products | 1.5 |
| 15 | Manufacture of food products | 1.2 |
| 16 | Manufacture of beverages and tobacco products | 1.1 |
Note: Energy use of more than 1GWh/£ million, 2018 data
Source: Air and energy accounts for Scotland (climatexchange.org.uk)
Broader inflationary pressures, rising interest rates and a weak exchange rate increasing import costs risks are still set to place considerable new cost pressures on businesses, at a time when they are continuing to recover from the pandemic.
Contact
Email: OCEABusiness@gov.scot