Scottish Social Attitudes Survey 2025: Core module
This report presents findings from the Scottish Social Attitudes Survey core module 2025. In 2025 the core module asked questions covering attitudes to: trust in government, the health service, the standard of living, democratic engagement, and tax, spending, and redistribution of income.
Trust and Democratic engagement
Social trust
Respondents were asked to what extent they trust people in general – whether ‘most people can be trusted’, or they ‘can’t be too careful in dealing with people’.
Around half of respondents (53%) said ‘most people can be trusted’; again around half (45%) said they ‘can’t be too careful in dealing with people’.
|
Table |
(%) |
|---|---|
|
Most people can be trusted |
53 |
|
Can't be too careful in dealing with people |
45 |
|
Unweighted base |
1,549 |
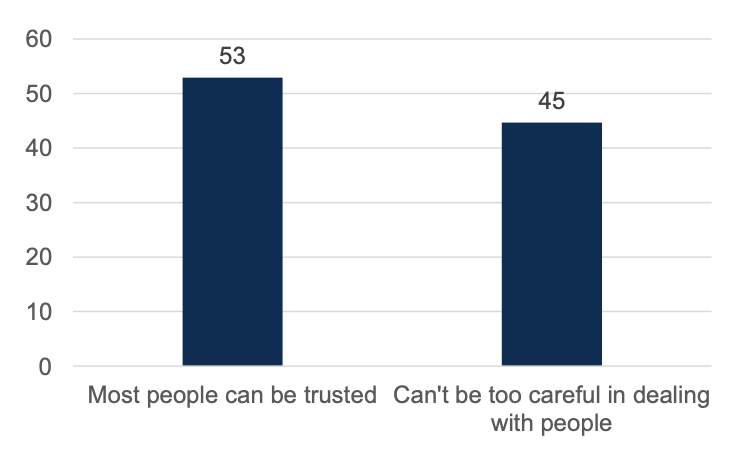
Percentage of people who agreed either “most people can be trusted”, or “can't be too careful in dealing with people”, 2025
Subgroups: Social trust
Data tables for all subgroups, by demographic, economic and political factors are available in the supplementary tables alongside this report.
In the 2025 survey, when asked to what extent respondents felt they trust people in general, respondents with no educational qualifications were less likely to say that ‘most people can be trusted’ (40% compared to 53% average). This was also the case for respondents who reported they were ‘struggling on present income’ (37%) or ‘really struggling on present income’ (42%).
Political engagement
Respondents were asked to identify from a list of 16 activities (see table below), which they had done to express their thoughts on an issue.
Half of respondents (48%) said they had ‘Signed a petition (including online petitions)’ (the most frequently chosen activity). A third of respondents said they had not done any of the activities on the list.
|
Table |
(%) |
|---|---|
|
Signed a petition (including online petitions) |
48 |
|
Contacted my local council |
26 |
|
Contacted an MP or MSP |
25 |
|
Responded to a consultation document |
16 |
|
Given money to a campaign or organisation |
13 |
|
Attended a public meeting |
10 |
|
Gone on a protest or demonstration |
10 |
|
Spoken to an influential person |
8 |
|
Raised the issue in an organisation I already belong to |
7 |
|
Contacted a government department directly |
6 |
|
Attended an event organised as part of a consultation exercise |
5 |
|
Joined a political party |
4 |
|
Joined an existing organisation |
3 |
|
Actively took part in a campaign (e.g. leafleting, stuffing envelopes etc.) |
3 |
|
Contacted radio, TV or a newspaper |
2 |
|
Formed a group of like-minded people |
2 |
|
No, have not done any of these |
32 |
|
Unweighted base (n) |
1,549 |
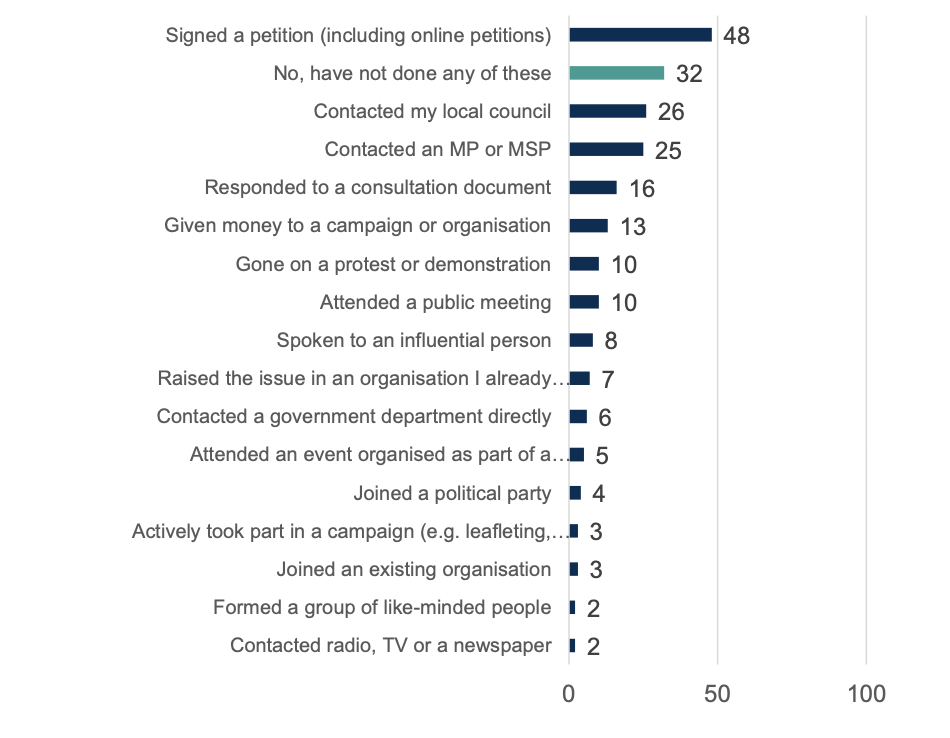
Percentage of people who have done X as a way of registering what they personally thought about an issue, 2025
The political system in Scotland
Respondents were asked to identify to what extent the political system allows people like them to have a say in what the government does, on a scale from 0 (‘not at all’) to 10 (‘completely’).
Responses at the lower end of the scale (0 to 4) were more frequently chosen at 46%, compared with 28% medium (5) and 25% high (6 to 10). The most frequently chosen response was 5 (medium) at 18%, followed by 0 (not at all) at 14%.
|
Table |
(%) |
|---|---|
|
0 - Not at all |
14 |
|
1 |
4 |
|
2 |
8 |
|
3 |
11 |
|
4 |
9 |
|
5 |
18 |
|
6 |
8 |
|
7 |
9 |
|
8 |
5 |
|
9 |
1 |
|
10 - Completely |
2 |
|
Net: 0 - 4 (Low) |
46 |
|
Net: 5 (Medium) |
18 |
|
Net: 6 - 10 (High) |
25 |
|
Unweighted base (n) |
1549 |
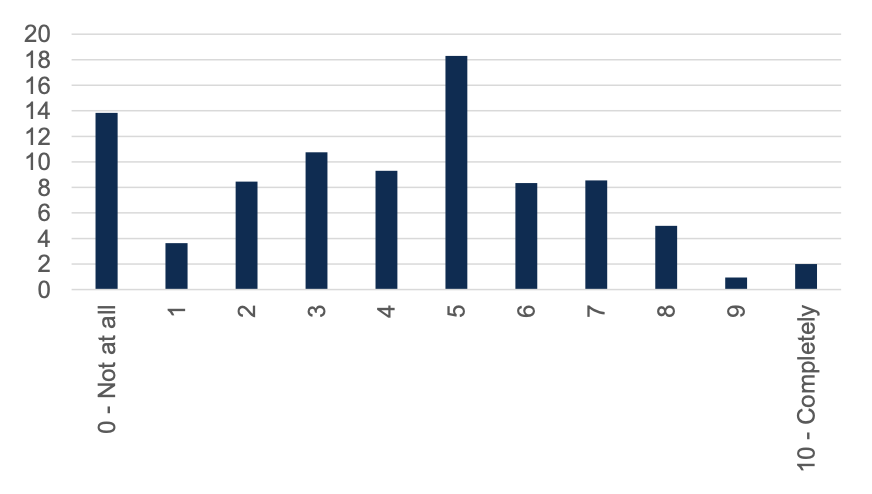
Percentage of people who think the political system in Scotland does or does not allow people like them to have a say in what the government does, 2025
Drivers of trust in the Scottish government
Respondents were asked to identify which three of six ‘drivers’ of trust have the greatest impact on how much they trust the Scottish government. They were limited to three responses.
In 2025, five of the six drivers were identified by 40% to 50% of respondents, with one being less frequently chosen. ‘The government engages with citizens on the most important issues, for example, through citizens assemblies, referendum and public consultations’ was the most frequently chosen, by 53% of respondents. The least frequently chosen driver was ‘Government policies match my preferences’, at 19%.
|
Table |
(%) |
|---|---|
|
The government engages with citizens on the most important issues, for example, through citizens assemblies, referendum and public consultations |
53 |
|
Government policies balance the interest of current and future generations |
48 |
|
Government officials abide by the same rules as everybody else |
43 |
|
The government competently carries out its tasks |
42 |
|
The government delivers on electoral promises |
40 |
|
Government policies match my preferences |
19 |
|
Unweighted base (n) |
1,274 |
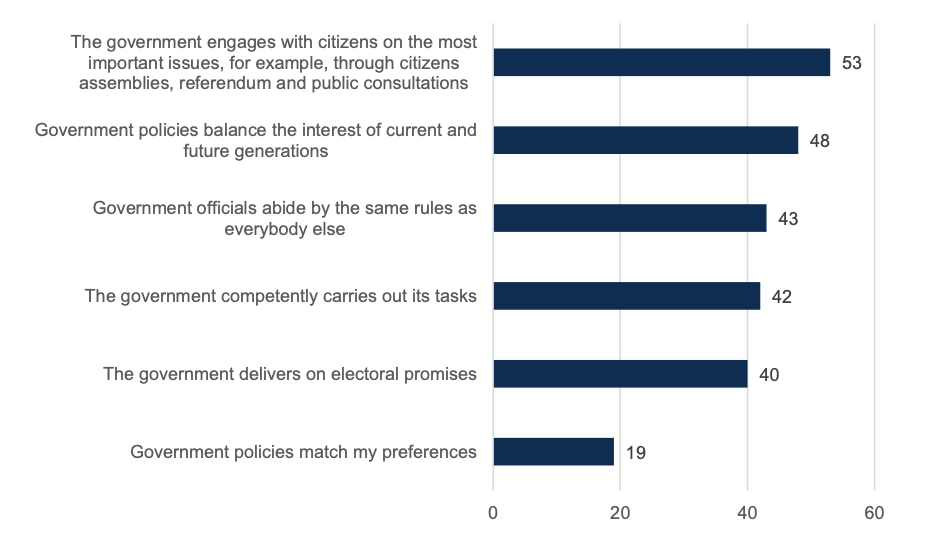
Percentage of people who include this in the top three reasons with the greatest impact on how much trust they have in the Scottish Government, 2025
Contact
Email: socialresearch@gov.scot