Scottish Social Attitudes Survey 2025: Core module
This report presents findings from the Scottish Social Attitudes Survey core module 2025. In 2025 the core module asked questions covering attitudes to: trust in government, the health service, the standard of living, democratic engagement, and tax, spending, and redistribution of income.
Views on government priorities, the health service, the general standard of living, and the economy
Priorities for the Scottish Government
Respondents were asked to pick from a list of eight options what they thought Scottish Government’s highest priority should be:
Improve the economy
Cut crime
Improve people’s health
Improve standards of education
Improve housing
Reduce environmental problems
or (from 2015) Reduce inequality
In 2025, ‘Improve the economy’ was the most frequently chosen option, chosen by a third (33%) of respondents, with ‘Improve people’s health’ the next most frequent at 19%. ‘Reduce environmental problems’ and ‘Improve public transport’ were the least frequently chosen at 2%.
|
Table |
(%) |
|---|---|
|
Improve the economy |
33 |
|
Improve people’s health |
19 |
|
Improve housing |
15 |
|
Improve standards of education |
10 |
|
Cut crime |
7 |
|
Reduce inequality |
6 |
|
Reduce environmental problems |
2 |
|
Improve public transport |
2 |
|
Unweighted base (n) |
1,549 |
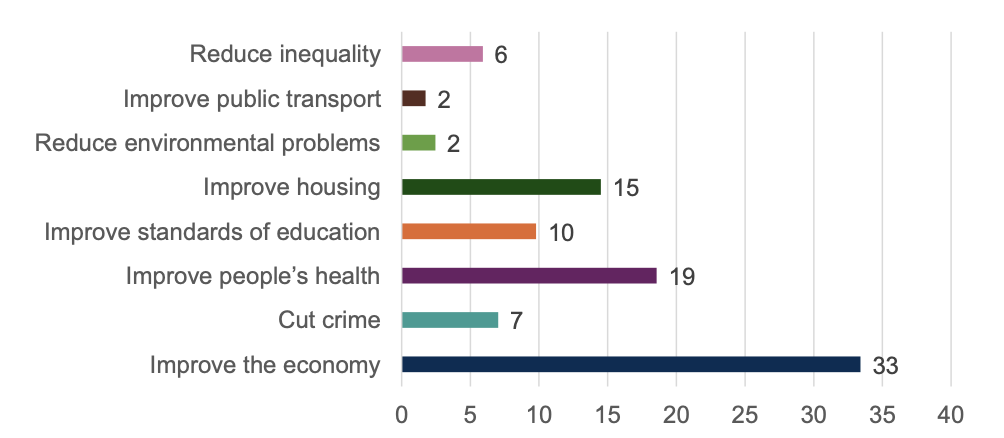
Percentage of people who said this should be Scottish Government’s highest priority, 2025
Compared to the most recent year in which the question was run, six of the eight response options saw a statistically significant increase or decrease to the percentage selecting them between 2023 and 2025. ‘Improve the economy’, ‘Reduce environmental problems’ and ‘Reduce inequality’ saw decreases, while ‘Improve housing’, ‘Improve people’s health’ and ‘Cut crime’ saw increases.
This question has been asked since 2004. In most years, ‘Improve the economy’ was the most frequently chosen option (particularly since 2009).
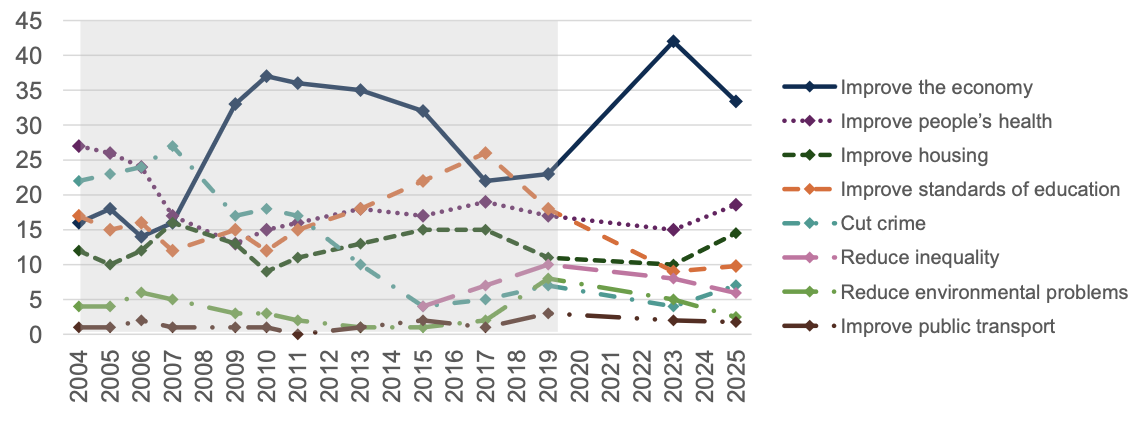
Percentage of people who said this should be Scottish Government’s highest priority, 2004 to 2025. N.B. Shading indicates a change in methodology from face to-face to push-to-web between 2019 and 2023.
Satisfaction with the National Health Service
Respondents were asked to rate their satisfaction with the way in which the National Health Service is run nowadays – ‘very satisfied’, ‘quite satisfied’, ‘neither satisfied nor dissatisfied’, ‘quite dissatisfied’, or ‘very dissatisfied’.
In 2025, just under a quarter (23%) of respondents said they were satisfied (very or quite satisfied) with the way the NHS is run. Half were dissatisfied (quite or very dissatisfied), and a quarter (26%) neither satisfied nor dissatisfied.
|
(%) |
|
|---|---|
|
Very satisfied |
3 |
|
Quite satisfied |
21 |
|
Neither satisfied nor dissatisfied |
26 |
|
Quite dissatisfied |
32 |
|
Very dissatisfied |
17 |
|
Very satisfied/ quite satisfied |
23 |
|
Quite satisfied/ very dissatisfied |
50 |
|
Unweighted base (n) |
1,549 |
The percentage of people who were satisfied with the way the NHS is run in 2025 was 23%, in line with the percentage for 2024 (22%); no statistically significant difference. The percentage who were dissatisfied saw a statistically significant decrease (50% compared with 55%); the percentage whose attitude was neutral (26% compared with 24%) stayed the same.
This question has been asked since 1999, most recently in 2024. Prior to 2023, respondents were more likely to be satisfied than dissatisfied (with the exception of 2005); from 2023 onwards they were more likely to be dissatisfied than satisfied.
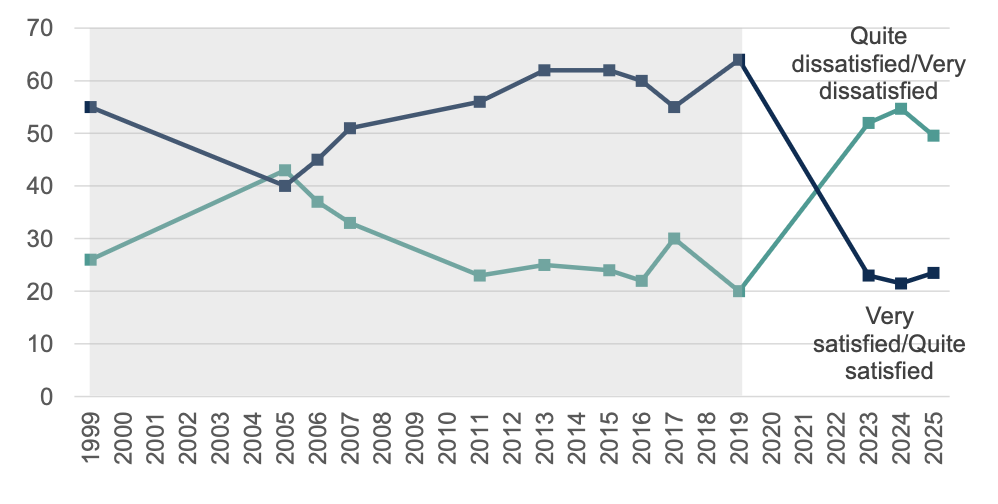
Percentage of people who were (very/quite) satisfied or (very/quite) dissatisfied with the way in which the National Health Service is run, 1999 to 2025. N.B. Shading indicates a change in methodology from face to-face to push-to-web between 2019 and 2023. Findings for 2024 published in Scottish Social Attitudes | 25 years of devolution in Scotland: Public attitudes and reactions (National Centre for Social Research, 2025)
Perceived standard of the health service
Respondents were asked whether they thought the standard of the health service in Scotland had changed over the previous year – ‘increased a lot’, ‘increased a little’, ‘stayed the same’, ‘fallen a little’, or ‘fallen a lot’.
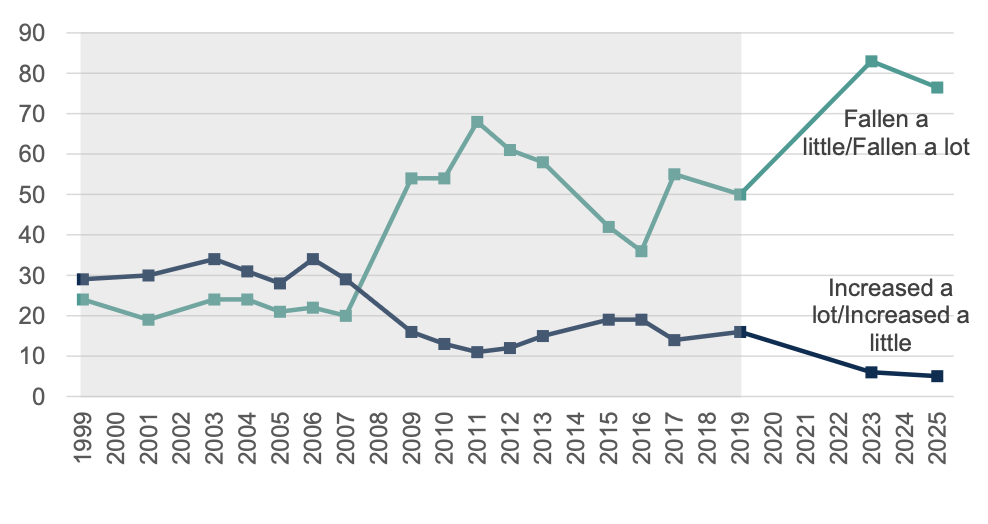
In 2025, six in ten (60%) of respondents thought that the standard of the health service had fallen (fallen a little or fallen a lot) over the last twelve months. Under one in ten (7%) thought the standard had increased, and just under a third (30%) thought it had stayed the same.
The percentage of people who thought the standard of the health service had increased over the previous year was 7% in 2025, in line with the percentage for 2023 (6%); not a statistically significant difference. The percentage who thought the standard had fallen over the previous year decreased, from 69% in 2023 to 60% in 2025, a statistically significant decrease. The percentage whose attitude was neutral in 2025 (30%) saw a statistically significant increase from 2023 (25%).
|
Table |
(%) |
|---|---|
|
Increased a lot |
1 |
|
Increased a little |
6 |
|
Stayed the same |
30 |
|
Fallen a little |
32 |
|
Fallen a lot |
27 |
|
Increased a lot/Increased a little |
7 |
|
Fallen a little/Fallen a lot |
60 |
|
Unweighted base (n) |
1,549 |
Respondents were asked whether they thought this was mainly the result of the UK Government’s policies, the Scottish Government’s policies, or for some other reason. If no response was provided, the additional response option ‘Both Westminster and Scottish Government equally’ was offered.
|
(%) |
|
|---|---|
|
Mainly the result of the UK government's policies at Westminster |
38 |
|
Mainly the result of the Scottish Government's policies |
37 |
|
For some other reason |
22 |
|
Both Westminster and Scottish Government equally* |
0 |
*’Both Westminster and Scottish Government equally’ only shown if question skipped; see 2023 technical report for more information on how this compares with face-to-face methodology
Respondents who thought the standard of the health service in Scotland had increased were more likely to attribute this to the Scottish Government’s policies (66%) than those of the UK Government (12%). Those who thought the standard had decreased, were more likely to attribute this to UK Government policies (46%) than Scottish Government policies (32%).
|
(%) |
(%) |
(%) |
|
|---|---|---|---|
|
Table |
Increased |
Stayed the same |
Fallen |
|
Mainly the result of the UK government's policies at Westminster |
12 |
30 |
46 |
|
Mainly the result of the Scottish Government's policies |
66 |
39 |
32 |
|
For some other reason |
22 |
25 |
20 |
|
Both Westminster and Scottish Government equally* |
0 |
0 |
1 |
*’Both Westminster and Scottish Government equally’ only shown if question skipped; see 2023 technical report for more information on how this compares with face-to-face methodology
This question has been asked since 1999, most recently in 2023. Broadly, respondents have been more likely to think the standard of the health service had fallen over the previous year than had increased.
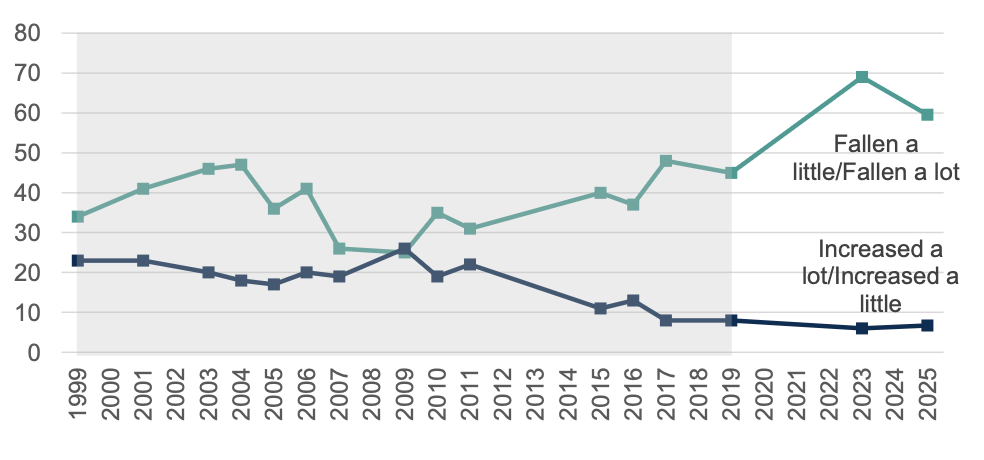
Percentage of people who thought the standard of the health service in Scotland had increased or fallen since previous year, 1999 to 2025. N.B. Shading indicates a change in methodology from face-to-face to push-to-web between 2019 and 2023.
Perceived general standard of living
Respondents were asked whether they thought the general standard of living in Scotland had changed over the previous year – ‘increased a lot’, ‘increased a little’, ‘stayed the same’, ‘fallen a little’ or ‘fallen a lot’.
Just under eight in ten people (77%) thought that the general standard of living in Scotland had fallen either a little or a lot over the previous year. Fewer than one in ten (5%) thought the standard of living had increased a little or a lot, and 16% thought it had stayed the same.
|
Table |
(%) |
|---|---|
|
Increased a lot |
2 |
|
Increased a little |
3 |
|
Stayed the same |
16 |
|
Fallen a little |
42 |
|
Fallen a lot |
35 |
|
Increased a lot/Increased a little |
5 |
|
Fallen a little/Fallen a lot |
77 |
|
Unweighted base (n) |
1,549 |
Compared to the most recent year the question was run, the percentage of people who thought the standard of living had increased over the previous year in 2025 was 5%, in line with 6% in 2023. The percentage who thought it had decreased was 77%, a statistically significant decrease from the 83% in 2023. And the percentage whose attitude was neutral saw a statistically significant increase to 16% in 2025, from 10% in 2023.
Respondents were asked whether they thought this was mainly the result of the UK Government’s policies, the Scottish Government’s policies, or for some other reason. If no response was provided, the additional response option ‘Both Westminster and Scottish Government equally’ was offered.
|
Table |
(%) |
|---|---|
|
Mainly the result of the UK government's policies at Westminster |
53 |
|
Mainly the result of the Scottish Government's policies |
27 |
|
For some other reason |
18 |
|
Both Westminster and Scottish Government equally* |
1 |
*’Both Westminster and Scottish Government equally’ only shown if question skipped; see 2023 technical report for more information on how this compares with face-to-face methodology
Respondents who thought the standard of living had fallen over the previous twelve months were more likely to think that this was the result of the UK Government’s policies (57%) than those of the Scottish Government (24%).
|
(%) |
(%) |
(%) |
|
|---|---|---|---|
|
Table |
Increased |
Stayed the same |
Fallen |
|
Mainly the result of the UK government's policies at Westminster |
46 |
33 |
57 |
|
Mainly the result of the Scottish Government's policies |
40 |
34 |
24 |
|
For some other reason |
14 |
31 |
15 |
|
Both Westminster and Scottish Government equally* |
0 |
1 |
1 |
*’Both Westminster and Scottish Government equally’ only shown if question skipped; see 2023 technical report for more information on how this compares with face-to-face methodology
This question was first asked in 1999. Since the late 2000s, people have been more likely to think the standard of living has fallen than increased.
Percentage of people who thought the general standard of living in Scotland had increased or fallen since previous year, 1999 to 2025. N.B. Shading indicates a change in methodology from face-to-face to push-to-web between 2019 and 2023.
The economy
Respondents were asked whether they thought the economy had got stronger (a lot or a little) or weaker (a lot or a little) over the previous year.
More than half of respondents (61%) thought the economy had got weaker since the previous year; less than one in 10 (7%) thought it had got stronger, and a quarter (26%) thought it had stayed the same.
|
Table |
(%) |
|---|---|
|
A lot stronger |
0 |
|
A little stronger |
6 |
|
Stayed the same |
26 |
|
A little weaker |
40 |
|
A lot weaker |
21 |
|
A lot stronger/ a little stronger |
7 |
|
A little weaker/ a lot weaker |
61 |
|
Unweighted base (n) |
1549 |
Respondents were asked whether they thought this was mainly the result of the UK Government’s policies, the Scottish Government’s policies, or for some other reason. If no response was provided, the additional response option ‘Both Westminster and Scottish Government equally’ was offered.
|
Table |
(%) |
|---|---|
|
Mainly the result of the UK government's policies at Westminster |
41 |
|
Mainly the result of the Scottish Government's policies |
39 |
|
For some other reason |
18 |
|
Both Westminster and Scottish Government equally* |
1 |
*’Both Westminster and Scottish Government equally’ only shown if question skipped; see 2023 technical report for more information on how this compares with face-to-face methodology
Respondents who thought the economy had got stronger were more likely to think this was the result of the Scottish Government’s policies (73%) than the UK Government’s policies (14%).
|
(%) |
(%) |
(%) |
|
|---|---|---|---|
|
Table |
Stronger |
Stayed the same |
Weaker |
|
Mainly the result of the UK government's policies at Westminster |
14 |
33 |
47 |
|
Mainly the result of the Scottish Government's policies |
73 |
37 |
37 |
|
For some other reason |
11 |
28 |
15 |
|
Both Westminster and Scottish Government equally* |
1 |
0 |
1 |
*’Both Westminster and Scottish Government equally’ only shown if question skipped; see 2023 technical report for more information on how this compares with face-to-face methodology
This question was first asked in 2004, and most recently asked in 2019. Since 2007, respondents have been more likely to think the economy has got weaker, than got stronger.
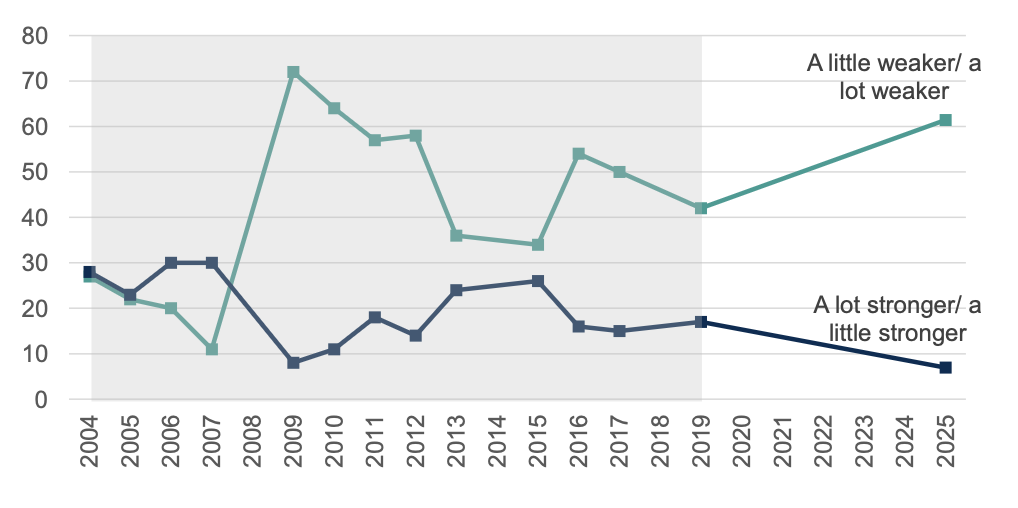
Percentage of people who thought economy in Scotland had strengthened or weakened since previous year, 1999 to 2025. N.B. Shading indicates a change in methodology from face-to-face to push-to-web between 2019 and 2023.
Subgroups: Views on government priorities, the health service, the general standard of living, and the economy
Data tables for all subgroups, by demographic, economic and political factors are available in the supplementary tables alongside this report.
In the 2025 survey, those on the right of the left-right scale were more likely to think that improving the economy should be the Scottish Government’s ‘highest priority’ (43% compared to the average among all respondents of 33%).
On the general standard of living, respondents who self-reported that they were ‘really struggling on present income’ (86%) and ‘struggling on present income’ (82%) were more likely to say that the general standard of living in Scotland had fallen over the last 12 months compared to the average for all respondents (77%).
When asked whether the economy had gotten stronger or weaker over the last twelve months, respondents from Black, Asian, mixed or other ethnic origin were more likely to think that that the economy had gotten ‘a lot stronger’ or ‘a little stronger’ (22%) than the average for all respondents (6%).
Contact
Email: socialresearch@gov.scot