Scottish Social Attitudes Survey 2025: Core module
This report presents findings from the Scottish Social Attitudes Survey core module 2025. In 2025 the core module asked questions covering attitudes to: trust in government, the health service, the standard of living, democratic engagement, and tax, spending, and redistribution of income.
Attitudes towards government and Parliament
Trust in Scottish and UK governments to work in Scotland’s interest
Respondents were asked to what extent they trust the Scottish and UK Governments to act in Scotland’s ‘best interests’ (for the Scottish Government), or Scotland’s ‘best long-term interest’ (for the UK Government) ‘just about always’, ‘most of the time’, ‘only some of the time’ or ‘almost never’.
|
Table |
Scottish Government (%) |
UK Government (%) |
|---|---|---|
|
Just about always |
9 |
2 |
|
Most of the time |
37 |
15 |
|
Only some of the time |
36 |
39 |
|
Almost never |
16 |
41 |
|
Just about always/Most of the time |
46 |
18 |
|
Only some of the time/ Almost never |
53 |
80 |
|
Unweighted base (n) |
1,549 |
1,549 |
In 2025, 46% of respondents said that they trusted the Scottish Government to work in Scotland’s best interests ‘just about always’ or ‘most of the time’. 53% of respondents said they trusted the Scottish Government to work in Scotland’s best interests ‘only some of the time’ or ‘almost never’.
18% of respondents said that they trusted the UK Government to work in Scotland’s best long-term interests ‘just about always’ or ‘most of the time’. 80% said they ‘only some of the time’ or ‘almost never’ trusted them to do so.
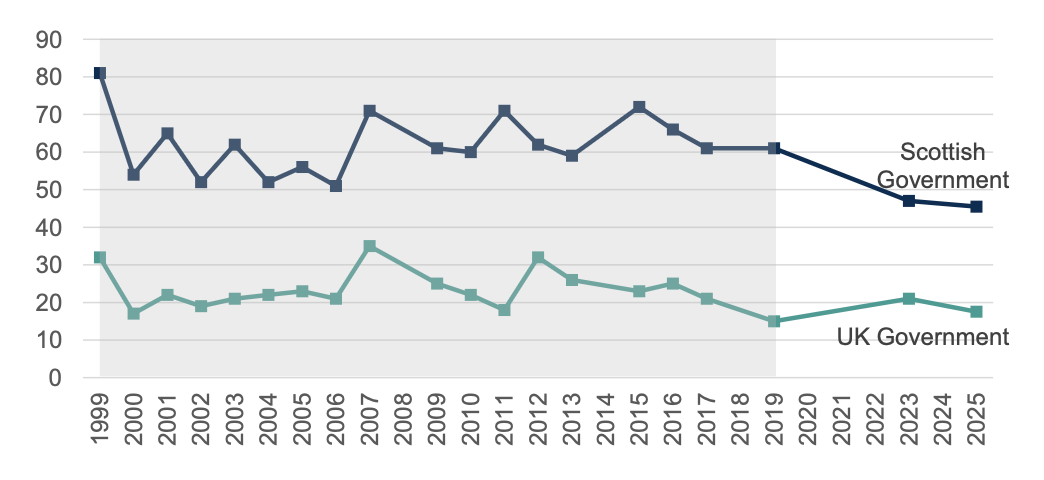
Percentage of people who said they trust the Scottish Government to work in Scotland's best interests/ the UK Government to work in Scotland's best long-term interest (just about always or most of the time), 1999 to 2025. N.B. Shading indicates a change in methodology from face to-face to push-to-web between 2019 and 2023
Compared with the most recent year in which the question was run, the percentage of people who reported they trusted the Scottish Government in 2025 (46%) was in line with (not statistically significantly different to) the percentage in 2023 (47%), as was the percentage who did not trust the Scottish Government (53% compared with 52%).
The percentage of people who reported they trusted the UK Government in 2025 (18%) was in line with (not statistically significantly different to) the percentage in 2023 (21%), as was the percentage who did not trust the UK Government (80% in 2025 compared with 77% in 2023).
As has been the case in all previous years of the survey, the percentage who said they trust the Scottish Government to work in Scotland’s best interests, was higher than the percentage who said they trust the UK Government to work in Scotland’s best long-term interests.
Trust in Scottish and UK Governments, and local councils, to make fair decisions
|
Table |
Scottish Government (%) |
UK Government (%) |
Local Council (%) |
|---|---|---|---|
|
A great deal |
4 |
1 |
2 |
|
Quite a lot |
19 |
9 |
11 |
|
Some |
40 |
31 |
42 |
|
Not very much |
23 |
33 |
28 |
|
Not at all |
13 |
23 |
14 |
|
A great deal/quite a lot |
23 |
11 |
13 |
|
Not very much/ not at all |
35 |
57 |
42 |
|
Unweighted base |
1,549 |
1,549 |
1,549 |
Respondents were asked how much they trusted the Scottish Government, UK Government, and their Local Council to make ‘fair decisions’, and were given a response scale ranging from ‘a great deal’ to ‘not at all’.
In 2025, for all three levels of government, fewer than a quarter of respondents said they trusted them to make fair decisions ‘a great deal’ or ‘quite a lot’. Comparing between these three levels of government, respondents in 2025 were more likely to say they trusted the Scottish Government to make fair decisions ‘a great deal’ or ‘quite a lot’ (23%) than for the UK Government (11%) or their Local Council (13%).
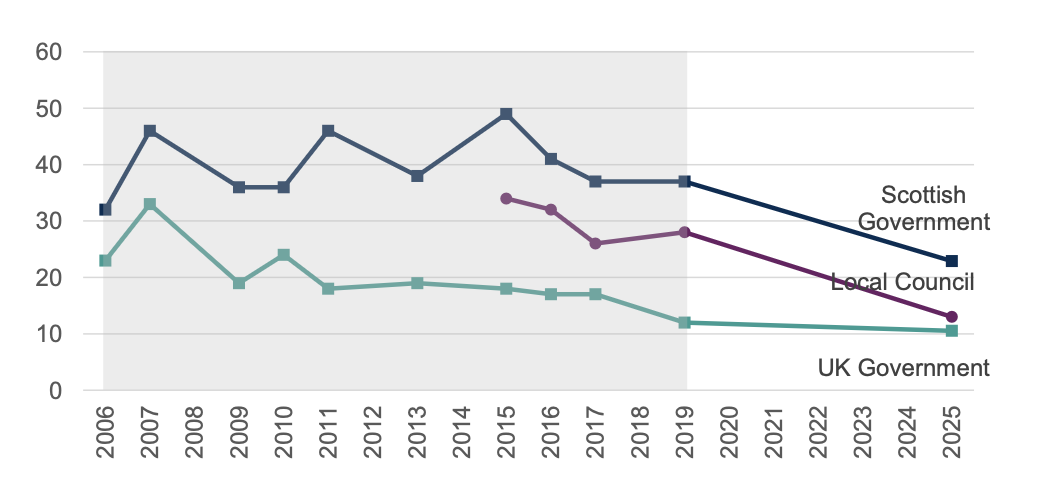
Percentage of people who trust the Scottish Government/UK Government/Local Council (a great deal/quite a lot) to make fair decisions, 1999 to 2025. N.B. Shading indicates a change in methodology from face to-face to push-to-web between 2019 and 2023
Over time, respondent trust in all three levels of government to make fair decisions has decreased, with trust to make fair decisions in 2025 being the lowest in the history of the survey. There were particular declines in trust in the Scottish Government to make fair decisions between 2019 (where it was 37%) and 2025 (23%), and also for Local Councils (28% in 2019, declining to 13% in 2025).
Trust in the UK Government to make fair decisions remained broadly similar in 2025 (11%) to the last time the question was asked in 2019 (12%). Trust in the UK Government to make fair decisions has always been lower than trust in the other two levels of government. However, as trust in both the Scottish Government and Local Councils to make fair decisions has fallen by more, levels of trust in making fair decisions between the different governments in 2025 was more similar than at most times in the past.
Whether Scottish Government, UK Government and local council good at listening to people’s views before it takes decisions
|
Table |
Scottish Government (%) |
UK Government (%) |
Local Council (%) |
|---|---|---|---|
|
Very good |
2 |
1 |
2 |
|
Quite good |
30 |
10 |
24 |
|
Not very good |
43 |
47 |
44 |
|
Not at all good |
19 |
39 |
24 |
|
Very good/quite good |
33 |
11 |
26 |
|
Not very good/not at all good |
62 |
86 |
68 |
|
Unweighted base (n) |
1,549 |
1,549 |
1,549 |
Respondents were asked how good they thought the Scottish Government, UK Government, and their Local Councils were at listening to people’s views before taking decisions on a response scale ranging from ‘very good’ to ‘not at all good’.
For all three levels of government, in 2025 a third or fewer respondents said that they thought governments were ‘very good’ or ‘quite good’ at listening before taking decisions. Respondents were more likely to say that the Scottish Government was ‘very good’ or ‘quite good’ at listening before taking decisions (33%), than for the UK Government (11%) of their Local Council (26%).
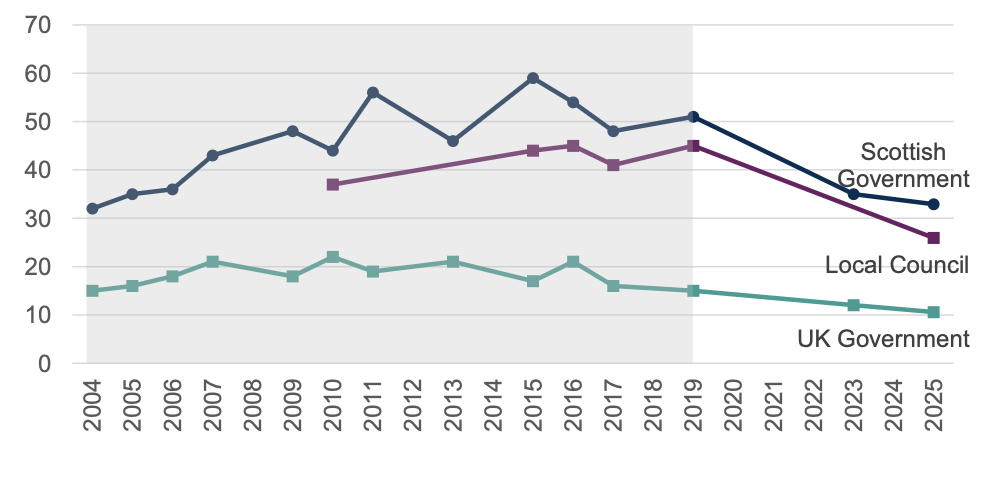
Percentage of people who think the Scottish Government/UK Government/local council are good (very/quite good) at listening before taking decisions, 2004 to 2025. N.B. Shading indicates a change in methodology from face to-face to push-to-web between 2019 and 2023. Question not asked for local government in all years.
Compared with the most recent year in which the question was run, the percentage of people who thought the Scottish Government was good at listening to people’s views before taking decisions in 2025 (33%) was in line with (not statistically significantly different to) the percentage in 2023 (35%), as was the percentage who thought the Scottish Government was not good at listening to people’s views (62% in both years).
The percentage of people who thought the UK Government was good at listening to people’s views before taking decisions in 2025 (11%) was in line with the percentage in 2023 (12%), as was the percentage who thought the UK Government not good at listening to people’s views (86% in both years).
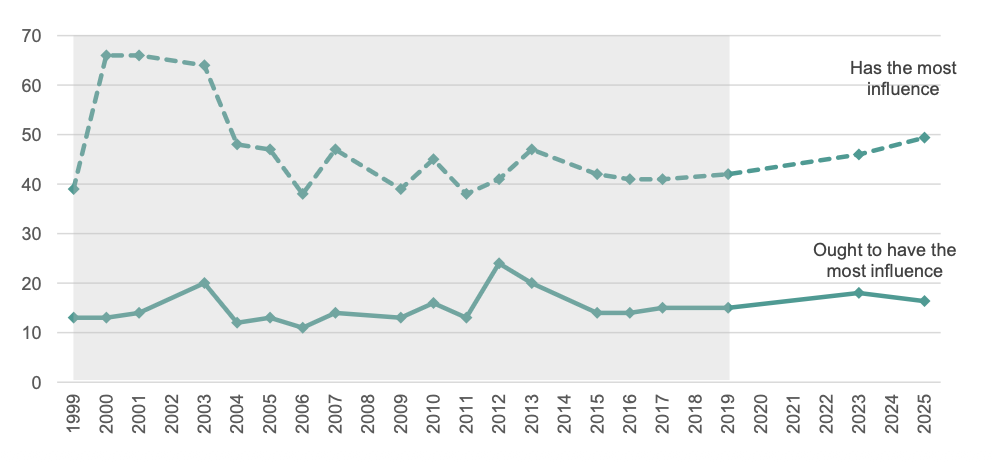
Who has the most influence over the way Scotland is run? And who ought to have the most influence?
Respondents were asked who they thought has the most influence over how Scotland is run, and who they thought ought to have the most influence.
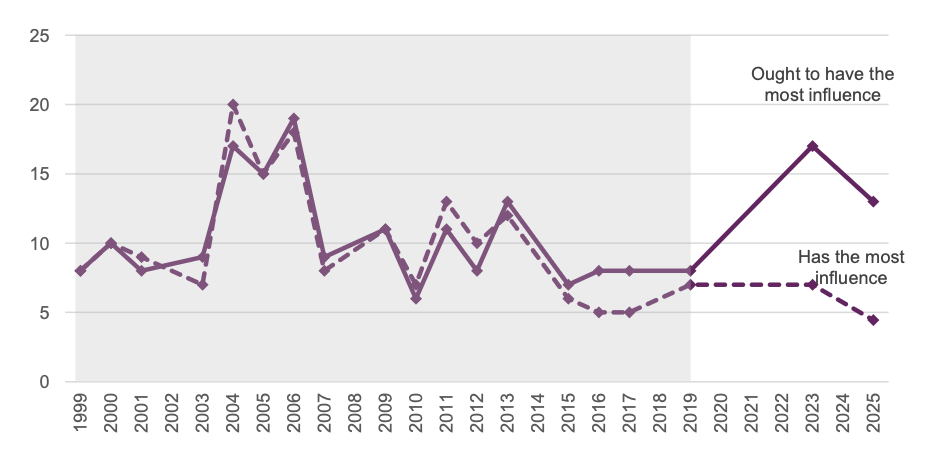
In 2025, around four in ten (42%) of respondents thought that the Scottish Government has the most influence, while two thirds (67%) thought the Scottish Government ought to have the most influence. Respondents were more likely to think that the Scottish Government ought to have the most influence, than do have the most influence. The opposite was true for the UK Government, where half (49%) thought the UK Government has the most influence, but less than one in five (16%) thought UK Government ought to have the most influence.
|
Table |
Has the most influence (%) |
Ought to have the most influence (%) |
|---|---|---|
|
The Scottish Government |
42 |
67 |
|
The UK Government at Westminster |
49 |
16 |
|
Local Councils in Scotland |
4 |
13 |
|
The European Union |
1 |
1 |
|
Unweighted base (n) |
1,549 |
1,549 |
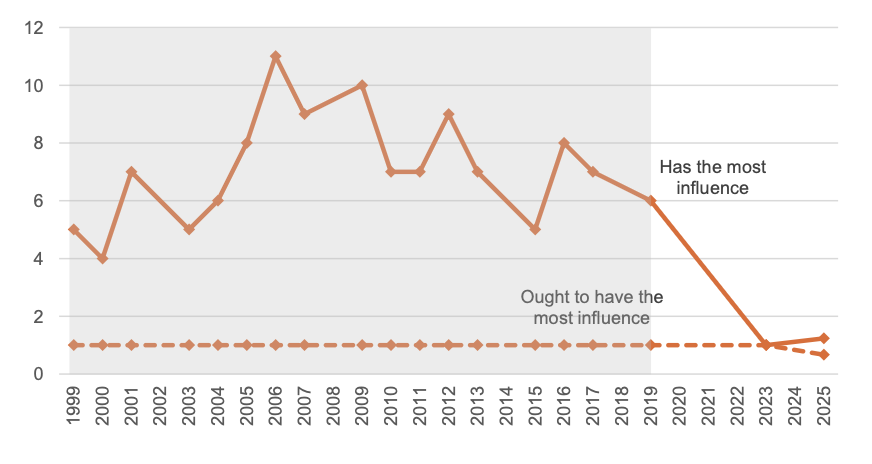
Compared to the previous year in which the question was run, on who has the most influence over how Scotland runs, the percentage selecting the local councils decreased from 7% in 2023 to 4% in 2025. On who ought to have the most influence, the percentage selecting the Scottish Government increased from 61% in 2023 to 67% in 2025; over the same period, the percentage selecting local councils decreased from 17% to 13%, and for the European Union decreased also (although to an extent which cannot be observed from the rounded data).
These questions have been asked since 1999, most recently in 2023. In each year the question was asked, respondents have been more likely to think the Scottish Government ought to have the most influence than do have the most influence. Similarly, respondents have been more likely to think the UK Government has the most influence, than ought to have the most influence.
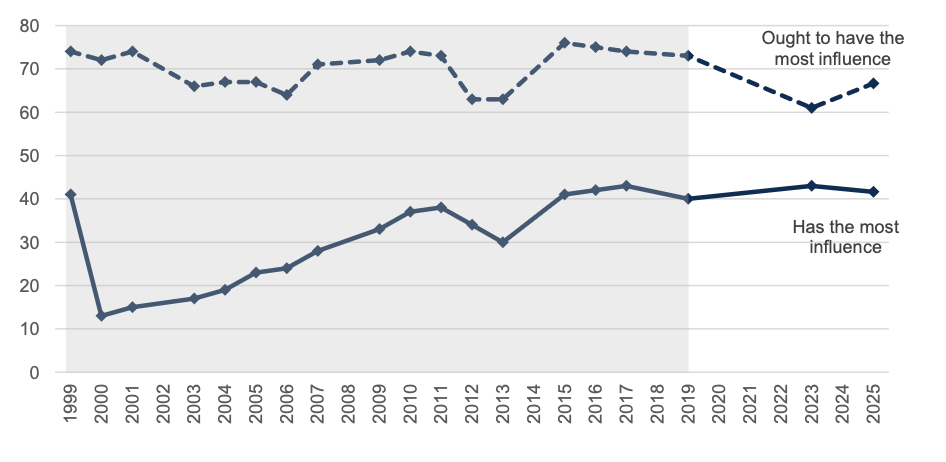
Percentage of people who think the Scottish Government has the most influence, and who think the Scottish Government ought to have the most influence, over the way Scotland is run, 1999 to 2025. N.B. Shading indicates a change in methodology from face to-face to push-to-web between 2019 and 2023
Percentage of people who think the UK Government has the most influence, and who think the UK Government ought to have the most influence, over the way Scotland is run, 1999 to 2025. N.B. Shading indicates a change in methodology from face to-face to push-to-web between 2019 and 2023
Percentage of people who think local councils have the most influence, and who think local councils ought to have the most influence, over the way Scotland is run, 1999 to 2025. N.B. Shading indicates a change in methodology from face to-face to push-to-web between 2019 and 2023
Percentage of people who think the European Union have the most influence, and who think the European Union ought to have the most influence, over the way Scotland is run, 1999 to 2025. N.B. Shading indicates a change in methodology from face to-face to push-to-web between 2019 and 2023
Whether the Scottish Parliament gives Scotland a stronger voice in the UK, a weaker voice, or makes no difference
Respondents were asked whether they thought the Scottish Parliament gives Scotland a stronger voice in the UK, a weaker voice, or if it makes no difference.
|
Table |
(%) |
|---|---|
|
A stronger voice in the United Kingdom |
54 |
|
A weaker voice in the United Kingdom |
7 |
|
Or, is it making no difference? |
37 |
|
Unweighted base (n) |
1,549 |
This question has been asked since 1999, most recently in 2019. Over time, the ‘no difference’ response option has remained the least frequently chosen, with the ‘stronger voice’ response option being the most frequently chosen in most years.
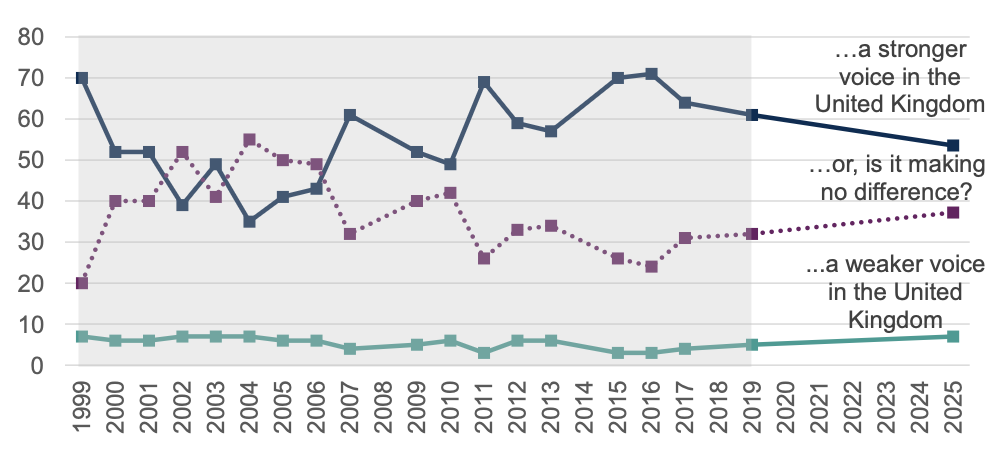
Whether the Scottish Parliament gives Scotland a stronger voice in the UK, a weaker voice, or makes no difference, 1999 to 2025. N.B. Shading indicates a change in methodology from face to-face to push-to-web between 2019 and 2023.
Whether the Scottish Parliament gives ordinary people more say in how Scotland is governed, less say, or makes no difference
Respondents were asked whether they thought the Scottish Parliament gives ordinary people more say, less say, or makes no difference.
In 2025, half of respondents (49%) thought the Scottish Parliament gives ordinary people more say in how Scotland is governed; 5% thought it gives ordinary people less say, 43% thought it makes no difference, and 5% thought it makes no difference.
|
Table |
(%) |
|---|---|
|
More say |
49 |
|
Less say |
5 |
|
Makes no difference |
43 |
|
Unweighted base (n) |
1,549 |
Compared to the most recent year in which the question was run, the percentage of people who thought that the Scottish Parliament gives ordinary people more say in how Scotland is governed was 49% in 2025, in line with 45% in 2023 (not a statistically significant difference). For those who thought the Scottish Parliament gives people less say, the percentage in 2025 (5%) decreased from 2023 (14%), a statistically significant decrease. The percentage who thought it made no difference was 43% in 2025, an increase on the 38% from 2023 (a statistically significant difference).
This question has been asked since 1999, most recently in 2023. The ‘less say’ response option has consistently been the least frequently chosen. Since 2013, the ‘more say’ response option has been selected more frequently than ‘makes no difference’, although the gap appears to have narrowed in recent years.
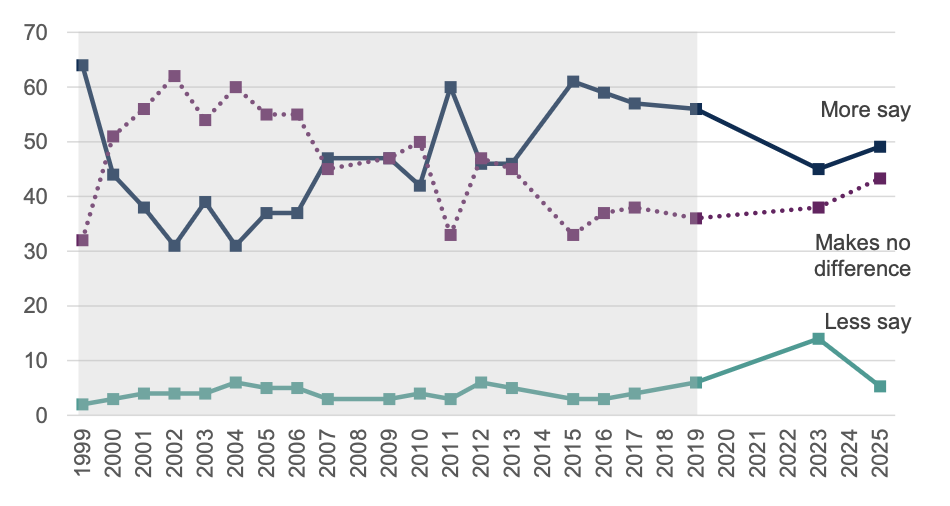
Whether the Scottish Parliament gives ordinary people more say in how Scotland is governed, less say, or makes no difference, 1999 to 2025. N.B. Shading indicates a change in methodology from face to-face to push-to-web between 2019 and 2023
Subgroups: Attitudes towards government and Parliament
Data tables for all subgroups, by demographic, economic and political factors are available in the supplementary tables alongside this report.
In the 2025 survey, for trust in the Scottish Government respondents with no interest in politics (‘none at all’) were less likely to trust the Scottish Government to ‘work in Scotland’s best interests’ (31% compared to 46% for all respondents). Those on the left of the left-right political scale[13] (52%), supporters of Scottish independence (61%), and supporters of the SNP (73%) and Green Party (60%) were also more likely to trust the Scottish Government than the average among all respondents (46%).
Broadly similar patterns of response by political factor subgroup are also apparent in relation to more positive attitudes towards ‘trusting the Scottish Government to make fair decisions’, and being more likely to report that the Scottish Government is ‘good at listening to people’s views before it takes decisions’.
In relation to the whether the Scottish Parliament gives Scotland ‘a stronger voice in the UK, a weaker voice, or makes no difference’, those on the left of the left-right political scale were more likely to report having a Scottish Parliament gives Scotland a stronger voice (60%) than the average for all respondents (54%), which was also the case for supporters of Scottish independence (62%).
Contact
Email: socialresearch@gov.scot