
Scottish Social Attitudes 2025: attitudes to discrimination and positive action
Findings from the 2025 Scottish Social Attitudes survey on discrimination and positive action. It explores attitudes to prejudice, diversity and immigration, trends over time, and identifies groups most at risk, alongside mixed public views on equality and support for positive action in Scotland.
3. Relationships
This chapter examines the extent to which people hold discriminatory attitudes towards different groups of people in the context of personal relationships. It looks at how these attitudes vary between groups in society, if these attitudes have changed since 2015, and if so, in what ways.
Respondents were asked the following questions:
‘How would you feel if a close relative of yours married or formed a long-term relationship with…’:
- someone who is Black or Asian
- a Muslim
- someone who is Jewish
- a Catholic
- a Protestant
- someone who has schizophrenia which has been under control for a year or so through medication
- someone who from time-to-time experiences depression
- a Gypsy/Traveller
- a trans person
- someone of the same sex as themselves
- a refugee[22]
Possible answer options were: ‘very happy’, ‘happy’, ‘neither happy nor unhappy’, ‘unhappy’ and ‘very unhappy’ (see Table 3.1). Throughout the report we use the term happy to describe ‘very happy’ and ‘happy’ combined and unhappy to describe ‘unhappy’ and ‘very unhappy’ combined.
The greatest levels of unhappiness were towards a close relative marrying or forming a long-term relationship with a Gypsy/Traveller, a trans person, or someone who has schizophrenia which has been under control for a year or so through medication. In each of these cases, more people expressed unhappiness at the possible relationship than expressed happiness. Three in ten (31%) said they would be unhappy if a close relative married or formed a long-term relationship with someone who is a Gypsy/Traveller, while 25% said they would be happy and 41% said ‘neither happy nor unhappy’. Similar proportions held the same view towards a trans person (30% unhappy, 26% happy and 42% ‘neither happy nor unhappy’), and towards someone who has schizophrenia which has been under control for a year or so through medication (29% unhappy, 26% happy and 43% ‘neither happy nor unhappy’).
The greatest levels of happiness were expressed towards a close relative marrying or forming a long-term relationship with someone who is Black or Asian, with half (49%) saying they would be happy. At least two in five (45%) said they would be happy if a close relative married or formed a long-term relationship with someone who is Catholic (45%), someone who is Protestant (44%), someone who is the same sex as themselves (43%), or someone who is Jewish (40%). In each of these cases, the proportion who expressed unhappiness was no higher than 10%. Of the different religious groups included in the survey, the least acceptance was expressed towards Muslims, with 37% saying they would be happy and 15% unhappy if a close relative married or formed a long-term relationship with a Muslim.
| Demographic or equalities group | Very happy/happy | Neither happy nor unhappy | Very unhappy/ unhappy |
|---|---|---|---|
| Someone who is Black or Asian | 49 | 44 | 6 |
| A Muslim | 37 | 45 | 15 |
| Someone who is Jewish | 40 | 51 | 7 |
| A Catholic | 45 | 51 | 3 |
| A Protestant | 44 | 50 | 4 |
| Someone who has schizophrenia which has been under control for a year or so through medication | 26 | 43 | 29 |
| Someone who from time-to-time experiences depression | 32 | 54 | 13 |
| A Gypsy/Traveller | 25 | 41 | 31 |
| A trans person | 26 | 42 | 30 |
| Someone of the same sex as themselves | 43 | 45 | 10 |
| A refugee | 31 | 48 | 18 |
Base: All respondents to discrimination module, unweighted = 1,549
Do different groups of people have different views?
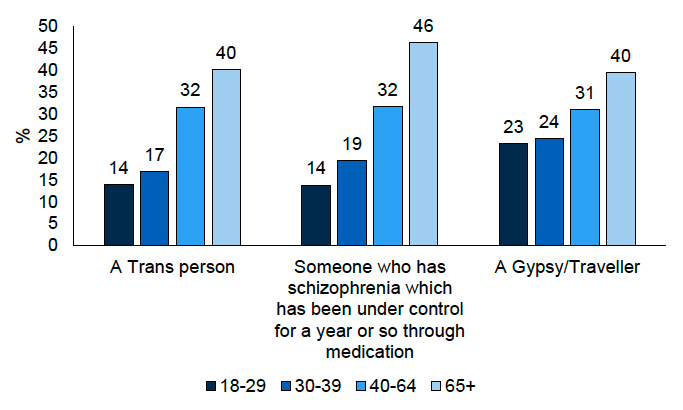
Happiness towards a close relative marrying or forming a long-term relationship with different groups of people varied across age groups. Figure 3.1 shows that older people were more likely to express unhappiness towards a close relative marrying or forming a long-term relationship with a trans person, someone who has schizophrenia which is under control through medication, or a Gypsy/Traveller compared with those in younger age groups. For example, 40% of those aged 65 or older said they would be unhappy if a close relative married a trans person, compared with 14% of those aged 16 to 29. Older people were also more likely to be unhappy if a close relative married or formed a long-term relationship with a Muslim, someone who experiences depression from time to time, someone of the same sex as themselves, or a refugee (see Supplementary tables).
Figure 3.1: Proportion of those who would be very unhappy or unhappy if a close relative married or formed a long-term relationship with someone from different groups, by age
Base: All respondents to discrimination module, unweighted = 1,549
These views also varied by education. For example, only 22% of those with no formal qualifications would be happy if a close relative married or formed a long-term relationship with someone who is Black or Asian compared with 53% of those with Scottish Highers or equivalent and 59% of those with a degree or equivalent.
Perhaps unsurprisingly, those who would rather live in a more diverse area (i.e. ‘with lots of different kinds of people’) were more likely to be happy if their close relative married or formed a long-term relationship with someone from a range of the groups considered compared with those who would rather live in a less diverse area (i.e. ‘where most people are similar to you’) (see Table 3.2). Similarly, those who thought that ‘Scotland should do everything it can to get rid of all kinds of prejudice’ were more likely to express happiness towards a close relative being in a relationship with someone from one of the groups considered than those who thought that ‘sometimes there is good reason for people to be prejudiced against certain groups’.
For example, around three in five (58%) who thought that ‘Scotland should do everything it can to get rid of prejudice’ would be happy if a close relative was in a relationship with someone who is Black or Asian, compared with 29% of those who think that ‘sometimes there is a good reason to be prejudiced’. This was also observed towards those in certain religious groups, where around half (48%) who thought that ‘Scotland should do everything it can to get rid of prejudice’ would be happy if a close relative formed a relationship with a Muslim, compared with only 17% of those who think ‘sometimes there is a good reason to be prejudiced’.
| Demographic or equalities group | Would rather live in an area with lots of different kinds of people | Would rather live in an area where most people are similar to you |
|---|---|---|
| Someone who is Black or Asian | 66 | 25 |
| A Muslim | 56 | 15 |
| Someone who is Jewish | 57 | 21 |
| A Catholic | 59 | 26 |
| A Protestant | 57 | 29 |
| Someone who has schizophrenia which has been under control for a year or so through medication | 42 | 10 |
| Someone who from time-to-time experiences depression | 48 | 14 |
| A Gypsy/Traveller | 41 | 7 |
| A trans person | 42 | 8 |
| Someone of the same sex as themselves | 59 | 22 |
| A refugee | 50 | 10 |
Base: All respondents to discrimination module, unweighted = 1,549
Knowing someone from any of the groups considered was associated with more positive feelings about potential marriage or long-term relationships within the family. For example, 46% of those who personally knew someone who is Muslim said they would be happy for a family member to be in a relationship with someone who is Muslim, compared with 29% who did not know someone who is Muslim. Similarly, 52% who knew someone who is Jewish would be happy about a relative forming a relationship with someone who is Jewish, compared with 35% who did not know someone who is Jewish.
Certain demographic or equalities groups, notably those who identified as LGB+, tended to be more tolerant of all other groups considered. This is possibly because they were in a better position to relate to discrimination than others. For example, 57% of those who identified as LGB+ said they would be happy for a family member to form a relationship with a Gypsy/Traveller, compared with 22% who identified as straight. Similarly, 56% of those who identified as LGB+ would be happy with a relationship between a close family member and someone with schizophrenia, compared with 23% of those who identified as straight.
On the whole, those who identified as belonging to a religion (most of whom are Christian in Scotland) showed slightly less tolerant attitudes than those who did not belong to a religion. For example, only 21% of those who identified as belonging to a religion said they would be happy about a relative forming a relationship with someone with schizophrenia, compared with 32% of those who did not identify as belonging to a religion. However, Protestant-Catholic sectarianism appears to be much less of an issue than other forms of discrimination, with both groups being reasonably content with relationships with the other group, and both more tolerant of the other than of Muslims. For example, 43% of Protestants said they would be happy and only 3% unhappy if a relative formed a relationship with a Catholic, while 38% of Catholics would be happy and 6% unhappy if a relative formed a relationship with a Protestant. By comparison, 30% of Protestants would be happy and 18% unhappy, and 32% of Catholics would be happy and 13% unhappy, if a relative formed a relationship with a Muslim.
Key drivers in unhappiness if a close relative married someone from a particular group
Regression modelling was used to look at the key drivers of unhappiness if a close relative married or formed a long-term relationship with someone from each of the three groups considered above as most at risk of prejudice in relationships: people with schizophrenia, trans people, and Gypsy/Travellers.
The key drivers for each of these three groups are set out separately in the three lists below. The strongest associations noted in the models are those in the second and third lists between thinking someone is unsuitable as a primary school teacher (see Chapter 5) and being unhappy if a close relative married or formed a long-term relationship with someone from the same group. This suggests that context is of minimal importance: if someone does not think a trans person or a Gypsy/Traveller is suitable as a primary school teacher, it is very unlikely they would be happy with them marrying into the family.[24] Full details are provided in the supplementary tables.
Key drivers of being unhappy if a close relative married or formed a long-term relationship with someone with schizophrenia:
- Living in a less deprived area
- Said they would be unhappy if a close family member married or formed a long-term relationship with someone from higher numbers of different groups
Key drivers of being unhappy if a close relative married or formed a long-term relationship with someone who is trans:
- Aged 65 or above
- Straight or heterosexual
- Not knowing anyone who is trans
- Said they would be unhappy if a close family member married or formed a long-term relationship with someone from higher numbers of different groups
- Think someone who is trans unsuitable as a primary school teacher
Key drivers of being unhappy if a close relative married or formed a long-term relationship with a Gypsy/Traveller:
- Earning above the median income
- Prefer to live in an area where most people are similar to you
- Said they would be unhappy if a close family member married or formed a long-term relationship with someone from higher numbers of different groups
- Think someone who is a Gypsy/Traveller unsuitable as a primary school teacher
In all three models there were also strong associations between being unhappy if a close relative married or formed a long-term relationship with someone from each of the three groups and the number of other groups they would be unhappy about a close relative forming a relationship with. This implies that being prejudiced against one group (in terms of relationships) increases the likelihood of being prejudiced against others.
The other factors listed above show an increased likelihood of being unhappy if a close relative married or formed a long-term relationship with someone with schizophrenia / someone who is trans / a Gypsy/Traveller, irrespective of their other characteristics.
Living in a less deprived area increases the likelihood that someone would be unhappy about a close relative marrying or forming a long-term relationship with someone with schizophrenia. The reverse is also true: living in a more deprived area decreases the likelihood of unhappiness about this.
Being age 65 or above, being straight/heterosexual, and not knowing anyone who is trans all increase the likelihood of being unhappy about a close relative marrying or forming a long-term relationship with someone who is trans.
Having above median income and preferring to live in an area where most people are similar to you both increase the likelihood of being unhappy about a close relative marrying or forming a long-term relationship with a Gypsy/Traveller.
How attitudes have changed over time
Attitudes towards a close relative marrying or forming a long-term relationship with someone from each of the groups considered have become more neutral since 2006, with a higher proportion choosing ‘neither happy nor unhappy’ and fewer people expressing both happiness and unhappiness at the thought of a close relative marrying or forming a long-term relationship with someone from most of the groups considered (Table 3.6). It may be that people have become more accepting of peoples’ right to make their own choices, and therefore take the middle, neutral option of ‘neither happy nor unhappy’ because whether a person belongs to a particular sub-group or equalities group is not a factor in how they feel about the relationship.
The most positive change was in attitudes towards same sex relationships. In 2006, a third (33%) of people expressed unhappiness at the idea of a close relative marrying or forming a long-term relationship with someone of the same sex[25]. This figure fell to 16% in 2015, and further to 10% in 2025. The proportion expressing happiness was higher in 2025 (43%) than in 2006 (37%), but lower than in 2015 (52%). Whereas the proportion who expressed neither happiness nor unhappiness remained static between 2006 and 2015 (28%-31%), this increased to 45% in 2025.
There was also a large fall between 2006 and 2015 in the proportion who expressed unhappiness about a relative marrying someone who had undergone gender reassignment[26], from 50% to 32%. In 2025, the question was amended to ask about someone who is trans, and between 2015 and 2025 this figure did not change (30% in 2025). Over the same period, the proportion who were happy about this prospect rose from 20% in 2006 to 36% in 2015 but then fell back to 26% in 2025.
Other groups saw smaller changes. The proportion unhappy with a close relative marrying or forming a long-term relationship with someone who is Black or Asian fell from 11% in 2006 to 6% in 2025, with no change between 2015 and 2025. The proportion unhappy with a close relative marrying a Gypsy/Traveller only fell from 37% in 2006 to 31% in 2025, with no change between 2015 and 2025. Looking at religious groups, the proportion who were unhappy with a close relative marrying a Muslim fell slightly, from 24% in 2006 to 20% in 2015, but continued to fall, to 16% in 2025. The proportion who were unhappy with a close relative marrying someone who is Jewish fell from 10% in 2006 to 7% in 2025, again with no change between 2015 and 2025. In all four of these cases, the proportion who were happy was significantly lower in 2025 than in 2015, while there had been a large rise in the proportion who said they were ‘neither happy nor unhappy’.
| Demographic or equalities group | Level of happiness | 2006 | 2010 | 2015 | 2025 |
|---|---|---|---|---|---|
| Someone who is Black or Asian | Happy | 58 | 58 | 62 | 49 |
| Someone who is Black or Asian | Neither | 29 | 31 | 31 | 44 |
| Someone who is Black or Asian | Unhappy | 11 | 9 | 5 | 6 |
| A Muslim | Happy | 49 | 47 | 49 | 37 |
| A Muslim | Neither | 26 | 29 | 29 | 45 |
| A Muslim | Unhappy | 24 | 23 | 20 | 15 |
| Someone who is Jewish | Happy | 55 | 54 | 57 | 40 |
| Someone who is Jewish | Neither | 33 | 35 | 35 | 51 |
| Someone who is Jewish | Unhappy | 10 | 9 | 6 | 7 |
| Someone who from time-to-time experiences depression | Happy | n/a | 41 | 45 | 32 |
| Someone who from time-to-time experiences depression | Neither | n/a | 35 | 34 | 54 |
| Someone who from time-to-time experiences depression | Unhappy | n/a | 21 | 19 | 13 |
| A Gypsy/Traveller | Happy | 31 | 32 | 37 | 25 |
| A Gypsy/Traveller | Neither | 28 | 28 | 30 | 41 |
| A Gypsy/Traveller | Unhappy | 37 | 37 | 32 | 31 |
| A trans person | Happy | 20 | 22 | 36 | 26 |
| A trans person | Neither | 27 | 26 | 31 | 42 |
| A trans person | Unhappy | 50 | 49 | 32 | 30 |
| Someone of the same sex as themselves | Happy | 37 | 37 | 52 | 43 |
| Someone of the same sex as themselves | Neither | 28 | 31 | 30 | 45 |
| Someone of the same sex as themselves | Unhappy | 33 | 31 | 16 | 10 |
Base: All respondents to discrimination module, unweighted = 1,594 (2006); 1,495 (2010); 1,288 (2015); 1,549 (2025)
n/a – no data collected in this year
Contact
Email: socialresearch@gov.scot