
Scottish Social Attitudes 2025: attitudes to discrimination and positive action
Findings from the 2025 Scottish Social Attitudes survey on discrimination and positive action. It explores attitudes to prejudice, diversity and immigration, trends over time, and identifies groups most at risk, alongside mixed public views on equality and support for positive action in Scotland.
2. General attitudes to prejudice and knowing someone from different groups
This chapter explores general views and attitudes of Scottish people towards prejudice. It covers how inclined people are towards a more discriminatory point of view, their feelings about diversity, immigration and the level of contact people have with people from a number of different sub-groups and equalities groups. This chapter also examines changes in these attitudes over time using comparisons with previous findings from 2006, 2010, and 2015.
Acceptability of prejudice
To measure how accepting respondents were of prejudice, they were presented with two statements and asked to choose which came closest to their own view:
- ‘Scotland should do everything it can to get rid of all kinds of prejudice’
- ‘Sometimes there is good reason for people to be prejudiced against certain groups’
In previous years, this question was asked as part of the face-to-face survey, where the option ‘Depends’ was available for interviewers to select if the respondent could not decide between the two statements. Moving to a web questionnaire, the option ‘It depends’ only appeared if the respondent tried to skip the question without choosing one of the two statements.
In 2025, almost two-thirds (65%) of people were of the view that ‘Scotland should do everything it can to get rid of all kinds of prejudice’. This represents a slight decrease from 2015 (69%), returning to a similar level recorded in 2006 (65%) and 2010 (66%).
Around one in three (31%) people said that ‘Sometimes there is good reason for people to be prejudiced against certain groups’. This is significantly higher than in 2015, when one in five people (22%) held this view. While 31% is the highest figure in the time series so far, the proportion providing an answer of ‘It depends’ was lower than in any of the other years this question was asked, which might be due to the change in data collection mode (Table 2.1).
| Views on prejudice | 2002 | 2006 | 2010 | 2015 | 2025 |
|---|---|---|---|---|---|
| Scotland should do everything it can do get rid of all kinds of prejudice | 68 | 65 | 66 | 69 | 65 |
| Sometimes there is good reason for people to be prejudiced against certain groups | 26 | 29 | 28 | 22 | 31 |
| (Depends) | 4 | 5 | 4 | 7 | 1 |
| (Don’t know) | 1 | 1 | 2 | 2 | 1 |
| (Refused) | 0 | 0 | 0 | 0 | 2 |
| Bases (unweighted) | 1665 | 1594 | 1495 | 1288 | 1549 |
Base: All respondents to discrimination module
Do different groups of people have different views?
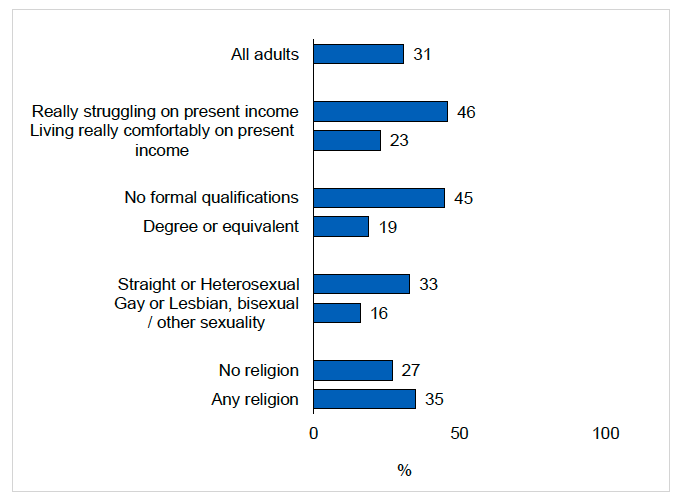
There were differences in attitudes between different economic and demographic subgroups (Figure 2.1). Some of the most pronounced differences were by self-assessed financial hardship and education.
Those who were ‘really struggling on present income’ were more likely than those who were ‘living really comfortably on present income’ to say that ‘sometimes there is good reason for people to be prejudiced against certain groups’ (46% compared with 23%). Those with no formal qualifications were more than twice as likely as those with a degree level qualification to select this option (45% compared with 19%).
There were also differences by sexuality and religious identity. Those who identified as straight or heterosexual were more likely than those who identified as lesbian, gay, bisexual or other sexuality (LGB+)[17] to say that ‘sometimes there is good reason for people to be prejudiced against certain groups’ (33% compared with 16%).
Those who identified as belonging to a religion were also more likely than those who did not belong to a religion to say that ‘sometimes there is a good reason for people to be prejudiced’ (35% compared with 27%). Differences in the views of those belonging to any and those belonging to no religion may be, in part, explained by varying levels of contact with people from different sub-groups and equalities groups. As will be explored later in this chapter, those who identified as belonging to a religion were less likely than those who identified as not belonging to a religion to know someone from a number of different groups.
Figure 2.1: Proportion of people in Scotland who say that ‘Sometimes there is good reason for people to be prejudiced against certain groups’, by their self-assessed financial hardship, education, sexuality and religion (2025)
Base: All respondents to discrimination module, unweighted = 1,549
Knowing someone from one of the groups included in the survey[18] tended to be associated with being less likely to say that ‘there is good reason for people to be prejudiced’. For example, 21% of those who know someone who is trans said that ‘there is good reason for people to be prejudiced against certain groups’, compared with 36% of those who did not know anyone who is trans. Similarly, 26% who knew someone who is Muslim said this, compared with 37% who did not know anyone who is Muslim. And there was also a relationship between knowing people from a wider range of different demographic and equalities groups and being less likely to say that ‘there is a good reason for people to be prejudiced’. Those who knew someone from four or more of the groups considered were less likely (25%) to say that ‘there is good reason for people to be prejudiced against certain groups’ than those who knew someone from only two or three of the groups (38%). However, there was no difference in attitudes between those who knew someone from no more than one of the groups and those who knew someone from two or three.
Attitudes to diversity
To measure respondents’ attitudes towards diversity, they were asked what kind of area they would prefer to live in, and could select from the following three options:
- ‘…with lots of different kinds of people’
- ‘…where most people are similar to you’
- ‘Can’t choose’[19]
Nearly half (45%) of people in Scotland said they would prefer to live in an area ‘with lots of different kinds of people’, while just under a third (31%) said they would prefer to live in an area ‘where most people are similar to you’ (see Table 2.2). A quarter (24%) said they could not choose. These figures are consistent with findings from 2015, sustaining the increase from 2010 in the proportion who said they would prefer to live in an area ‘with lots of different kinds of people’.
| Preference of type of area to live in | 2002 | 2006 | 2010 | 2015 | 2025 |
|---|---|---|---|---|---|
| With lots of different kinds of people | 37 | 34 | 37 | 47 | 45 |
| Where most people are similar to you | 46 | 49 | 43 | 33 | 31 |
| Can’t choose | 17 | 16 | 17 | 20 | 24 |
| (Refused) | 0 | 1 | 3 | 0 | 1 |
| Bases (unweighted) | 1507 | 1434 | 1366 | 1234 | 1549 |
Base: All respondents who completed self-complete (2002, 2006, 2010, 2015) and all respondents who completed the discrimination module in 2025
As in previous years, SSA 2025 included a question on the impact of immigration on Scotland, to further explore attitudes towards diversity. Respondents were asked how much they agree or disagree with the following statement:
‘People from outside Britain who come to live in Scotland make the country a better place.’
Around two in five (39%) either ‘agreed’ or ‘strongly agreed’ that ‘people from outside Britain who come to live in Scotland make the country a better place’. A similar proportion (43%) ‘neither agreed nor disagreed’ with the statement and only 17% either ‘disagreed’ or ‘strongly disagreed’. There had been a significant increase in the level of agreement between 2010 and 2015 with this statement, but the 2025 figures show little change from 2015, when 40% agreed and 20% disagreed.
Do different groups of people have different views?
Previous analysis of SSA data has shown that those who express more positive views about diversity are less likely than others to find prejudice acceptable in any form[20].
Similar patterns were found in the SSA 2025 data. Around 3 in 5 (61%) who would prefer to live in an area where most people were similar to them thought there was ‘sometimes good reason to be prejudiced’, compared with 12% of those who preferred to live in an area ‘with lots of different kinds of people’.
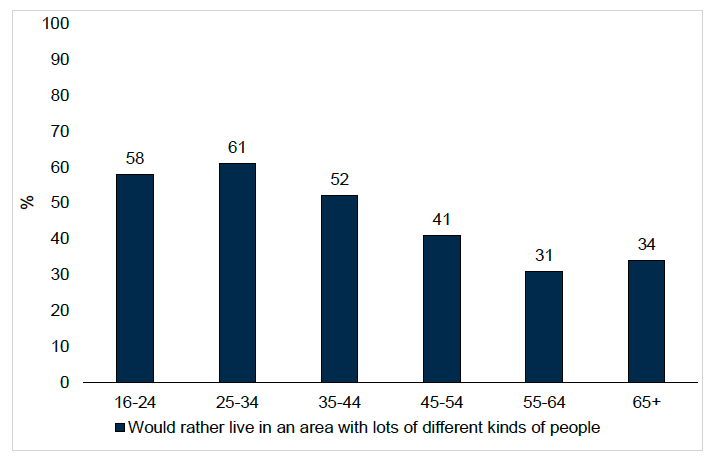
There were also differences by some demographics. Generally, those most likely to want to live in an area ‘with lots of different kinds of people’ were younger people (aged 16-34), those who identified as LGB+, and those from ethnic minority backgrounds (Table 2.3). For example, 58% of those aged 16 to 24 said that they would rather live in an area ‘with lots of different kinds of people’, compared with 34% of those aged 65 and over (Figure 2.2).
| Preference of type of area to live in | Straight/Heterosexual | Lesbian or Gay, Bisexual/ Other sexuality | White | Black, Asian, Mixed or other ethnic origin |
|---|---|---|---|---|
| With lots of different kinds of people | 42 | 72 | 44 | 67 |
| Where most people are similar to you | 33 | 12 | 32 | 15 |
| Can’t choose | 24 | 15 | 24 | 18 |
| (Refused) | 0 | 0 | 0 | 0 |
| Bases (unweighted) | 1,345 | 149 | 1,392 | 113 |
Base: All respondents to the discrimination module, unweighted = 1,549
Figure 2.2: Proportion of people in Scotland who would prefer to live in an area with lots of different people, by age (2025)
Base: All respondents to discrimination module, unweighted = 1,549
Those who personally knew someone from one of the groups included in the survey (41%) were more likely than those who did not know anyone from these groups (30%) to want to live in an area ‘with lots of different kinds of people’. Finally, men were more likely than women to want to live in an area where most people are similar to them (35% compared with 27%, respectively).
Views on the impact of immigration also varied by a range of demographic and economic factors. Around three in five people (58%) with a degree or equivalent ‘agreed’ or ‘strongly agreed’ that ‘people from outside Britain who come to live in Scotland make the country a better place’, compared with two in five (39%) of those with Scottish Highers or equivalent and only 17% of those with no formal qualifications.
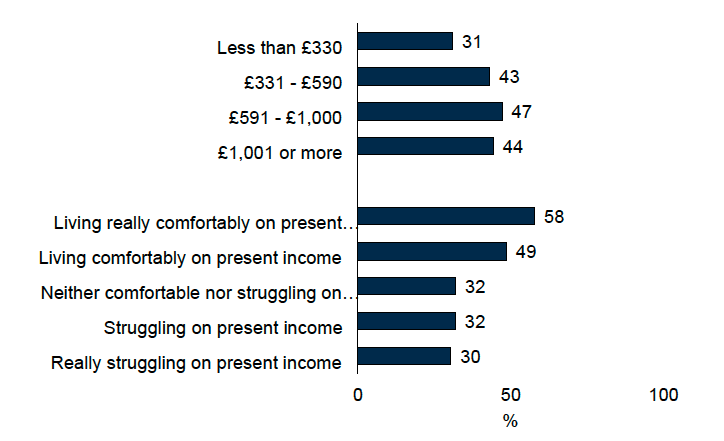
Figure 2.3 shows that those in the lowest income group (31%) were less likely to agree that ‘people from outside Britain who come to live in Scotland make the country a better place’ than those in all other income groups (43%-47%). Similarly, those who felt they were ‘living comfortably’ or ‘really comfortably’ on their present income were more likely to agree (53%) than those ‘struggling’ or ‘really struggling’ on their present income (31%).
Figure 2.3: Agreement that “People from outside Britain who come to live in Scotland make the country a better place” by weekly household income and feelings about living on present income
Base: All respondents to discrimination module, unweighted = 1,549
Contact with different groups of people
To measure the level of contact respondents had with people from different groups, they were asked if they personally knew anyone who:
- ‘…is from a different racial or ethnic background to you’
- ‘…is gay, lesbian or bisexual’
- ‘…is trans’
- ‘…is Muslim’
- ‘…is Jewish’
- ‘…has a mental illness like depression or bipolar’
The vast majority of people (95%) knew someone from at least one of these groups. The proportion who personally knew someone who is from a different racial or ethnic background to them (80%) or who is gay, lesbian or bisexual (82%) has remained consistent since 2010 and 2015 (Table 2.4). The proportion who personally knew someone who is Muslim was similar in 2015 and 2025 (54% and 52%, respectively), as was the proportion who personally knew someone with a mental illness like depression or bipolar (76% and 72%, respectively).
Two new categories were added in 2025: whether they knew anyone who is trans or knew anyone who is Jewish. Around a third (30%) personally knew someone who is trans, with a similar proportion (29%) indicating they personally knew someone who is Jewish.
| Do you personally know anyone who…? | 2010 | 2015 | 2025 |
|---|---|---|---|
| Is from a different racial or ethnic background to you | 77 | 79 | 80 |
| Is gay, lesbian or bisexual1 | 75 | 83 | 82 |
| Is trans | n/a | n/a | 30 |
| Is Muslim | 45 | 54 | 52 |
| Is Jewish | n/a | n/a | 29 |
| Has a mental illness like depression or bipolar2 | 66 | 76 | 72 |
| Bases (unweighted) | 1366 | 1234 | 1549 |
Base: All respondents who completed self-complete (2010 and 2015) and all respondents who completed the discrimination module in 2025
n/a – no data collected in these years
1 In 2010 and 2015, this category was ‘anyone who is gay or lesbian’
2 In 2010 and 2015, this category was ‘anyone who has a mental health problem’
Do different groups of people have different experiences?
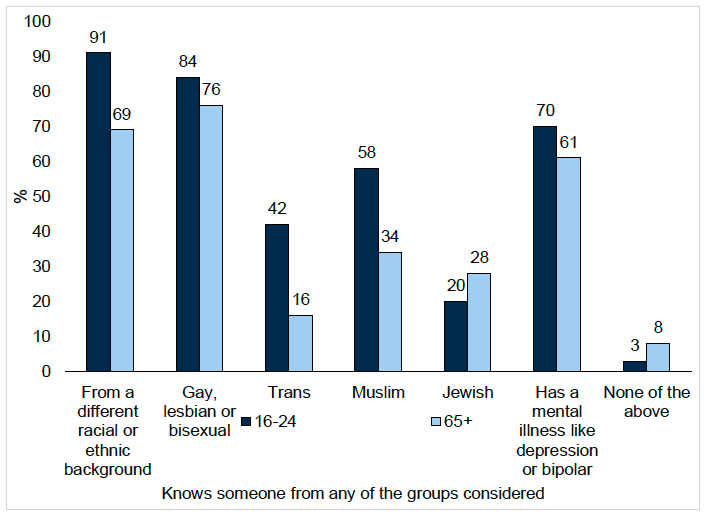
Some groups were more likely than others to personally know someone from one of the groups or equalities groups considered. Younger people were more likely than older people to personally know someone from all of the groups considered apart from someone who is Jewish, where older people were more likely than younger people to know someone who is Jewish (Figure 2.4).
Women were more likely than men to report knowing someone who is gay, lesbian or bisexual (87% compared with 78%), is trans (33% compared with 26%) or someone who has a mental illness like depression or bipolar (76% compared with 68%).
There were also significant differences by sexuality and religious identity. Those who identified as LGB+ were more likely than those who identified as straight or heterosexual to know someone from other groups. For example, 87% who identified as LGB+ said they knew someone with a mental illness, compared with 71% of those who identified as straight. Similarly, those who did not belong to a religion were significantly more likely than those who identified as belonging to a religion to personally know someone from one of the groups considered. For example, 36% of those with no religion reported knowing someone who was trans, compared with 23% of those belonging to any religion. This may, in part, be related to age, with younger people being more likely to identify as LGB+ and less likely to be religious than older people.
Those from the highest income groups were more likely than those from the lowest income groups to know someone from one of the groups considered, including someone who is from a different racial or ethnic background (89% compared with 73%), someone who is gay, lesbian or bisexual (91% compared with 78%), someone who is Muslim (63% compared with 40%), someone who is Jewish (41% compared with 20%), or someone who has a mental illness like depression or bipolar (81% compared with 70%). There were similar findings for those with a degree compared with those with lower or no formal qualifications, and for those in managerial or professional occupations compared with those in semi-routine or routine occupations.
Figure 2.4: Proportion of people in Scotland who personally know someone from any of the groups considered, by age (2025)
Base: All respondents to discrimination module, unweighted = 1,549
Key drivers in belief that ‘there is a good reason for people to be prejudiced against certain groups’
At the start of this chapter which groups of people were more or less likely to hold the view that ‘there is a good reason for people to be prejudiced against certain groups’ were explored.
Regression analysis allows us to examine each of the relationships described in a single model, to determine the key drivers of the belief that ‘there is good reason for people to be prejudiced against certain groups’.
All of the variables previously discussed, which showed an association with the belief that there may be good reason to be prejudiced, including feelings about income, sexuality, belonging to a religion, and the number of different groups considered from which they knew someone, were entered into the regression model, along with a number of attitudinal questions, including views on how happy someone would be for someone in each of these groups to marry a member of their family and the suitability of people in these groups to be a primary school teacher (the full list is provided in the supplementary tables). The model showed that the key drivers of belief that ‘there is good reason for people to be prejudiced against certain groups’ were responses to other attitudinal questions with the four questions shown in the list below identified as the key drivers[21]. More details are provided in the supplementary tables.
Key drivers of belief that ‘there is good reason for people to be prejudiced against certain groups’:
- Prefer to live in an area where most people are similar to you
- Disagree that people from outside Britain who come to live in Scotland make the country a better place
- Said would be unhappy if a close family member married or formed a long-term relationship with someone from at least 2 of the groups considered
- Said someone from at least 4 of the groups would be unsuitable as a primary school teacher.
Responses to these attitudinal questions were more strongly associated with believing that ‘there is a good reason for people to be prejudiced against certain groups’ than socio-demographic factors, feelings about income or knowing people from a range of groups. Those who said they would prefer to live in an area where most people are similar to them and those who disagreed that ‘people from outside Britain who come to live in Scotland make the country a better place’ were more likely to believe that ‘there is a good reason for people to be prejudiced against certain groups’. This does not mean that there is no association between feelings about income and believing that there may be good reason to be prejudiced. Instead, it means that the association between the two can largely be explained by the associations between feelings about income and each of the variables listed in the table. For example, those who are really struggling on their present income may also be more likely to prefer to live in an area with similar people to them and may be more likely to disagree that people from outside Britain who come to live in Scotland make the country a better place.
The other two variables identified as key drivers of the belief that there may be good reason to be prejudiced are summaries of the attitudes discussed in Chapter 3 and Chapter 5. Chapter 3 discusses attitudes towards a close family member marrying or forming a long-term relationship with someone from one of the groups considered. When negative attitudes were shown towards at least two of these groups, this was a key driver for the belief that there may be good reason to be prejudiced. Similarly, Chapter 5 discusses attitudes towards someone from different groups becoming a primary school teacher. A negative attitude towards at least four of the groups in this context was a key driver of the belief that there may be good reason to be prejudiced.
Contact
Email: socialresearch@gov.scot