Scottish Sea Fisheries Statistics 2019
National Statistics publication that provides data on the tonnage and value of all landings of sea fish and shellfish by Scottish vessels, all landings into Scotland, the rest of the UK and abroad, and the size and structure of the Scottish fishing fleet and employment on Scottish vessels.
Part of
7. Annex 1: Methodology
7.1. Sources
7.1.1. Fishing Activity and Landings information
Fishers are legally required to provide information on their fishing activities. This includes what they caught, where they caught it, what type of fishing gear they used, and where they landed their catch. The format that fishers or their agents provide the information in to Fisheries Administrations depends on the length of the fishing vessel:
- Vessels over 10 metres are required to maintain logbooks of their fishing activity and provide landings declarations.
- For UK vessels over 12m, this information must be submitted electronically in an e-logbook system.
- Vessels between 10m and 12m may use paper logbooks.
- EU legislation does not require vessels 10 metres and under to keep logbooks, but in Scotland, these vessels are required to provide equivalent information on FISH1 forms.
7.1.2. Value of Landings
Legislation requires that buyers and sellers of fish have to be registered and have to supply Fisheries Administrations with sales notes. These sales notes can be in paper or electronic format and show what was paid for the fish being sold. With sales of fish into non-EU countries, it can take a long time for sales notes to be submitted. In these statistics, if a sales note for a given landing is not available, then the average price for that species of fish is used instead.
The value of landings presented in the data tables are nominal (not adjusted for inflation), except in Table 23 where they are adjusted for inflation. Throughout this publication, percentage changes in values are presented in real terms adjusted to 2019 prices. The graphs in this publication also present real terms value. These statistics use calendar year deflators published by HM Treasury for the year being reported published in June of the production year, i.e. adjustment to 2019 prices has been done using Treasury deflators published in June 2020. These deflators are listed in Table 23.
7.1.3. Vessel Information
Fishers have to have a licence to be allowed to fish. UK Fisheries Administrations keep a record of every vessel that has a licence. This information includes the vessel’s length, engine power, gross tonnage, age of the vessel, the port where it is registered to and its main fishing method.
7.1.4. Employment
Information on employment in the Scottish fishing fleet is gathered by Marine Scotland (MS) through a fisher employment survey distributed to each of the 18 Scottish port districts. MS Compliance Fisheries Officers complete the survey using their expert local knowledge of the fishers in their district. In Table 41, this information is put into context of the total employment in Scotland using data on the Scottish labour force obtained from the Annual Population Survey by the Office of National Statistics.
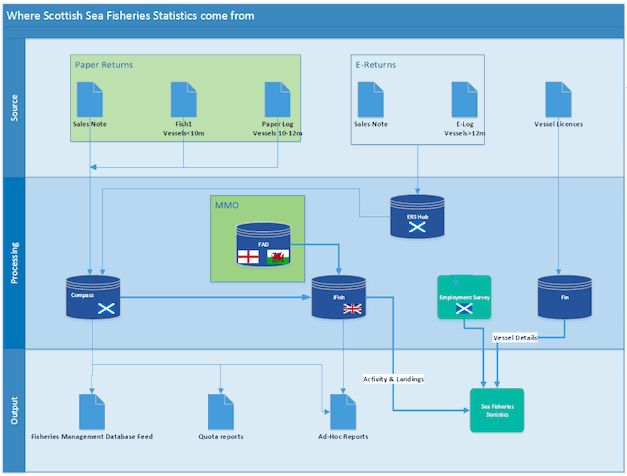
7.2. Data Processing
The process map shows how data gets from sources into this publication. Marine Scotland maintains a database called Compass that contains all of the sea fisheries data, except employment, for all Scottish vessels’ landings anywhere in the world plus all foreign vessels’ landings into Scotland. The information from paper logbooks and FISH1 forms is entered into the Compass database by MS Compliance Fisheries Officers. The information from e-logbooks is processed and checked electronically before being imported into Compass.
The data from the Scottish Compass database are then imported into the UK-wide data warehouse called IFISH. IFISH adds the data from all the UK Fisheries Administrations together into one database. This is where most of the data presented here in Scottish Sea Fisheries Statistics comes from. Currently, vessel information comes from the older Scottish Fisheries Information Network (FIN) database, which is being replaced by the newer database Compass. In future publications, Compass will completely replace FIN.
For producing this publication, the Marine Analytical Unit (MAU) in MS take a frozen ‘cut’ of data from IFISH and FIN (for vessel information only) for the previous five calendar years at the end of July. The data are then quality assured for publication (see the Quality section below).
7.3. Outputs and Publications
The Compass and IFISH databases are the sources of data for a range of different outputs and publications. As administrative data, the primary use of the data is to enforce the law on sea fisheries protection by UK Fisheries Administrations. In Scotland this is carried out by Marine Scotland Compliance. The data are also used to:
- monitor fishing quota uptake by each Fish Producer Organisation (FPO) on a weekly basis
- supply MS Science with fisheries data for marine science
- produce analysis and evidence to inform government policy and decision-making
- include the fishing industry in economic indicators
- inform the National Performance Framework indicator on sustainability of fish stocks
- assist in marine planning decisions
- answer requests for data
External data requests are often received from academics, environmental groups, the fishing industry, consultants on offshore developments, or people interested in information on their local community’s fishing industry. The Marine Management Organisation and MS Science use Scottish data as part of their submissions to the EU Commission and the International Council for the Exploration of the Sea (ICES) to monitor the fishing industry and provide scientific advice on maintaining sustainable fisheries.
7.4. Quality
As National Statistics, this publication has been assessed by the UK Statistics Authority as being of the highest standards of trustworthiness, quality and value. Data quality is assured throughout the publication process from sources to final outputs.
Sea fisheries data in this publication come from administrative databases where the primary purpose of collecting the data is for sea fisheries protection. The Marine Analytical Unit (MAU) uses the data for the secondary purpose of producing this statistical publication. As administrative data gathered under legislation for law enforcement, the data form a census (a complete dataset) that records every voyage and landing by UK fishing vessels or by any vessel landing into the UK.
7.4.1. Illegal, unreported and undeclared fishing
MS Compliance assesses that Illegal, Unreported and Undeclared (IUU) fishing (sometimes called “black landings”) as being very low with minimal impact on the trends shown in the data.
7.4.2. Data entry validation
When a fisher, agent or Fisheries Officer submits data to the database, there are automatic checks for logical inconsistencies, such as wrong combinations of ICES rectangle and sea area. When data is copied from the Scottish database Compass into the UK-wide data warehouse IFISH, there are more automatic checks to make sure the data are correct and that the data copy over correctly between the different databases. In completing the forms, fishers and agents choose from drop-down menus, which help to minimise data entry error.
7.4.3. Compliance checks
As MS Compliance use the data throughout the year for sea fisheries protection, the data are checked on an ongoing basis. If MS Compliance find errors in the data, they can request that fishers or agents supply correct data and amend the records. MS Fisheries Officers are experts on data reporting and the fishers in their port district, ensuring data quality when they enter FISH1 and paper logbook data and in finding and amending any data errors.
7.4.4. Expert user checks
The MAU also use the data throughout the year for producing reports on landings of quota fish for the Fish Producer Organisations (FPOs), for scientists in MS Science, and for internal and external queries. Expert users of the data, like the FPOs, give regular feedback on consistency between MAU’s reports and their own internal records, providing a robust external check on data accuracy, at least for quota species that are the majority of fish landings. The Marine Management Organisation (MMO) use the UK data warehouse IFISH for their own work throughout the year, providing another expert check on data quality. Additionally the fishers and agents will check their own data to ensure they are fairly and accurately represented.
7.4.5. Statistical checks
The MAU undertakes multiple checks on the data before publication. The data are checked against the provisional publication for the same year and against the final statistics for the previous year and large changes or inconsistencies are investigated further. The same programs to query the database are run each year for consistency. Data between the Scottish database and UK-wide database are compared to ensure the data have been copied over correctly. High tonnage or high value landings are investigated for accuracy and very high or low prices for sales involving one tonne or more of fish are investigated further. When errors are identified, they are sent to MS Compliance Fisheries Officers in the relevant port district for correction. MAU quality assures the results before MS policy colleagues provide further sense checks based on their expert knowledge of the industry.
7.5. Limitations of the data
Due to the legal basis for collecting sea fisheries data, the quality of the data is high and forms a census, or complete record. Some limitations of the data include timeliness, lack of data on foreign vessels in UK waters or Scottish vessels operating far from Europe and limits on the precision of marine geography.
Information on landings of fish species not subject to quota, or fish landed by UK vessels abroad, can often take months for the information to be supplied. This is why provisional statistics are not published until 4-5 months after each year end and the final statistics are published in September. The MAU assessed that approximately 0.2% of landings (by value) of Scottish vessels’ landings are omitted from the final published statistics each year due to delays in receipt of information on landings outwith the UK. However, this small incompleteness does not affect the overall trends shown by the statistics.
The data in the UK data warehouse IFISH are a complete record of all UK vessels’ voyages and landings and of all foreign vessels’ landings into the UK, but the UK does not have a system for recording foreign vessels’ catches from UK waters if they land their catch abroad. That is because the legal responsibility for recording details of that vessel and its activities lies with its own country. Similarly, sales notes are generally not supplied by a small number of Scottish-registered vessels operating far from Europe (sometimes called the far-water/distant-water fleet). As there are little data on prices of exotic species landed outside of Europe, prices are estimates only. This only affects a very small amount of the overall tonnage and value of landings.
A small number of records will be identified as erroneous but will not be amended immediately. This is because they serve as a legal record of what fishers and agents supplied to MS Compliance under sea fisheries protection law. If MS Compliance takes enforcement action, then known errors may not be able to be amended until the case is resolved. This affects a very small number of records so the impact on published figures and trends is minimal.
Some data presented in this publication by a specified geography – such as by local authority or ICES Area of fish capture – are limited by the complexity of marine geography. Data on area of capture are not available below the level of an ICES rectangle, a 30 nautical mile by 30 nautical mile area, and the data do not report whether fishing occurred in inshore or offshore areas. When considering terrestrial geographies such as local authorities or port districts, there is often a mismatch between these and marine geographies such as Scottish Marine Regions or ICES Rectangles.
7.5.1. Change in recorded landings by Scottish vessels since
provisional statistics
The time lag between sales and the provision of sales notes can cause changes between provisional and final statistics for a given year. Value of landings information is derived from sales notes, which are submitted by Registered Buyers and Sellers. This information is matched up with the landing declaration submitted by the vessel to obtain values for each landing. If there is no sales note, for example when a UK vessel lands into a non-EU country, the value of the landing is estimated. The most accurate estimation is based on the average price for the same species in the same quarter of the previous year. If that method is not available, the database uses the next most accurate method based on the price for the same species in the previous quarter, and then opens up to the same species type, and so on. When a sales note is supplied for that landing, the estimates are replaced by the true figure from the sales note.
7.5.2. Revisions to provisional statistics
Compared to the provisional 2019 edition, the main statistics for 2019 have changed very little. However, pelagic tonnage and value have seen an increase due to a manual addition of a few mackerel landings which were missing from the IFISH database as a result of the vessels landing into more than one port on one voyage. The value of these landings was estimated using the average price for the same species into the same country of landing in 2019. Vessel numbers increased by two, with both additions being 10m and under vessels. Fisher numbers remained consistent with the provisional statistics.
| Tonnage | Value | |
|---|---|---|
| Pelagic | 2.9% | 6.9% |
| Demersal | <0.1% | 2% |
| Shellfish | 0.8% | 1.5% |
| Total | 1.9% | 3.4% |
| Vessel numbers | 0.1% | |
| Fishers employed | 0% |
7.5.3. Revisions to previous years’ final statistics
The landings tables present data for the past five years. Previous years’ data are updated to ensure users have access to the latest data available. Revisions are typically small and affect landings information where data comes from logbooks, landing declarations and sales notes that can be amended for small changes (usually in the order of 0.2%) due to late data entry or rectification of errors. As these do not affect the main trends presented, they are not highlighted and not footnoted. Data older than five years is not updated.
The list of the main species displayed in the landings tables may change each year as the criterion for a species being a ‘main species’ is that the total value landed into the UK or by UK vessels is £2 million or more.
On the rare occasions that revisions are required in the previously published figures that do affect the main trends presented, the revised figures are marked "(r)" and suitably footnoted to explain the reason for the revision. The statistics are routinely revised between the provisional statistics and final statistics – see above. However, provisional statistics are always explicitly identified as such. Vessel numbers and employment remained unchanged as these data are collected once for the final version of each edition of the publication.
| Tonnage | Value | |
|---|---|---|
| Pelagic | -0.1% | -0.1% |
| Demersal | -0.2% | -0.2% |
| Shellfish | 0.1% | 2.9% |
| Total | -0.1% | 0.7% |
Prior to the publication of the 2019 statistics, there was an update in the price estimation methodology affecting all species. This affects the methodology used for all price and value estimation since late 2016, leading to a small increase in overall value compared to previously released statistics since 2016. Estimated prices and values for Nephrops and scallops were the main species affected by this change, leading to the change in shellfish value shown above. This statistics release has used the updated methodology for all affected years.
7.5.4. Comparability with other countries’ statistics
EU legislation covers information requirements for vessels over 10 metres and for all buyers and sellers, which means that data are comparable for all countries within the UK and for all EU countries. The main difference between information collated in Scotland and that collated in the rest of the UK is that, through the FISH1 returns, Scotland obtains equivalent information on a full coverage basis for vessels of 10 metres and under. In the rest of the UK, this information is provided on a sample basis only. However, the vast majority of fish are caught by vessels over 10 metres, so the information is effectively comparable for all UK countries for most species.
The method for counting Scottish registered vessels is by totalling the number of active vessels registered in Scottish ports on 31st December of each year. In comparison, in the rest of the UK vessels are counted if they are registered (regardless of whether they are classed as active or not). This can lead to slight discrepancies between figures published at the Scottish level and those published at the UK level. Eurostat figures for vessel numbers come from the European Community Fleet Register vessel database rather than Marine Scotland’s own vessel database. This can result in discrepancies for UK vessel numbers between UK and Eurostat publications. For 2018, this discrepancy was 10 fewer vessels (less than one per cent) in UK Sea Fisheries Statistics than in Eurostat.
7.6. Removal of Tables
During the production of the 2019 Scottish Sea Fisheries statistics, the decision was made to remove several tables from the publication. The reasons behind this decision are detailed below.
7.6.1. Method of Disposal
The table showing landings by method of disposal (formerly Table 32 in the 2018 publication) seemed to be uninformative and did not appear to present a true picture of fish products used for rendering. Following consultation with the Scottish Sea Fisheries statistics user group, the decision was to remove this table from the 2019 and future editions of the publication.
7.6.2. Vessel’s by Main Fishing Method
During the production of the 2019 Scottish Sea Fisheries statistics, concerns were raised regarding the reliability of the main fishing method for active vessels due to the discontinuation of a data source.
Previous publications used fishing method as declared on a vessel’s licence, which is updated when a new licence is applied for. However, this data source is no longer regularly kept up to date between licence applications. Further investigation found differences between the number of vessels using different fishing methods from the discontinued licence data source and those estimated from up to date data sources such as the declared gear by fishers used on a particular vessel voyage.
This means that for the 2019 report, all tables containing information on main fishing method have been removed from the publication. For future publications, MAU plans to develop a new methodology for robustly estimating the main fishing method of a vessel.
The affected and therefore removed tables are the following:
- Table 38: Number of active Scottish registered vessels by main fishing method as at 31st December 2019.
- Table 39: Number of active Scottish registered vessels by district and main fishing method as at 31st December 2019.
- Table 40: Number of Scottish registered vessels by main fishing method and length group as at 31st December 2019.
Furthermore, any charts and text discussing this data have been removed from the commentary.
Contact
Email: fisheriesstatistics@gov.scot