Scottish Prison Population Statistics 2021-22
The latest longitudinal statistics on prison populations and flows into and out of prison. Includes information about the demographics of people in prison, the time they spend there, their sentences and offences.
1 Average Daily Populations
[Supplementary tables A1]
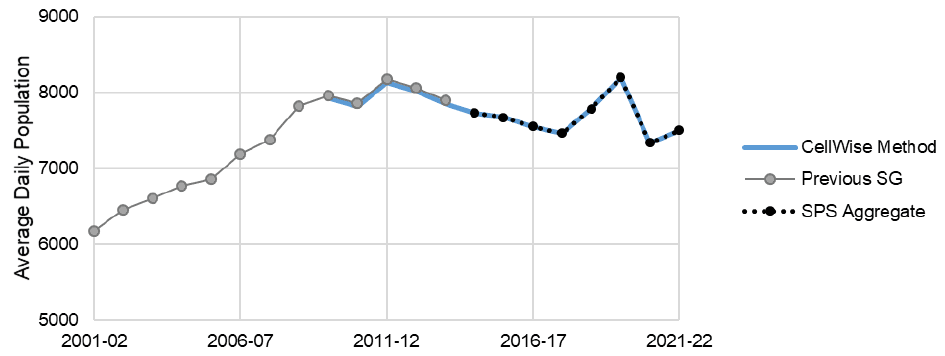
Responses to Covid related public health measures across the Justice System continued to impact on Scotland’s prison population in 2021-22. The average daily prison population[5] in 2021-22 was 7,504. This is only a small increase of 2% from the previous year (7,339), which indicates broad stability in average daily population levels across the reporting years.
1.1 Change in context - COVID impacts on the prison population
[Supplementary tables X1]
Using only annual average daily population figures masks in-year changes in population levels. Under normal conditions, the changes occuring in the prison population on a day-to-day or week-to-week basis are small relative to the size of that population overall. However, as reported in the Scottish Prison Population Statistics 2020-21[6], coronavirus public health measures and the adaptations to these across the justice system, led to rapid and significant changes in the prison population from Spring 2020.
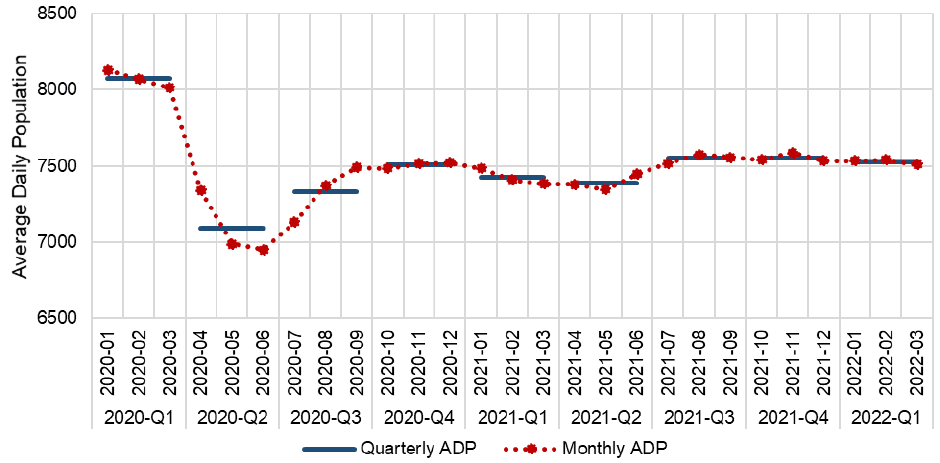
Figure 2 shows the month-to-month changes in the prison population from January 2020 to March 2022. The average prison population fell rapidly in the first three months of the pandemic, from around 8,000 in March 2020 to just under 7,000 by June. The population rose thereafter, and broadly stabilised from September 2020 at around 7,500. The chart shows that the average prison population remained stable at this level throughout 2021-22.
In the previous publication in this series[7], it was reported that compliance with public health measures during the pandemic influenced operations across the criminal justice system. The Lord Advocate issued revised guidelines on the use of police custody, and the courts had to close for extended periods or operate at reduced capacity. Prison establishments had to ensure sufficient space to allow prisoners to observe public health measures.
The impact of justice system responses to public health measures in 2020-21 included: a decreased volume of custody cases reported to the Crown Office and Procurator Fiscal Service, and an increased volume of undertakings reports[8]; a reduced likelihood of an accused being remanded[9]; a reduced volume of concluded cases in courts, with subsequent reduction in custodial sentences issued and growth in the trial backlog[10]; and an agreement in the initial stages of the pandemic response to early release of eligible short term sentenced prisoners[11].
Combined, these changes across the justice system impacted both the in-flows to custody and the out-flows from custody throughout 2020-21. While there was no further early release of prisoners, the changes observed in the first pandemic year continued across 2021-22. The impacts of the changes occurring in response to the pandemic have not yet been fully isolated in the data held by the Scottish Government. However, it is reasonable to conclude that the changes described above have resulted in the lower prison population levels reported in 2020-21 and 2021-22. This should not be interpreted as indicative of longer-term prison population trends. Chapter 10 outlines other important factors determining the level and composition of the prison population, all of which may contribute to further changes in the coming years.
1.2 Legal status
[Supplementary tables M1 and X1]
There are known discrepancies between legal status populations determined using cellWise data and the live system data in other published sources. See section 9.1 for details.
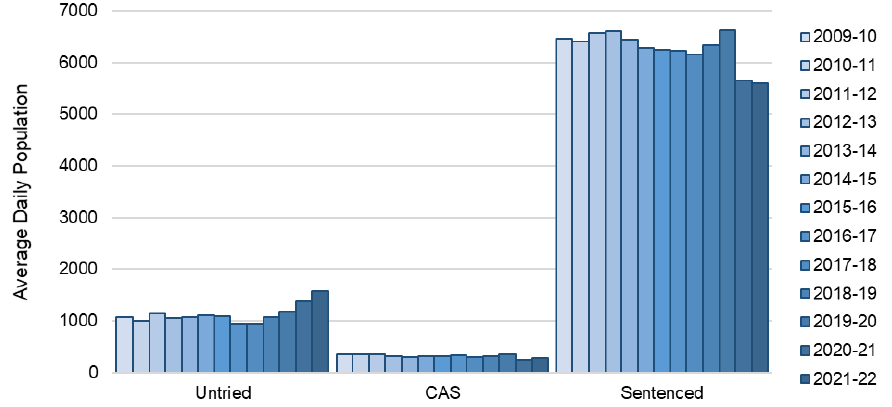
The overall (average daily) prison population remained broadly stable between 2020-21 and 2021-22, increasing by just 2%. However, this pattern varied by legal status. Figure 3 breaks the average daily population down by legal status[12] category, showing that the sentenced population remained at very similar levels in 2020-21 and 2021-22, falling by 61 in 2021-22 (-1% to 5,597). Over the same period, the untried population increased by almost 14%, from 1,384 in 2020-21 to 1,571, while the convicted awaiting sentence (CAS) population increased by 41 (+16% to 291).
The overall (average daily) remand population (untried + CAS) increased by 14% between 2020-21 and 2021-22. On the average day in 2021-22, 1,862 prisoners were on remand. This is the highest annual level recorded to date and, at 25% of the population, the largest proportion on remand on record.
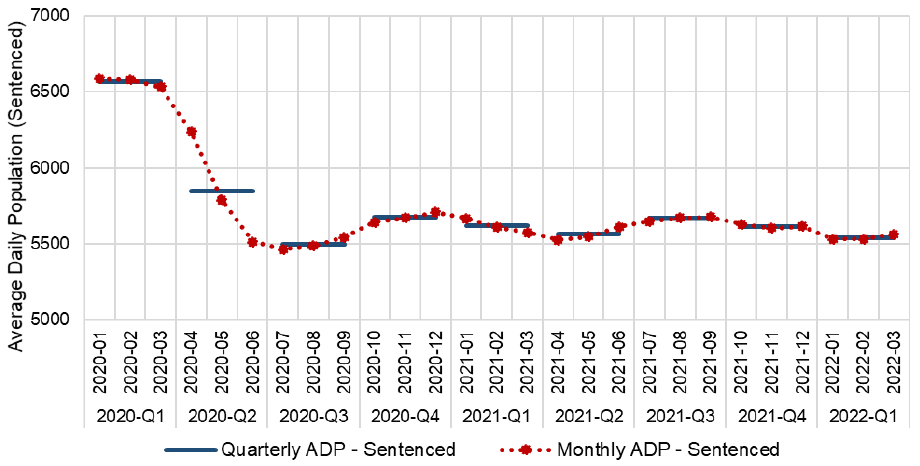
Figure 4 and Figure 5 provide the monthly and quarterly remand and sentenced populations over the past two years. After an initial sharp decrease the remand population grew rapidly to September 2020 – levelling off during the remainder of 2020-21 at a higher level than pre-pandemic. During 2021-22 the remand population has risen again but at a slower rate of growth than observed in 2020.
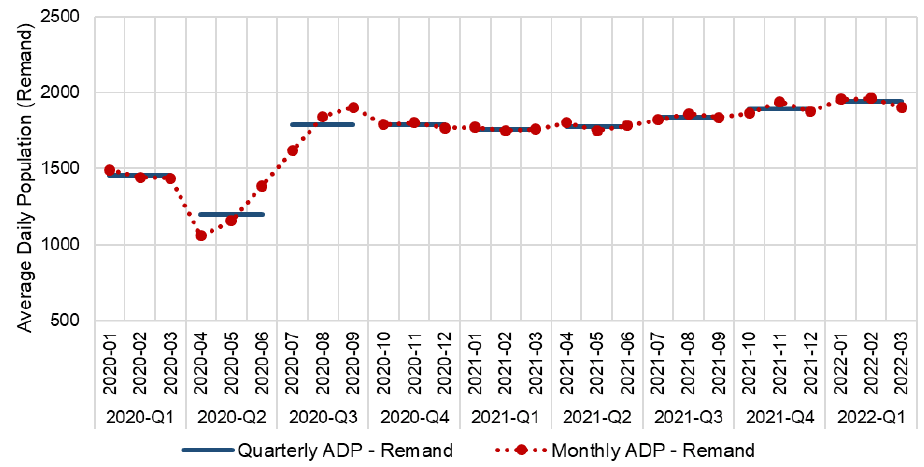
The sentenced population fell substantially and rapidly between April and July 2020. Since then it has remained broadly stable (between 5,500 and 5,700 until March 2022) and remained considerably below pre-pandemic levels.
1.3 Index Offence Groups
[Supplementary tables M2]
This section examines the index offence groups of the (average daily) sentenced population. A more detailed discussion of the categories within these groups is provided in section 4. The alleged offences of those held on remand are discussed in section 5.
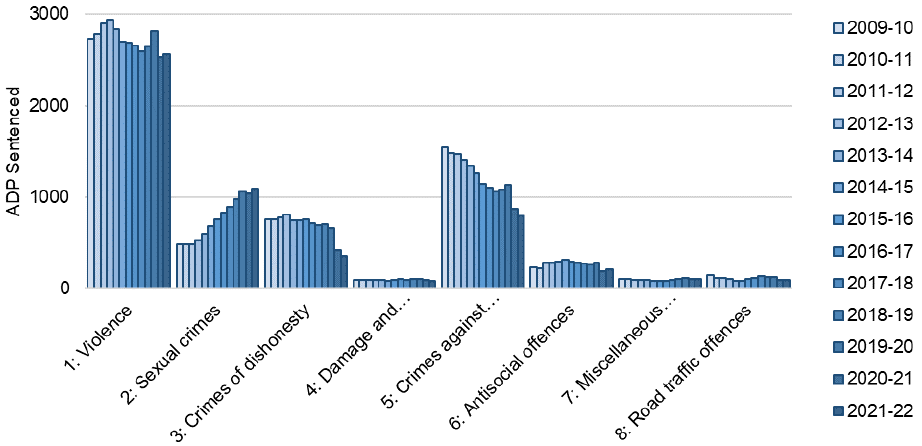
Overall, there was a 1% reduction in the sentenced population between 2020-21 and 2021-22. However there were changes across the different index offence category groups[13] through 2021-22, and these varied in direction and extent as Figure 6 shows. The patterns observed reflect both the impacts of the pandemic and a continuation of pre-existing trends.
The population with index offences in Group 1 (Violence), Group 2 (Sexual crimes) and Group 6 (Anti-social offences) increased slightly, while the population in other groups fell slightly or remained stable.
The varied reduction across index offence groups continues to change the overall offence profile of the prison population. This change over the past decade is driven by a consistently large (average daily) population with index offences in Group 1, a growing population in Group 2 and falling populations with index offences in Group 3 (Dishonesty) and Group 5 (Crimes against society).
As a proportion of the sentenced population overall, those with Group 1 (Violence) index offences increased from 44.8% to 45.7% and Group 2 (Sexual) index offences increased from 18.5% to 19.5% between 2020-21 and 2021-22.
Over the same period, the proportion of the sentenced population with index offences in Group 5 (Crimes against society) fell by 1.1 points from 15.4% to 14.3%. Group 3 (Dishonesty) fell by 1.1 points from 7.5% to 6.4% of sentenced population.
1.4 Index sentences
[Supplementary tables M3]
The index sentence is the longest single sentence being served in each occupancy period[14]. Where a person in prison has multiple custodial sentences, the overall sentence length cannot be calculated from the available data. This is due to a lack of information as to whether multiple custodial sentences are to be served consecutively or concurrently. Where an individual is given multiple sentences to be served consecutively (a common occurrence with multiple short sentences), their overall sentence length will be longer than the longest individual sentence.
For clarity, the sentence bands presented in the supplementary tables and in the interactive analysis tool[15] have been compressed in the following charts in this section.
During 2021-22, the (average daily) sentence population fell by around 1%, but as shown in Figure 7 this pattern was not observed across index sentence bands. Population groups serving shorter index sentences (i.e. less than 4 years) fluctuated in size between 2020-21 and 2021-22, but population groups serving longer index sentences (4 years or more) remained broadly stable over the same period.
The (average daily) population serving index sentences of one year or less increased by around 13% from 880 in 2020-21 to 998 between 2020-21 and 2021-22. Over the same period there was a 19% decrease in the 2<=4 year category, from 866 to 705.
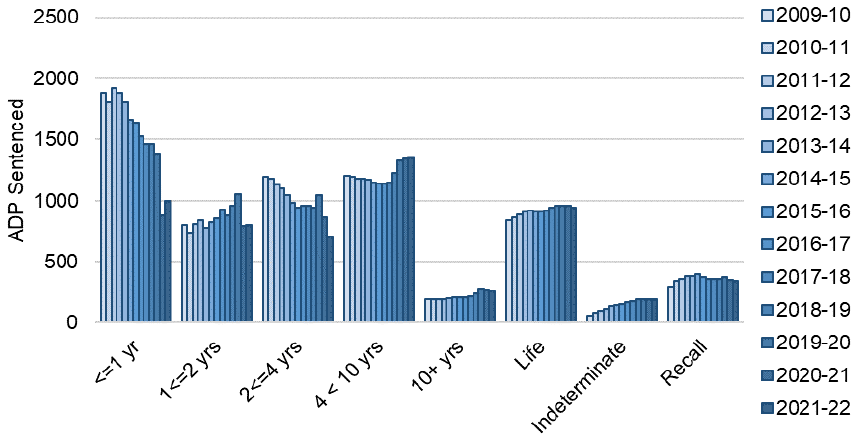
The share of the sentenced population serving shorter index sentences remains below pre-pandemic levels. In 2019-20, 53% of the sentenced population had index sentences of 4 years or less. In 2021-22 this proportion had fallen to 45%.
1.5 Further population characteristics
The following two chapters of this report discuss the average daily populations of women (section 2) and young people (section 3) in custody. Further information on other age groups, as well as information on other available protected characteristics (ethnicity, disability, sexual orientation), and breakdowns by prison establishment and armed forces history are available in the Supplementary Tables B1-7 and M1 accompanying this release.
Further exploration of these data can be conducted through the interactive analytical tool at https://scotland.shinyapps.io/sg-prison-population-statistics/.
Contact
Email: Justice_Analysts@gov.scot