Scottish Prison Population Statistics 2021-22
The latest longitudinal statistics on prison populations and flows into and out of prison. Includes information about the demographics of people in prison, the time they spend there, their sentences and offences.
6 Individuals Experiencing Imprisonment
[Supplementary tables B2 and M1]
The number of individuals[26] who spent any time in prison remained at a very similar level in 2021-22 compared to 2020-21, increasing by only 1% from 14,241 to 14,411 (see Figure 16). While there is a longer term downward trend in the numbers of individuals experiencing imprisonment year-on-year, the number of individuals recorded in 2021-22 is considerably below pre-pandemic levels. This likely reflects the impacts of the pandemic on justice system operations, as discussed in section 1.1.
Note that the measure of individuals differs from average daily population discussed in previous chapters in that each individual is given equal weight regardless of how long they spent in prison.
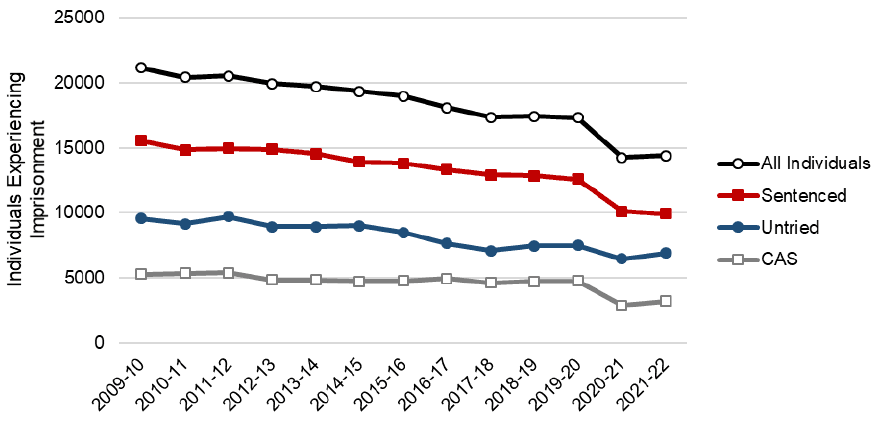
Figure 16 shows that while there was overall stability in the number of individuals experiencing imprisonment between 2020-21 and 2021-22, the pattern does vary when broken down by legal status. Between 2020-21 and 2021-22, the number of individuals spending any time as sentenced remained broadly stable, falling by just 2% (from 10,127 to 9,923). On the other hand, the number of individuals spending time as convicted awaiting sentence increased by 11% (from 2,883 to 3,210) and the number of individuals spending time as untried increased by 7% (from 6,480 to 6,915), bringing this figure closer to pre-pandemic levels[27].
Note that an individual can have more than one legal status type each year. This means that the total number of individuals across the legal status types will sum to more than the total number of individuals held in custody in each year.
The rest of this section examines the changes in the characteristics of individuals experiencing imprisonment.
6.1 Gender
[Supplementary tables B2 and M1]
The number of women who spent any time in prison over the course of the year has halved over the past decade, from 1,720 in 2011-12 to 857 in 2021-22. Over the same period the number of men spending any time in prison fell by 28%, from 18,815 to 13,552.
As per 2020-21, women made up just 6% of individuals experiencing imprisonment in 2021-22.
The numbers of men and women spending any time in prison during 2021-22 were very similar to those recorded in 2020-21. In 2021-22, 13,552 men experienced imprisonment (+1% from 2020-21), as did 857 women (-1% from 2020-21).
While there is overall stability in the number of individuals recorded for men and women, this pattern varies by legal status. For men, the pattern follows that for the overall numbers of individuals – increases of 7% (6,034 to 6,481) and 11% (2,657 to 2,945) in the numbers experiencing imprisonment as untried and convicted awaiting sentence respectively between 2020-21 and 2021-22, and a decrease of just 2% (9,625 to 9,463) in the numbers experiencing imprisonment as sentenced.
For women, the pattern is different. While the numbers of women experiencing imprisonment as convicted awaiting sentence and sentenced followed the same direction as the numbers of men between 2020-21 and 2021-22, the proportionate change is greater for both at +18% for convicted awaiting sentence (224 to 265) and –8% for sentenced (501 to 459). In contrast to the pattern seen for men, the numbers of women experiencing imprisonment as untried decreased by 3% (445 to 433).
6.2 Age
[Supplementary tables B2 and M1]
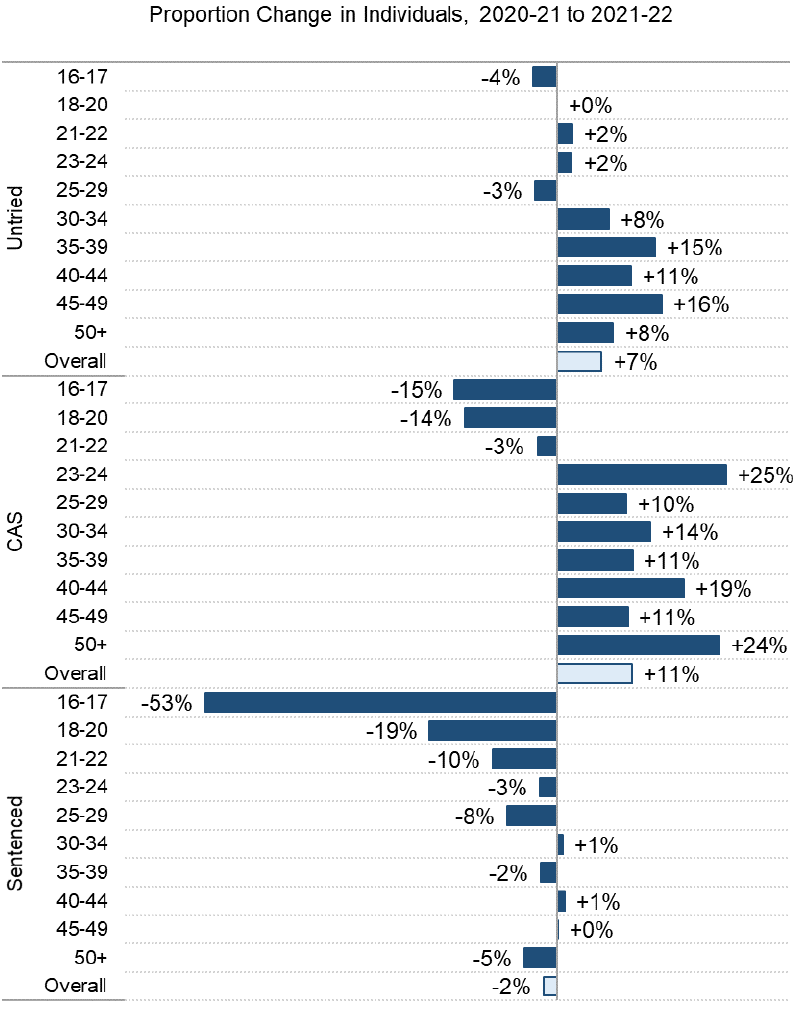
While there is broad stability in the number of individuals experiencing imprisonment as sentenced, and increases in the number experiencing imprisonment as untried or convicted awaiting sentence between 2020-21 and 2021-22, this pattern varies by age group.
Figure 17 shows that the increase in individuals experiencing imprisonment as untried is driven largely by increases in the older age groups (30+ years old). Similarly, the increase in individuals experiencing imprisonment as convicted awaiting sentence is driven by increases in individuals aged 23 years or older. The stability in individuals experiencing imprisonment as sentenced is only seen by the middle age groups (30-49 years), with younger (16-29) and older (50+) groups experiencing greater proportionate decreases.
The previously reported trend[28] of an aging group of people experiencing imprisonment continued in 2021-22. The average age of individuals spending any time in prison in 2010-11 was 31.8 years; by 2021-22 this had risen to 36.9. The proportion aged 55 years or older has more than doubled in ten years, rising from 3.5% to 8.1%.
6.3 Ethnicity
[Supplementary tables B3]
Individuals identifying as White continued to form the largest ethnic group within those experiencing imprisonment in 2021-22 (94%)[29].
There was broad stability in the number of individuals experiencing imprisonment across the White and Asian ethnic groups, and increases in the number of individuals from all other ethnic groups. Overall there was little change to the proportion of individuals each ethnic group represented between 2020-21 and 2021-22.
In 2021-22, the rate of imprisonment for the White and Asian ethnic groups remained similar to the previous reporting year (3.2 and 2.4 per 1,000 respectively). The imprisonment rates remained higher for the African, Caribbean and Black and Other Ethnic groups, and showed an increase from the rates seen in 2020-21 (from 6.3 to 8.2 and from 5.8 to 7.2 per 1,000 respectively). The rate for the Mixed or Multiple Ethnic group also increased, from 3.7 per 1,000 in 2020-21 to 4.5 per 1,000 in 2021-22[30].
Ethnic groupings have been aggregated in this report, which is likely to mask variations within each group. Disaggregation of prisoner ethnicity data is currently being pursued for future analyses.
6.4 Other individual level characteristics
Statistics on other available protected characteristics (disability, sexual orientation, and marital status) and armed forces history are provided in the Supplementary Tables B4-7 accompanying this publication.
Contact
Email: Justice_Analysts@gov.scot