Scottish Housing Market Review: Q4 2022
Quarterly bulletin collating a range of statistics on the Scottish housing market, such as house prices and transactions, rental trends, cost and availability of finance, etc.
Part of
6. Mortgage Interest Rates
In March 2020, Bank Rate was cut by a total of 65 basis points to 0.1% as a result of the Covid-19 pandemic. More recently in response to the rise in inflation, the Bank of England has increased the Bank rate nine times in the last 12 months, most recently by 75 basis points in November 2022 and by 50 basis points in December 2022. Over the past 12 months, Bank rate has increased by 340 basis points to 3.50%, its highest level since 2008.
A 340 basis point increase in interest rates is estimated to increase the monthly payment by around £300 per month for an average new variable rate and by around £170 per month on the average outstanding variable rate mortgage in Scotland.
Chart 6.1 and Chart 6.2 show data on the effective (or average) interest rates on outstanding mortgage balances and new mortgage advances, which are available up to October 2022. (Source: BoE). From December 2021 to October 2022, the increases in mortgage rates were below the cumulative 215 basis point increase in Bank Rate during this period: the average variable rate on outstanding mortgages increased by 170 basis points to 4.02%, the average variable rate on new advances increased by 180 basis points to 3.40%, and the average fixed rate on new advances increased by 151 basis points to 3.09%. The average fixed rate on outstanding mortgages was in fact little changed over this period, since even though interest rates on new deals were increasing, they were not above the rates on fixed rate deals which expired during this period.
Effective Monthly Mortgage Interest Rates (UK)
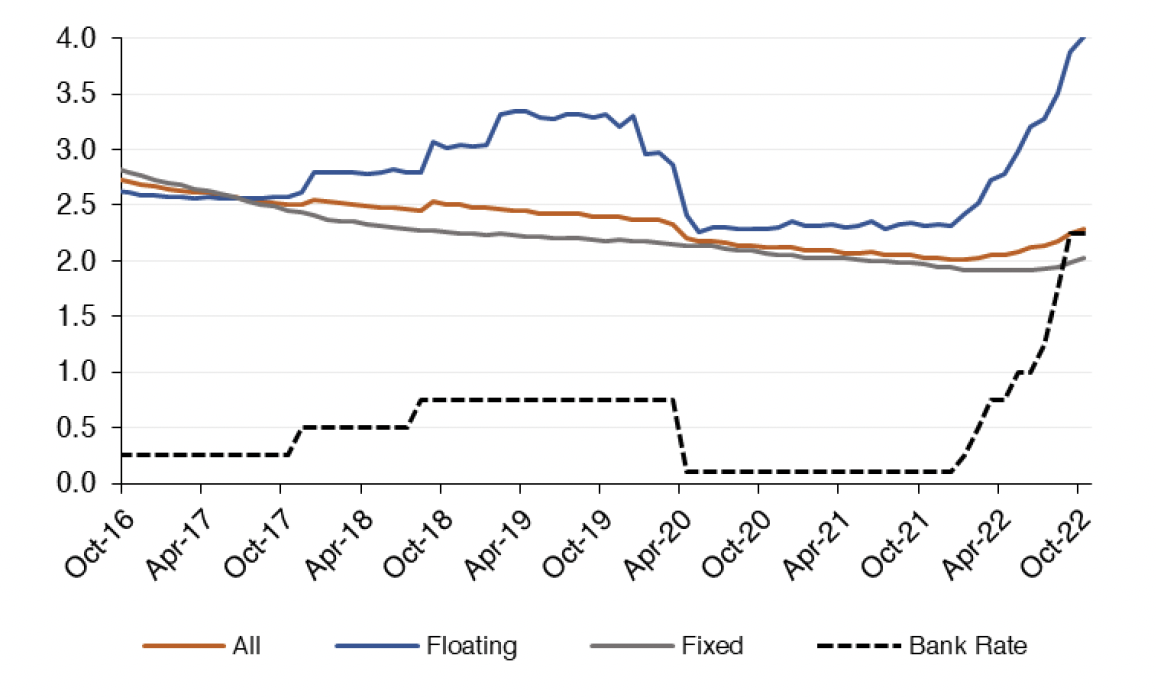
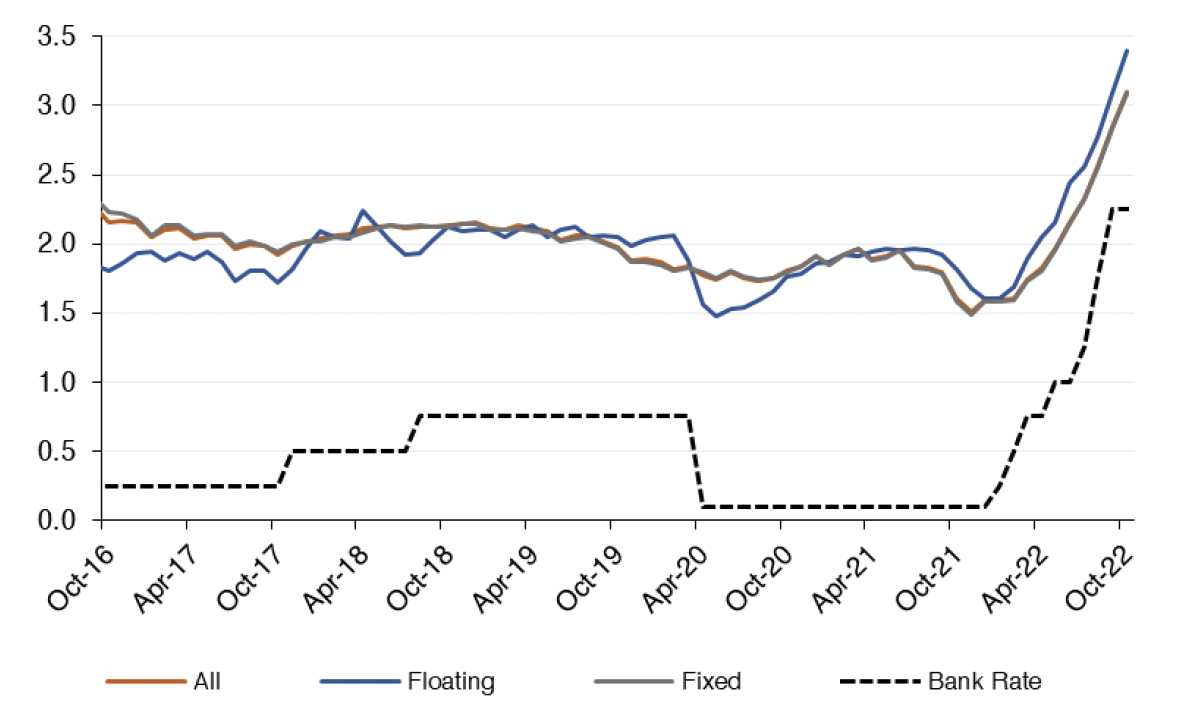
Source: Bank of England
The spread between the average advertised rate on 2 year fixed 90% and 75% LTV mortgages increased during the pandemic from 51 basis points in April 2020 to 189 basis points in December 2020, as shown in Chart 6.3. However, from April 2021 the spread fell from 189 basis points to 31 basis points in January 2022, with the spread remaining stable since then. In November 2022, the spread stood at 28 basis points. (Source: BoE)
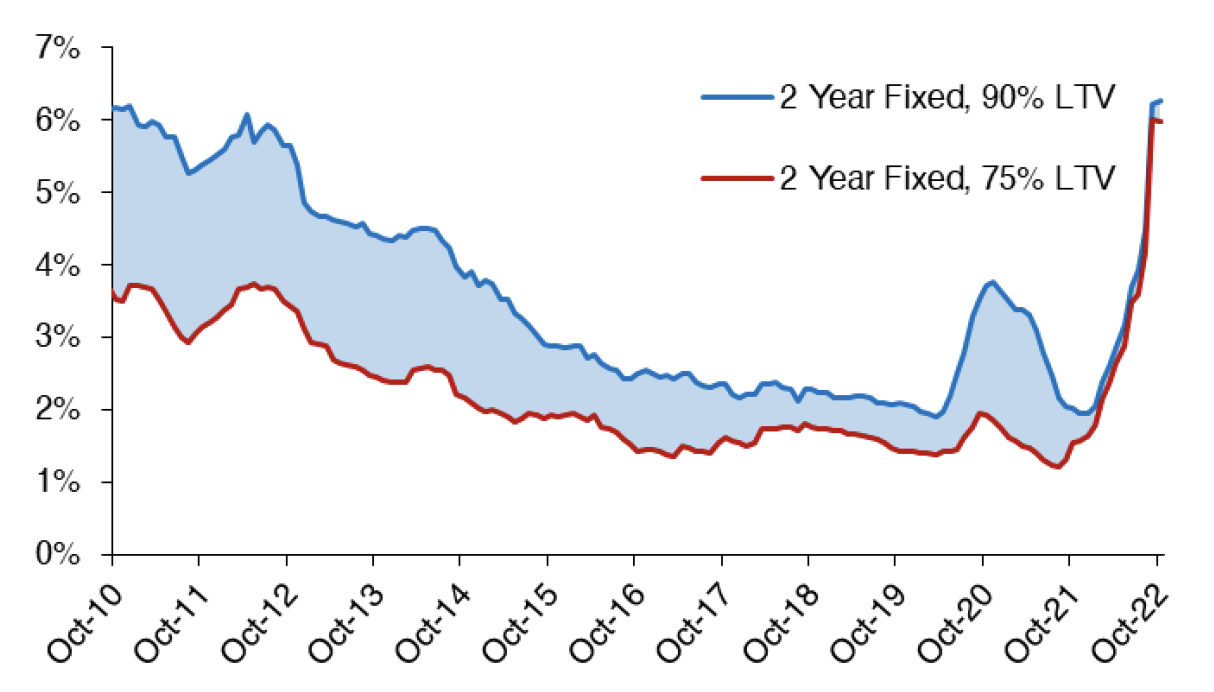
Source: Bank of England
Moneyfacts' data for 1 October 2022, after the UKG Plan for Growth/mini-Budget on 23 September, shows that the average two-year and five-year fixed rates had increased by 119 and 90 basis points relative to 1 September 2022, reaching 5.43% and 5.23% respectively. By 20 October, both of these rates had breached 6%, with the average two-year rate at 6.65% and the average five-year rate at 6.51%. Since then, the average two-year and five-year fixed rates have fallen slightly, with the average two-year fixed rate at 6.01% and the average five-year fixed rate at 5.80% as at 1 December 2022. (Source: Moneyfacts Mortgage Treasury Report and news release).
Chart 6.4 shows that the trend for an increasing share of regulated[1] mortgages to be at fixed rates has continued, with 95.5% of new mortgages and 86.2% of outstanding mortgages on fixed rates as of Q3 2022. The corresponding figures for unregulated[2] mortgages are 95.2% and 75.2%. (Source: FCA)
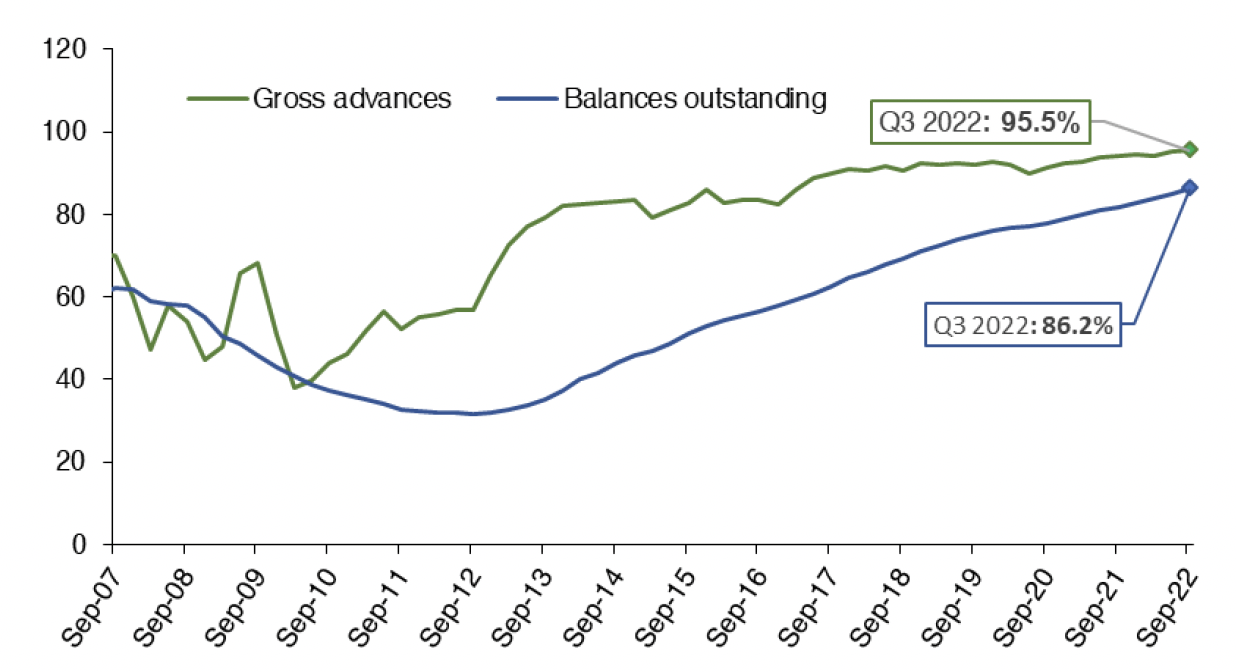
Source: FCA
Contact
Email: bruce.teubes@gov.scot